Cryo-electron microscopy (cryoEM) multi-grid screening is often a tedious process that demands hours of attention. This protocol shows how to set up a standard Leginon collection and Smart Leginon Autoscreen to automate this process. This protocol can be applied to the majority of cryoEM holey foil grids.
Method Article
Cryo-Electron Microscopy Screening Automation Across Multiple Grids Using Smart Leginon
* These authors contributed equally
In This Article
Summary
Abstract
Advancements in cryo-electron microscopy (cryoEM) techniques over the past decade have allowed structural biologists to routinely resolve macromolecular protein complexes to near-atomic resolution. The general workflow of the entire cryoEM pipeline involves iterating between sample preparation, cryoEM grid preparation, and sample/grid screening before moving on to high-resolution data collection. Iterating between sample/grid preparation and screening is typically a major bottleneck for researchers, as every iterative experiment must optimize for sample concentration, buffer conditions, grid material, grid hole size, ice thickness, and protein particle behavior in the ice, amongst other variables. Furthermore, once these variables are satisfactorily determined, grids prepared under identical conditions vary widely in whether they are ready for data collection, so additional screening sessions prior to selecting optimal grids for high-resolution data collection are recommended. This sample/grid preparation and screening process often consumes several dozen grids and days of operator time at the microscope. Furthermore, the screening process is limited to operator/microscope availability and microscope accessibility. Here, we demonstrate how to use Leginon and Smart Leginon Autoscreen to automate the majority of cryoEM grid screening. Autoscreen combines machine learning, computer vision algorithms, and microscope-handling algorithms to remove the need for constant manual operator input. Autoscreen can autonomously load and image grids with multi-scale imaging using an automated specimen-exchange cassette system, resulting in unattended grid screening for an entire cassette. As a result, operator time for screening 12 grids may be reduced to ~10 min with Autoscreen compared to ~6 h using previous methods which are hampered by their inability to account for high variability between grids. This protocol first introduces basic Leginon setup and functionality, then demonstrates Autoscreen functionality step-by-step from the creation of a template session to the end of a 12-grid automated screening session.
Introduction
Single particle cryo-electron microscopy (cryoEM) allows for near-atomic resolution structure determination of purified macromolecular complexes. A single particle cryoEM experiment only requires one or two well-chosen grids selected from a much larger set of grids with varying sample and grid conditions. Microscope screening to examine these grids entails imaging each grid at several magnifications to determine which grid satisfies most key requirements for high-resolution data collection, including ice thickness, sufficient areas for full data collection, protein purity, protein concentration, protein stability, and minimal preferred orientation issues1. Optimizing for these key requirements often involves feedback between screening at the microscope and preparation conditions such as protein production, buffer selection, potential detergents, and grid type2,3,4 (Figure 1). Conventional grid screening is performed manually or semi-manually with software such as Leginon5, SerialEM6, and EPU7. Conventional screening requires the microscope operator to spend hours at the microscope to screen several grids, which creates a significant bottleneck in the high-resolution single particle workflow by occupying the operator with rote operations rather than sample/grid optimization.
Previously, Smart Leginon Autoscreen and the underlying machine learning software, Ptolemy, have been introduced, and their underlying methods and algorithms together with examples have been described8,9. Several other software packages are either capable of or working towards fully automated multi-grid screening10, including SmartScope11, Smart EPU12, and CryoRL13,14. To address the screening bottleneck, Smart Leginon allows the user to first set up screening parameters in a template microscope session, then use that template session's parameters as a template to screen the full cassette of grids in the microscope autoloader. All manual work during the cassette screening is eliminated, which allows for the optimization feedback loop to proceed significantly more efficiently.
In this protocol, the full Smart Leginon Autoscreen workflow is described so that the reader may perform fully automated multi-grid cryoEM screening independently. For those new to Leginon, the first section in the protocol describes conventional Leginon usage. This knowledge is composed of several years of experience across several autoloader microscopes, which is then built upon in the subsequent Smart Leginon section of the protocol. Additional tutorial videos may be found on https://memc.nysbc.org.
Protocol
To follow this protocol, depicted in Figure 2, Leginon 3.6+ needs to be installed on the microscope computer and on an additional Linux workstation, and Ptolemy needs to be installed on the Linux workstation. This protocol has been developed over several years using Thermo Fisher Scientific (TFS) Glacios and Krios microscopes. This protocol assumes that the reader has already configured Leginon, Appion15, the associated database, microscope calibrations, performed direct alignments on the microscope, and has set up two Leginon Applications: One for standard single particle collection and one for single particle collection with Ptolemy. Information for setting up Leginon is available here: https://emg.nysbc.org/redmine/projects/leginon/wiki/Leginon_Manual. Information for setting up Ptolemy within Leginon is available here: https://emg.nysbc.org/redmine/projects/leginon/wiki/Multi-grid_autoscreening. Download Leginon from http://leginon.org and Ptolemy from https://github.com/SMLC-NYSBC/ptolemy. Leginon is licensed under the Apache License, Version 2.0, and Ptolemy is licensed under CC BY-NC 4.0.
1. Leginon usage
- Start Leginon
- On the microscope Windows computer, close any Leginon clients, then re-open it. In the Linux workstation, open a terminal window and type start-leginon.py or the system's appropriate alias for starting Leginon.
- In the new Leginon Setup window, select Create a new session and click Next.
- Select the project from the dropdown list and click Next.
- Leave the Name as it is, select the correct holder for the microscope setup, and click Next.
- For the description, enter relevant information such as the microscope name, grid/sample description, and experiment description, then click Next.
- For the image directory, make sure the appropriate filesystem is selected, and that the full path is appropriate for saving images, then click Next.
- Under Connect to clients, click Edit. In the dropdown menu, select all of the computers that should be connected and click the + button for each, then click OK and Next.
- Input the correct C2 aperture size and click Next. This value can be found in the Apertures tab of TFS TUI software.
- Leginon interface
- Select Application from the toolbar and click Run.
- Select the proper Application from the dropdown menu (click Show All if necessary). Set main to the Leginon computer and scope and camera to that respective computer, then click Run. The left side of the main Leginon window will populate with nodes.
NOTE: The left panel shows all Leginon nodes. The green camera icon nodes are the images that will be saved: Grid, Square, Hole, and Exposure. Nodes with the target sign are lower magnification images for targeting the higher magnification images. The purple camera nodes are the nodes that are programmed to find eucentric z-height and eucentric focus. Additionally, there are nodes to align the Zero loss peak, monitor buffer cycle, monitor liquid nitrogen filling, collecting gain correction images, calculating ice thickness (IceT), and navigating the grid through different magnifications using stage and image shift. - Presets manager
- Click on the Presets_Manager node. In that node, click the bottom icon for importing presets or the icon above that one to create a new preset from the current state of the microscope.
- If the bottom icon is clicked, an Import Presets window will open. Select the correct TEM and digital camera, then click Find and select the most recent session with the desired presets. Highlight all desired presets and click Import, then click Done.
NOTE: The Presets Manager node should now list all imported and created presets. It is recommended to have presets for several magnifications and focusing, including gr: Grid Magnification, sq: Square Magnification, hln: Hole Magnification, fan: Auto-focus, fcn: Central focus, enn: Exposure Magnification (trailing 'n' refers to nanoprobe). Typical preset parameters for each magnification are shown in Table 1, Table 2, and Table 3. Note that this protocol uses a C2 aperture size of 70 µm for the Glacios, 50 µm for the Krios with a Selectris X and Falcon 4i, and 100 µm for the Krios with a BioQuantum with a K3.
- Navigation and eucentric height
- To become familiar with controlling the microscope through Leginon and to set the z-height of the grid, go to the Navigation node, select the gr preset at the top, and click on the red arrow to the right to send the preset settings to the microscope. The microscope should update after 1-2 s. Once updated, click the camera button to the right to acquire an image.
- Using the cursor tool, select a grid square for where to move the stage. Click the sq magnification and then the red arrow to send to the microscope, and click the camera button to acquire an image.
- Go to the Z_Focus node and click the Simulate Target button at the top near the middle of the buttons. While images are being collected for stage tilt focusing, switch to correlation view and watch the peak to ensure that it is in the corner of the correlation image. Once focusing is finished, ensure the stage is set to the grid's z-height.
- Coma correction
NOTE: This sub-section assumes that direct alignments have already been performed and that coma corrections have not been performed.- Navigate to an area of the grid that produces clear Thon rings, such as carbon substrate.
NOTE: A cross-grating may be used if collection is to be done on a gold grid. - In the Beam_Tilt_Image settings, ensure that the Presets Order includes only fcn with four tilt directions at an angle of 0.005 radians.
- Click Simulate Target to create a Zemlin tableau. Click Tableau on the left side of the main window to view the tableau.
- Correct for coma by comparing the left and right Fourier transforms with each other and the top and bottom Fourier transforms with each other. If the pairs of images are not identical, first click the cursor icon to the right of the image adjustments, then click slightly off of center in the Tableau image in the direction of the difference and wait for a new set of Fourier transforms to collect. Repeat until the Fourier transforms are identical.
NOTE: Each Tableau click takes several seconds to complete, and no additional clicks should be made during this time.
- Navigate to an area of the grid that produces clear Thon rings, such as carbon substrate.
- Gain references
NOTE: Skip this section if the camera has automatic hardware references.- In the Navigation node, send a low magnification preset, such as gr, and navigate to an area where there is no obstruction to the beam path.
- Confirm that the stage position is at a location not obstructed by the beam path by taking a medium magnification image using the sq or hln preset.
- Send the high magnification enn preset to the microscope.
- In the Correction node settings, select the proper Instrument information and set up the Camera Configuration to match the collection settings.
- Collect a dark reference image by closing the column valves on the microscope, then in the Correction node, select Dark and Both Channels from the dropdown menus at the top and click the Acquire camera button to the right.
- Once complete, select Bright from the dropdown menu and click Acquire. Leginon will open the column valves automatically.
- Check that the gain was properly collected by selecting Corrected from the dropdown menu, clicking Acquire, and observing the resulting image.
- Ice thickness reference image
- If the microscope has an energy filter, then in the IceT node settings, check Collect ice thickness image, enter 395 for the Mean free path, and fill in the rest of the values for the setup.
- If the microscope does not have an energy filter, then in the Navigation node, send the enn preset to the microscope and click Acquire. Make a note of the Mean pixel value on the left side. In the IceT node settings, check Calculate ice thickness from aperture limited scattering, enter 1055 for the ALS coefficient and the measured mean pixel value.
NOTE: The values 395 and 1055 were determined for the TFS Krios and Glacios, respectively, as described previously16, and may need to be re-calibrated for different microscope configurations.
- Image dose calibration
- In the Preset_Manager, select the enn preset and click the camera button (Acquire dose image for the selected preset). Check the measured dose on the bottom. If it is close to the expected value (typically between 30 and 70), click YES.
- Preset alignments
- In the Preset_Manager, check all of the high magnification presets (enn, fcn, and fan) to make sure the image shift and beam shift are 0, 0.
- On the microscope computer, navigate to a carbon area.
- On the Leginon computer in the Navigation node, acquire an image with the gr preset.
- Find an object of interest and go to that location using the cursor tool.
- Acquire an image with the hln preset and relocate a unique part of that object of interest to the center using the cursor tool.
- Acquire an image with the enn preset and relocate it to the same unique part of the object of interest using the cursor tool.
- Select image shift from the pulldown menu and acquire an image with the hln preset. Relocate to the same unique part of the object of interest with the cursor tool.
- In the Presets_Manager, select the hln preset, click the settings button, and import the image shift from Navigation by clicking the left green arrow next to the Image shift values.
- Repeat steps 2.9.7 and 2.9.8 for the sq and gr presets.
- Grid atlas
- On the microscope computer, close column valves and retract the objective aperture. Go to the Grid_Targeting node. In settings, change the label of the grid. Choose the desired radius of the atlas (the maximum radius is 0.0009 m). Click OK. Then click the Calculate atlas calculator button at the top and click the green Play button ('Submit Targets').
- In the Square_Targeting node, the grid images will be collected and stitched together to form an atlas. Zoom in and out using the dropdown menu and adjust contrast and brightness. Use the scroll bars to move throughout the grid.
- Once the atlas is collected, insert the objective aperture if desired.
- If the microscope has an energy filter, select a reference target in the center of a broken square, press the Play button, and proceed with ZLP alignment in the following sub-section. Otherwise, skip the ZLP alignment step.
- ZLP alignment
- In the Align_ZLP node settings, select stage position to move the reference target and select preset manager as the mover. Deselect bypass conditioner, then press OK.
NOTE: ZLP alignment should now be configured so that the microscope periodically moves to the reference target and executes the camera's ZLP alignment routine. ZLP re-alignment times of 30 min and 60 min are typically safe for Gatan BioQuantum and TFS Selectris X energy filters, respectively. These values vary depending on energy filter conditions, including consistent humidity, consistent temperature, electro-magnetic field isolation, and vibration isolation.
- In the Align_ZLP node settings, select stage position to move the reference target and select preset manager as the mover. Deselect bypass conditioner, then press OK.
- Hole template targeting setup
- In the Square_Targeting node, select multiple acquisition targets, then press Play.
- In the Hole_Targeting node settings, make sure Allow user verification of selected targets and Queue up targets are checked. Also, check Skip automated hole finder for now. Click Apply, then OK.
- In the main window, use Ctrl-Shift-right click to remove all targets. Select the acquisition cursor and place the targets. Select the focus cursor and place a focus target between the acquisition targets. Click Play.
- For the next Hole_Targeting image, uncheck the Skip automated hole finder in settings, then click Apply and OK. Remove the auto targets with Ctrl-Shift-right click.
- Select the ruler tool and measure the diameter across a hole. In Template settings, change the Final Template Diameter to the measured hole diameter. Do not change the Original Template Diameter. Click Test. If bright peaks are not in the center of each hole, increase the Final Template Diameter. When finished, click OK.
- In the Threshold settings, choose a value for A that segments the holes individually when Test is clicked. Click OK when satisfied.
- In the Blobs settings, input the values and click Test. The Max blobs value is 1 so only one blob shows up. Click OK.
- In Lattice settings, use the ruler tool to measure the distance between two holes (center to center). Input the value in Spacing and click Test. The one blob will turn into a lattice point. Click OK.
- Go to acquisition settings, and optimize the acquisition targets using ice thickness thresholds and the Test targeting button. Get ice thickness information by hovering over the lattice points.
- If the acquisition targets aren't satisfactory, use the ruler tool to measure the distance and angle from the lattice point to the desired location for an acquisition target. Delete the previous Acquisition Target Template points. Click on Auto Fill, put 4 for the number of targets, and change the radius and angle to the measured values. Click OK. Check Apply ice thickness threshold on template-convolved acquisition targets.
- Once satisfied with the lattice points and the ice thickness thresholds, click the Submit Targets button.
- Repeat any of the above steps as needed for each square that was selected. Submit the whole queue with the Submit Queued Targets button once all the square targets are submitted.
- Leginon will begin focusing and imaging each set of targets. In the Z_Focus node, make sure that the eucentric height is found properly.
- Exposure template targeting setup
- In the Exposure targeting node, hole magnification images will appear. Use Ctrl-Shift-right click to remove the auto targets.
- Measure the diameter of a hole with the ruler tool. In the Template settings, input the diameter into Final Template Diameter and click Test. A peak should now be at the center of each hole. Adjust the Diameter values if necessary.
- In the Threshold settings, adjust the A value until the binarized test image shows white areas only where holes are located.
- In the Blobs settings, click Test. One blob per segmented hole should appear. Increase the Border to remove the blobs from the edges of the image, if desired.
- In the Lattice settings, click Test. Adjust parameters until all blobs have turned into lattice points. Click OK.
- Click on the ruler tool and measure the distance between two lattice points. In the Lattice settings, change Spacing to that distance.
- Hover over each lattice point to see the mean intensity, mean thickness, standard deviation intensity, and standard deviation thickness. Make a note of the intensities for each lattice point and use them to set desired ice thickness parameters in the acquisition settings.
- Measure the distance and angle from one lattice point to the center of 4 holes with the ruler tool. In the acquisition settings, delete the current focus targets. Click AutoFill, and change the radius and angle to the measured values. Click Test targeting, click OK, and click Submit Targets.
NOTE: Leginon will find eucentric focus (Focus node) and collect exposures, which will appear in the Exposure node. - Once all targets are imaged, go to the Exposure_Targeting node to see the next hole image. In the settings, uncheck Allow for user verification of selected targets. Also, uncheck Queue up targets and Skip automated hole finder. Click OK and click Submit Targets.
NOTE: Leginon will automatically collect images based on the settings configured above. See the images and metadata in Appion.
- Changes can be made during automated collection. For example, change the collection defocus range at any time by editing the enn preset in the Preset_Manager.
- If collection needs to be stopped, end the queue by clicking the Abort and Abort Queue buttons in the Hole and Exposure nodes.
- Once the collection is finished, go to Application and click Kill, then go to File and click Exit.
2. Smart Leginon Autoscreen usage
- Create a Smart Leginon Template session
- Follow the instructions in Section 1 to start Leginon.
- Go to Application and click Run. In the Run Application window, select the Ptolemy Application (select Show All if necessary). Set main to the Leginon computer and scope and camera to that respective computer.
- In the Preset_Manager, import presets as described in step 1.2.3.
- Configure node settings.
- In the Square_Targeting node settings, make sure Sort targets by shortest path and Enable auto targeting are checked (Supplementary Figure 1A).
- In the Square node settings, make sure Wait for node to process the image is checked. Add the Square preset to the list on the right from the dropdown menu if it is not already there. In Advanced settings, check set these apertures while imaging and ensure that the values for the two apertures are correct (Supplementary Figure 1B).
- In the Hole_Targeting node settings, check Allow for user verification of selected targets. Uncheck Queue up targets and Skip automated hole finder (Supplementary Figure 2A).
- In the Hole node setting, check Wait for a node to process the image and the Hole preset is in the list on the right. In Advanced settings, check set these apertures while imaging and ensure that the values for the two apertures are correct (Supplementary Figure 2B).
- In the Exposure_Targeting node settings, check Allow for user verification of selected targets. Uncheck Queue up targets and Skip automated hole finder (Supplementary Figure 3A).
- In the Exposure node settings, make sure Wait for a node to process the image is unchecked, the Exposure preset is listed on the right, and in Advance settings, check set these apertures while imaging and ensure that the values for the two apertures are correct (Supplementary Figure 3B).
- In the Focus node settings, make sure Wait for a node to process the image is unchecked, the Auto-focusing preset is listed on the right, and the Desired autofocus accuracy is set to 4 x 10⁻⁶ m (Supplementary Figure 4A).
- In the Focus node Focus Sequence (next to the settings button), enable only two Beam Tilt Auto-focusing steps (Supplementary Figure 4B,C).
- In the Z_Focus node settings, make sure Wait for a node to process the image is unchecked, the Hole preset is listed on the right, and Desired autofocus accuracy is 5 x 10⁻⁵ m (Supplementary Figure 5A).
- In the Z_Focus node Focus Sequence, enable only two low-magnification Stage Tilt steps (Supplementary Figure 5B,C).
- Determine the grid's z-height as described in step 1.2.4.
- Collect an atlas as described in step 1.2.10.
- Set up square finder parameters.
- Once the atlas has been collected, Ptolemy will locate squares in the Square_Targeting node. Each square will show a blue circle, called a blob. When hovering over each blob, Leginon will report their size as calculated by Ptolemy. Make note of the largest and smallest blobs.
- In the Thresholded settings, change the minimum and maximum Filter Range to include desirable squares and exclude undesirable squares.
- Click the Find Squares button in the top toolbar. Adjust the Filter Range until Find Squares targets well.
- In the acquisition settings, choose values for the Max. number of targets and Number of target group to sample. These parameters will define how many squares and groups of squares are targeted.
- Once satisfied with the parameters, click the Play button. An example atlas after setup is shown in Supplementary Figure 6.
- Set up hole finder parameters.
- In the Hole_Targeting node, use the ruler tool to measure the diameter of a hole.
- In the Template settings, input the diameter into Final Template Diameter and click Test. Adjust the diameter until all holes have bright white peaks in the center.
- In the Threshold settings, click Test. Adjust the A value until the binarized image shows white areas only where holes are located.
- In the Blobs settings, choose to exclude Border targets by using the ruler to determine a minimum distance from the edge and inputting that value. Blobs may be filtered by their size, roundness, and number desired. Hover over blobs to show their values. Click Test to inspect current values.
- In the Lattice settings, input the radius of the holes and spacing between holes (use the measuring tool),then click the 42 button to measure the Reference Intensity value of a vacuum area (empty hole or broken support film).
- In the acquisition settings, check Use subset of the acquisition targets and set the Sample Maximal value to a small number, such as 2. Set a wide range of ice thickness means and standard deviations (measure these values by hovering over targets). Click Test targeting to randomize the target selection given the values above.
- Click the Play button when satisfied with all settings. Leginon will perform stage Z_Focus and collect the first target. An example image after setup is shown in Supplementary Figure 7.
- Set up exposure targeting parameters.
- In the Hole settings, set the Shell Script to the hl_finding.sh script path in the Ptolemy installation. Set the minimum score to accept to be ≤0. Input the radius of the holes (use the measuring tool), then click the 42 button to measure the Reference Intensity value of a vacuum area (empty hole or broken support film). Click Test to find the lattice of holes.
- In acquisition settings, check Use subset of the acquisition targets and set the Sample Maximal value to a small number, such as 4, to collect on a subset of holes for screening. Set a wide range of ice thickness means and standard deviations (measure these values by hovering over targets).
- Click the Play button when satisfied with all settings. Leginon will perform eucentric Focus and collect high-magnification images, which can be seen in the Exposure node. An example image after setup is shown in Supplementary Figure 8.
- Check the next Exposure_Targeting image to see if the settings above are still sufficient. Once satisfied, uncheck Allow for user verification of selected targets in the Exposure Targeting and Hole Targeting settings.
NOTE: Screening should now be running unattended for the current grid. This session will be used as the template session for all grids.
- Once the grid is done screening, click File > Exit to close Leginon.
- Set up Smart Leginon Autoscreen
- In a terminal window, execute Smart Leginon's autoscreen.py.
- Select gui, input a comma-separated list of grid slots to screen, input full for the workflow, input the template session name to base new sessions on (this can be found in Appion imageviewer), and input the template session's z-height value (Supplementary Figure 9).
- A gui will open to allow one to input the session name for each grid and select their respective project associations (Supplementary Figure 10).
NOTE: Smart Leginon Autoscreen will now use the template session settings to automatically screen each grid and switch between grids unattended. - Follow along during the collection in Leginon, Appion, and the microscope computer, or leave the microscope completely unattended.
NOTE: Once all grids are screened, Smart Leginon will close the column valves on the microscope.
Results
Following the protocol, cryoEM screening sessions may be run automatically and successfully for the majority (80%-90%) of holey grids and conditions. Several examples and experiments have been presented previously8,9 to demonstrate the expected outcomes of successful Smart Leginon Autoscreen sessions. A successful Autoscreen session begins with ~10 min of setup and commonly results in a full cassette of 12 grids screened automatically after about 6 h (30 min per grid) where 3-5 squares of different sizes and 3-5 holes per square are imaged at high magnification, allowing the user to quickly determine the characteristics of the sample on each grid and rapidly iterate through sample/grid conditions (Figure 3). Occasionally, sessions are unsuccessful, commonly due to Autoscreen targeting broken squares, not interpreting large ice thickness gradients across the grid or across squares properly, or failing to identify holes properly on carbon grids. Additionally, potential memory leaks may cause Leginon to crash due to excessive memory usage, which may be solved by freeing up RAM, or rebooting the computer, or ameliorated by adding more RAM to the computer.

Figure 1: Smart Leginon Autoscreen workflow. A high-level overview of the Smart Leginon Autoscreen workflow. First, a template session is created by selecting parameters for a representative grid in the batch of grids to be screened. Setting up Leginon and creating a template session takes less than 45 min. Second, Autoscreen is set up to use the template session parameters to screen all of the grids in the cassette. Setting up Autoscreen takes less than 10 min. Finally, Autoscreen ends the screening session. Please click here to view a larger version of this figure.
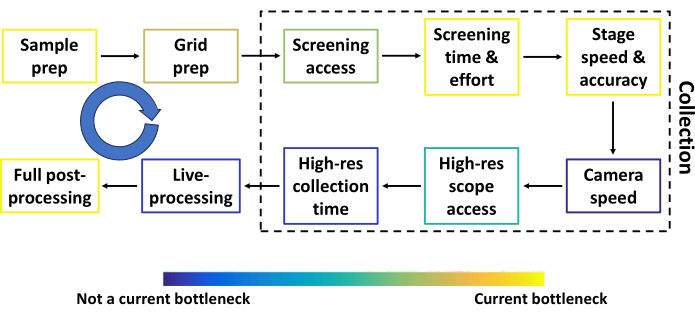
Figure 2: Conventional single particle cryoEM pipeline prior to automated screening. The most common steps in the conventional single particle cryoEM pipeline prior to automated screening, together with components that can be improved. Each step is colored to approximate how much of a bottleneck the step is relative to others. The blue circular arrow represents several feedback loops between most steps. The throughput at several steps depends heavily on the sample, funding, and the researcher's location. Please click here to view a larger version of this figure.

Figure 3: Representative Smart Leginon Autoscreen results. Representative multi-scale images following the Smart Leginon Autoscreen protocol collected on a TFS Krios cryoTEM with a BioQuantum energy filter and K3 camera. (A) A composite 'atlas' image showing an overview of a cryoEM grid. (B-F) Multi-scale images from indicated locations in the grid atlas. Low magnification images in the first row, medium magnification images in the second row, and high magnification images in the third row were each selected automatically to obtain information about the sample from thin to thick ice squares. Ice thickness as estimated by Leginon is shown on the bottom. Scale bars are 500 µm in (A) and 10 µm for the first row, 5 µm for the second row, and 100 nm for the third row for (B-F). This figure has been modified with permission from Cheng et al.8. Please click here to view a larger version of this figure.
| gr: Grid | sq: Square | hln: Hole | fan: Auto- focus | fcn: Central focus | enn: Exposure | |
| Magnification | 210 | 2600 | 6700 | 120000 | 120000 | 120000 |
| Defocus | -0.0002 | -0.00015 | -0.00015 | -2 x 10-06 | -7 x 10-07 | -2.5 x 10-06 |
| Spot size | 5 | 5 | 4 | 2 | 2 | 2 |
| Intensity | 1.1 | 0.83 | 0.65 | 0.44 | 0.44 | 0.45 |
| Dimension | 1024 x 1024 | 1024 x 1024 | 1024 x 1024 | 1024 x 1024 | 1024 x 1024 | 4096 x 4096 |
| Offset | 0, 0 | 0, 0 | 0, 0 | 0, 0 | 512, 512 | 0, 0 |
| Binning | 4 x 4 | 4 x 4 | 4 x 4 | 4 x 4 | 2 x 2 | 1 x 1 |
| Exposure time (ms) | 200 | 500 | 500 | 500 | 500 | 1000 |
| Pre-Exposure (s) | 0 | 0 | 0 | 0 | 0 | 0 |
| Dose (e/Å2) | -- | -- | -- | 36.5 | 36.5 | 64.7 |
| Save raw frames | No | No | No | No | No | Yes |
Table 1: Preset parameters for cryoEM grid screening at Simons Electron Microscopy Center (SEMC) using a Glacios cryoTEM with a Falcon 3EC camera. Parameters for each preset commonly used on a Glacios cryoTEM with a Falcon 3EC camera at SEMC are shown. Different microscopes will have varying magnifications available and different experiments will use varying parameters such as defocus and exposure time.
| gr: Grid | sq: Square | hln: Hole | fan: Auto- focus | fcn: Central focus | enn: Exposure | |
| Magnification | 64 | 1700 | 2850 | 75000 | 75000 | 75000 |
| Defocus | 0 | -5 x 10-05 | -5 x 10-05 | -1 x 10-06 | -7 x 10-07 | -2 x 10-06 |
| Spot size | 6 | 9 | 9 | 6 | 6 | 7 |
| Intensity | 0.001 | 1.65 x 10-05 | 1.5 x 10-05 | 4.3 x 10-07 | 4.3 x 10-07 | 5.5 x 10-07 |
| Energy filter width | -- | -- | -- | 20 | 20 | 20 |
| Dimension | 1024 x 1024 | 1024 x 1024 | 1024 x 1024 | 1024 x 1024 | 2048 x 2048 | 4096 x 4096 |
| Offset | 0, 0 | 0, 0 | 0, 0 | 0, 0 | 0, 0 | 0, 0 |
| Binning | 4 x 4 | 4 x 4 | 4 x 4 | 4 x 4 | 2 x 2 | 1 x 1 |
| Exposure time (ms) | 500 | 2000 | 1000 | 500 | 300 | 8700 |
| Pre-Exposure (s) | 0 | 0 | 0 | 0 | 0 | 0 |
| Dose (e/Å2) | -- | -- | -- | -- | -- | 47.4 |
| Save raw frames | No | No | No | No | No | Yes |
Table 2: Preset parameters for cryoEM grid screening at SEMC using a Krios cryoTEM with a Selectris X and Falcon 4i camera. Parameters for each preset commonly used on a Krios with a Selectris X energy filter and Falcon 4i camera at SEMC are shown. Different microscopes will have varying magnifications available and different experiments will use varying parameters such as defocus and exposure time.
| gr: Grid | sq: Square | hln: Hole | fan: Auto- focus | fcn: Central focus | enn: Exposure | |
| Magnification | 1550 | 940 | 2250 | 81000 | 81000 | 81000 |
| Defocus | 0 | -5 x 10-05 | -5 x 10-05 | -1 x 10-06 | -7 x 10-07 | -2 x 10-06 |
| Spot size | 4 | 8 | 7 | 6 | 6 | 6 |
| Intensity | 0.0015 | 0.00017 | 7.3 x 10-05 | 1.3 x 10-06 | 1.3 x 10-06 | 9.2 x 10-07 |
| Energy filter width | -- | -- | 50 | 20 | 20 | 20 |
| Dimension | 1024 x 1024 | 1440 x 1024 | 1440 x 1024 | 1440 x 1024 | 1008 x 1008 | 5760 x 4092 |
| Offset | 0, 0 | 0, 0 | 0, 0 | 0, 0 | 936, 519 | 0, 0 |
| Binning | 4 x 4 | 8 x 8 | 8 x 8 | 8 x 8 | 4 x 4 | 2 x 2 |
| Exposure time (ms) | 250 | 600 | 600 | 500 | 500 | 2100 |
| Pre-Exposure (s) | 0 | 0 | 0 | 0 | 0 | 0 |
| Dose (e/Å2) | -- | -- | -- | -- | -- | 51 |
| Save raw frames | No | No | No | No | No | Yes |
Table 3: Preset parameters for cryoEM grid screening at SEMC using a Krios cryoTEM with a BioQuantum and K3 camera. Parameters for each preset commonly used on a Krios with a BioQuantum energy filter and K3 camera at SEMC are shown. Different microscopes will have varying magnifications available and different experiments will use varying parameters such as defocus and exposure time.
Supplementary Figure 1: Square Targeting settings and Square settings for Smart Leginon. (A) Square Targeting settings. (B) Square settings. Please click here to download this File.
Supplementary Figure 2: Hole Targeting settings and Hole settings for Smart Leginon. (A) Hole Targeting settings. (B) Hole settings. Please click here to download this File.
Supplementary Figure 3: Exposure Targeting settings and Exposure settings for Smart Leginon. (A) Exposure Targeting settings. (B) Exposure settings. Please click here to download this File.
Supplementary Figure 4: Focus settings and Focus Sequence settings for Smart Leginon. (A) Focus settings. (B) Focus Sequence settings (Defocus1). (C) Focus Sequence settings (Defocus2). Please click here to download this File.
Supplementary Figure 5: Z_Focus settings and Z_Focus Sequence settings for Smart Leginon. (A) Z_Focus settings. (B) Z_Focus Sequence settings (Stage_Tilt_Rough). (C) Z_Focus Sequence settings (Stage_Tilt_Fine). Please click here to download this File.
Supplementary Figure 6: An example atlas after setting up Smart Leginon Square_Targeting parameters. Blue circles are blobs, green plus signs are acquisition locations, and the brown 'x' is the current stage location. Please click here to download this File.
Supplementary Figure 7: An example atlas after setting up Smart Leginon Hole_Targeting parameters. Purple plus signs are lattice locations, green plus signs with boxes are acquisition locations, and the blue plus sign is the focus location. Please click here to download this File.
Supplementary Figure 8: An example atlas after setting up Smart Leginon Exposure_Targeting parameters. Blue circles are blobs, green plus signs are acquisition locations, and the blue plus sign is the focus location. Please click here to download this File.
Supplementary Figure 9: Smart Leginon Autoscreen terminal setup. Please click here to download this File.
Supplementary Figure 10: Smart Leginon Autoscreen gui setup. Please click here to download this File.
Discussion
In this protocol, we describe the pipeline for Smart Leginon Autoscreen, and additionally basic Leginon usage for those new to the collection software. Single particle cryoEM is poised to become the most productive three-dimensional (3D) protein structure resolving technique by the end of 202417. The single particle cryoEM pipeline consists of several steps that are constantly being optimized to increase data quality and throughput. Figure 2 shows the most common steps (sample preparation, grid preparation, screening time and effort, high-resolution collection time, live processing, and full post-processing) along with other components of the pipeline that can be improved (screening microscope access, stage speed and accuracy, camera speed, and high-resolution microscope access). Results from most steps become feedback loops into previous steps (blue arrows in Figure 2), making the entire pipeline highly interdependent. Each step in Figure 2 is colored to approximate how much of a bottleneck the step is relative to others. Smart Leginon Autoscreen significantly reduces operator time and effort for screening 12 grids from 6 h to less than 10 min, thus relieving that bottleneck and allowing for more rapid feedback to sample/grid preparation (Figure 3).
There are several critical steps in the Protocol, depicted in Figure 1. It is critical that the grid used for creating the template session is representative of the remaining grids to be screened. Importantly, Leginon remembers all settings in the entire setup process for creating a template session (blue steps in Figure 1), which allows for recurrent template sessions to be set up more quickly each time. When creating a template session, the most critical step is setting up targeting at all magnifications so that the parameters and thresholds reflect the expected variation across the grids to be screened. The various 'Test' buttons allow for efficiency in this setup process. During an Autoscreen session, it is critical to monitor the first few grids in Appion to quickly detect any issues and fix them inside of Leginon as soon as possible.
The typical workflow at SEMC is to feed Autoscreen data into CryoSPARC Live18 and use this additional information to inform the feedback loops into sample/grid preparation. During intensive researcher-operator cryoEM optimization days, information about the sample and grid conditions is fed back into sample and grid preparation while Autoscreen is still screening grids. This allows for several dozen grids to be frozen and screened per week8.
Smart Leginon Autoscreen works for the majority (80%-90%) of holey grids and conditions observed at SEMC. The remaining 10%-20% of grids include those that sometimes do not work well - grids with minimal contrast difference between holes and substrate; grids with smaller holes and spacing (e.g., 0.6/0.8) - and grids where targeting across multiple grids is often impractical - Spotiton/Chameleon19,20 grids that consist of stripes of sample across the grid; lacey grids. Note that the tilted grid collection with Autoscreen is in development but is not yet available. It may be possible to modify the protocol to work with Spotiton/Chameleon grids by first imaging areas of the stripe manually to determine narrow parameter thresholds, then attempting to group larger and smaller squares together, respectively, in step 2.1.7.4, and then selecting targets from the group with ice. The goal of this modification is to have Smart Leginon separate empty and non-empty squares into two groups. If parameters are found, they may not extend well to the remaining grids to be screened. It may also be possible to modify the protocol to work with lacey grids by removing the hl_finding.sh script in step 2.1.9.1 and configuring the parameters to target lighter/darker areas as desired. The success rate of this modification may vary from grid to grid based on ice thicknesses and grid material.
Troubleshooting during an Autoscreen session is possible and sometimes appropriate. Changes to preset (e.g., defocus) and targeting parameters (e.g., Hole Targeting thresholds) can be made during automated collection. While an Autoscreen session is collecting, a grid session cannot be canceled because it will terminate autoscreen.py. However, the Abort buttons in the Targeting nodes may be used to skip any part of a grid or an entire grid. Occasionally, autoscreen.py may use too much memory and freeze, offering two options: 'force quit' or 'wait'. If 'force quit' is selected, the entire script will terminate, requiring the user to rerun the script to be applied to the remaining grids for screening. If 'wait' is selected, the script will continue, and settings may be altered to prevent future freezing, e.g., turning off the image display in the Exposure node, decreasing pixel size in the atlas, or running a memory-clear script. If the program freezes without offering the two options, memory errors may not resolve on their own, causing a pause in acquisition. The 'force quit' option may be useful in this instance.
Smart Leginon Autoscreen is used regularly at SEMC. As bottlenecks in the single-particle cryoEM pipeline continue to be reduced, cryoEM adoption will continue to increase to help answer biological questions. This Protocol is a step in the direction of optimizing the entire pipeline by providing a clear path for significantly reducing feedback loops.
Disclosures
The authors declare that they have no competing financial interests.
Acknowledgements
Some of this work was performed at the Simons Electron Microscopy Center at the New York Structural Biology Center, with support from the Simons Foundation (SF349247), NIH (U24 GM129539), and NY State Assembly.
Materials
| Name | Company | Catalog Number | Comments |
|---|---|---|---|
| Glacios cryoTEM | Thermo Fisher Scientific | GLACIOSTEM | FEG, 200 keV, Falcon 3EC camera |
| Krios cryoTEM | Thermo Fisher Scientific | KRIOSG4TEM | XFEG, 300 keV, Gatan BioQuantum energy filter, Gatan K3 camera |
| Leginon | Simons Electron Microscopy Center | http://leginon.org | |
| Ptolemy | Simons Machine Learning Center | https://github.com/SMLC-NYSBC/ptolemy |
References
- Noble, A. J., et al. Routine single particle CryoEM sample and grid characterization by tomography. eLife. 7, e34257(2018).
- Weissenberger, G., Henderikx, R. J. M., Peters, P. J. Understanding the invisible hands of sample preparation for cryo-EM. Nature Methods. 18 (5), 463-471 (2021).
- Carragher, B., et al. Current outcomes when optimizing 'standard' sample preparation for single-particle cryo-EM. Journal of Microscopy. 276 (1), 39-45 (2019).
- Kampjut, D., Steiner, J., Sazanov, L. A. Cryo-EM grid optimization for membrane proteins. iScience. 24 (3), 102139(2021).
- Suloway, C., et al. Automated molecular microscopy: The new Leginon system. Journal of Structural Biology. 151 (1), 41-60 (2005).
- Mastronarde, D. N. Automated electron microscope tomography using robust prediction of specimen movements. Journal of Structural Biology. 152 (1), 36-51 (2005).
- Koh, A., et al. Routine collection of high-resolution cryo-EM datasets using 200 KV transmission electron microscope. Journal of Visualized Experiments. 181, 63519(2022).
- Cheng, A., et al. Fully automated multi-grid cryoEM screening using Smart Leginon. IUCrJ. 10 (1), 77-89 (2023).
- Kim, P. T., Noble, A. J., Cheng, A., Bepler, T. Learning to automate cryo-electron microscopy data collection with Ptolemy. IUCrJ. 10 (1), 90-102 (2023).
- Bepler, T., et al. Smart data collection for CryoEM. Journal of Structural Biology. 214 (4), 107913(2022).
- Bouvette, J., Huang, Q., Riccio, A. A., Copeland, W. C., Bartesaghi, A., Borgnia, M. J. Automated systematic evaluation of cryo-EM specimens with SmartScope. eLife. 11, e80047(2022).
- Deng, Y., Grollios, F., Kohr, H., van Knippenberg, B., Janus, M., Caglar, F. Smart EPU: SPA Getting Intelligent. Microscopy and Microanalysis. 27 (S1), 454-455 (2021).
- Fan, Q., et al. CryoRL: Reinforcement learning enables efficient cryo-EM data collection. arXiv. , (2022).
- Li, Y., et al. Optimized path planning surpasses human efficiency in cryo-EM imaging. bioRxiv. Biophysics. , (2022).
- Lander, G. C., et al. Appion: An integrated, database-driven pipeline to facilitate EM image processing. Journal of Structural Biology. 166 (1), 95-102 (2009).
- Rice, W. J., et al. Routine determination of ice thickness for cryo-EM grids. Journal of Structural Biology. 204 (1), 38-44 (2018).
- Russo, C. J. The potential for seeing molecules in cells, CZ Imaging Institute's Hardware Frontiers for CryoET Workshop. CZ Imaging Institute's Hardware Frontiers for CryoET Workshop. , https://chanzuckerberg.com/science/meetings/hardware-frontiers-cryoet-workshop/ (2023).
- Punjani, A., Rubinstein, J. L., Fleet, D. J., Brubaker, M. A. cryoSPARC: algorithms for rapid unsupervised cryo-EM structure determination. Nature Methods. 14 (3), 290-296 (2017).
- Budell, W. C., Allegri, L., Dandey, V., Potter, C. S., Carragher, B. Cryo-electron microscopic grid preparation for time-resolved studies using a novel robotic system, Spotiton. Journal of Visualized Experiments. 168, 62271(2021).
- Darrow, M. C., Booth, T., Moore, J. P., Doering, K., Thaw, P., King, R. S. Enabling a paradigm shift in CryoEM sample preparation with chameleon. Microscopy and Microanalysis. 27 (S1), 524-525 (2021).
Reprints and Permissions
