Here, we describe a newly developed multiplex fluorescent immunoassay that uses a dual-reporter flow cytometric system to concurrently detect two unique spike protein epitopes on intact severe acute respiratory syndrome coronavirus 2 (SARS-CoV-2) viral particles that had been captured by angiotensin-converting enzyme-2-coupled magnetic microspheres.
Method Article
Profiling of Surface Protein Epitopes on Viral Particles by Multiplex Dual-Reporter Strategy
In This Article
Summary
Abstract
Membrane proteins on enveloped viruses play an important role in many biological functions involving virus attachment to target cell receptors, fusion of viral particles to host cells, host-virus interactions, and disease pathogenesis. Furthermore, viral membrane proteins on virus particles and presented on host cell surfaces have proven to be excellent targets for antivirals and vaccines. Here, we describe a protocol to investigate surface proteins on intact severe acute respiratory syndrome coronavirus 2 (SARS-CoV-2) particles using the dual-reporter flow cytometric system. The assay exploits multiplex technology to obtain a triple detection of viral particles by three independent affinity reactions. Magnetic beads conjugated to recombinant human angiotensin-converting enzyme-2 (ACE2) were used to capture viral particles from the supernatant of cells infected with SARS-CoV-2. Then, two detection reagents labeled with R-phycoerythrin (PE) or Brilliant Violet 421 (BV421) were applied simultaneously. As a proof-of-concept, antibody fragments targeting different epitopes of the SARS-CoV-2 surface protein Spike (S1) were used. The detection of viral particles by three independent affinity reactions provides strong specificity and confirms the capture of intact virus particles. Dose-dependency curves of SARS-CoV-2 infected cell supernatant were generated with replicate coefficient variances (mean/SD) ˂14%. Good assay performance in both channels confirmed that two virus surface target protein epitopes are detectable in parallel. The protocol described here could be applied for (i) high-multiplex, high-throughput profiling of surface proteins expressed on enveloped viruses; ii) detection of active intact viral particles; and (iii) assessment of specificity and affinity of antibodies and antiviral drugs for surface epitopes of viral antigens.The application can be potentially extended to any type of extracellular vesicles and bioparticles, exposing surface antigens in body fluids or other liquid matrices.
Introduction
The most common pathogenic viruses, such as influenza, HIV, human cytomegalovirus, and SARS-CoV strains, are enveloped viruses. Cell infection by enveloped viruses requires the fusion of viral and host cell membranes, resulting in the release of the viral genome into the cytoplasm. Viral RNA will then replicate before being packed into a new viral particle1,2. During these processes, not only viral proteins but also host membrane proteins may be incorporated into the envelope, becoming an integral part of the new viral particle. Host cell membrane proteins incorporated into the virus envelope may facilitate virus entry into a new host cell, exploiting the mechanisms of cell-cell interactions, homing, and immune system escape3,4.
Despite the importance of investigating virus-associated proteins, most of the currently available techniques for virus analysis5 do not support high-throughput and high-multiplex characterization of virus surface antigen. Neither are they capable of detecting individual viral particles or of discriminating between infectious intact virus particles, non-infectious RNA, viral proteins, and virus subpopulations expressing different antigens. Recently, flow cytometry has been modified and adapted into a novel method for the analysis of viral particles, namely, flow virometry. Flow virometry allows the investigation of single viral particles and their surface antigens. However, limitations including low throughput, low multiplex capability, complicated experimental setup and data analysis, and limited detectability of small-sized viral particles remain6,7.
Microsphere-based multiplexed quantification of proteins and nucleic acid is a well-established technology with numerous applications ranging from protein quantification in body fluids, protein-protein interaction studies, and diagnosis of viral infections8,9,10,11,12,13. A recently introduced flow analysis instrument features a dual-reporter channel, allowing the measurement of two fluorescent reporter molecules in the same reaction well. This new capability has shown to be particularly useful for the parallel profiling of different immunoglobulin isotypes14. Here, it is described how the dual reporter system can be used to detect intact viral particles, targeting multiple surface antigens in parallel.
As a proof of concept, this report details the development of a triple-detection system for SARS-CoV-2 virus particles. SARS-CoV-2 consists of four main proteins, one is the spike protein (S), which consists of two subunits. The first subunit, S1, makes the primary binding to the ACE2 expressed in human cell membranes. The second subunit, S2, facilitates entry into the target cell by a fusion peptide, creating a pore in the target cell membrane that the virion can enter through15. The three remaining building blocks of SARS-CoV-2 are the nucleocapsid (N), the membrane protein (M), and the envelope protein (E). The nucleocapsid is responsible for the packaging of the viral genome by forming ribonucleoprotein structures with RNA, while the membrane and envelope proteins play central roles in the virus assembly.
The assay described here targets three independent epitopes of the S1 subunit expressed on the envelope surface of SARS-CoV-2. Serial dilutions of both SARS-CoV-2 infected and uninfected cell supernatants are used. Viral particles are captured via ACE2-conjugated microspheres binding the S1 subunit on the virus. Surface virus S protein is then detected in parallel with a commercialy-available tagged immunoglobulin single-chain variable fragment (scFv) and a human monoclonal anti-S1 antibody (Hu-anti-S1) together with an in-house developed FLAG-tagged scFv. The Hu-anti-S1 is detected by the first channel (RP1) in the dual-reporter system with orange R-phycoerythrin (PE)-conjugated anti-human IgG-Fc secondary antibody, and the scFv is detected by the second channel (RP2) with a blue Brilliant Violet 421 (BV421)-conjugated secondary anti-FLAG antibody. The virus particle assay is represented in Figure 1.
Protocol
1. Conjugation of neutravidin and control antibodies to magnetic microspheres
NOTE: Fluorescently-dyed magnetic beads (6.5 µm-diameter polystyrene microspheres with embedded magnetite) with different fluorescent labels, listed in the Table of Materials are used to generate the following bead conjugates and controls: (1) Biotinylated recombinant human ACE2 bound to beads coupled with a neutravidin linker; (2) Biotin bound to beads coupled with a neutravidin linker; (3) Goat IgG coupled directly to beads; and (4) Unconjugated beads. The protein to be coupled to beads should be free of sodium azide, bovine serum albumin (BSA), glycine, tris(hydroxy-methyl)aminomethane (Tris), glycerol, or amine-containing additives. Activation Buffer is 0.1 M Sodium phosphate monobasic, anhydrous (NaH2PO4), pH 6. 2-morpholinoethanesulfonic acid (MES; 50 mM) Buffer of pH 5 is used for diluting conjugates. Wash Buffer is PBS-T (1x PBS [phosphate-buffered saline], pH 7.4 + 0.05 % (v/v) Tween-20). Storage Buffer is 2.7 mg/mL Blocking Reagent for ELISA (BRE) + 0.1% antibiotics (here, ProClin 300).
- Remove Sulfo- N-hydroxysulfosuccinimide (NHS) powder from the refrigerator, and 65 mg pre-aliquoted 1-ethyl-3-[3-dimethylaminopropyl]carbodiimide hydrochloride (EDC) from the freezer and allow to come to room temperature (RT; 18-22 °C) for 30 min. Store both NHS and EDC in an envelope containing silica beads during this step to prevent hydrolysis from atmospheric moisture.
- Prepare microspheres for activation and coupling.
NOTE: The fluorescent dyes within microspheres are sensitive to light, and beads should be kept in the dark and at refrigerator temperatures (4-8 °C) when not in active use.- Resuspend 4 different stocks of the color-ID coded microspheres (12.5 x 10⁶/mL) (Table of Materials) by briefly vortexing, sonicating, or rotating (15 min at 15-30 rpm), according to the product information sheet.
- Transfer 40 µL of each bead suspension (5 x 10⁵ microspheres) to assigned wells of a half-well, flat-bottom, 96-well microtiter plate (Table of Materials).
- Wash the magnetic beads.
NOTE: Wash steps may be performed either manually or using an automated plate washer.- Add 80 µL/well Activation Buffer to the beads and immobilize the beads on a magnetic plate separator for 30 s. Aspirate the supernatant from the microspheres while beads are immobilized on the magnetic plate separator.
- Remove the microtiter plate from the magnetic plate separator and resuspend beads in 50 µL of Activation buffer.
- Activate the beads with Sulfo-NHS and EDC.
- Prepare Sulfo-NHS working solution at 50 mg/mL in Activation Buffer in a 1.5 mL microfuge tube. Return stock NHS powder to the refrigerator (4-8 °C), protected from moisture.
- Prepare EDC working solution at 50 mg/mL in Activation Buffer in its 1.5 mL microfuge tube. Dissolve the premade 65-mg aliquots of EDC powder in 1.3 mL of Activation Buffer.
NOTE: Sulfo-NHS and EDC begin hydrolyzing and losing activity upon being dissolved. Avoid interrupting the coupling procedure until NHS and EDC have been added to the beads. Do not save dissolved NHS or EDC solutions for later use. - Prepare Activation Solution for bead activation by volumetrically combining 20% Sulfo-NHS stock solution (50 mg/mL), 20% EDC stock solution (50 mg/mL), and 60% Activation Buffer. Activation Solution of 50 µL is required for each bead activation reaction (using 5 × 10⁵ beads/reaction), plus sufficient extra volume to accommodate pipetting losses.
- Add 50 µL of complete Activation Solution to each well containing washed beads. With the pre-existing 50 µL bead suspension volume in the Activation Buffer, per well, the final concentration of Sulfo-NHS will be 5 mg/mL, and the final concentration of EDC will also be 5 mg/mL.
- Seal the microsphere reaction plate with a disposable adhesive plastic or foil plate sealer and incubate for 20 min on an orbital shaker (650 rpm) at room temperature (18-22 °C) in dark.
- Wash excess Activation Solution from beads.
- Centrifuge the microtiter plate at 233 × g for 1 min.
- Immobilize activated beads on a magnetic plate separator for 30 s. Remove the plate sealer and aspirate the supernatant from magnet-immobilized beads with the microtiter plate still positioned on the magnetic separator.
- Remove the microtiter plate from the magnetic separator and add 100 µL of MES Buffer to each well.
- Repeat steps 1.4.2-1.4.3 one additional time for a total of two washes.
- Couple neutravidin and goat IgG (control) to appropriate bead sets. Prepare sufficient neutravidin and goat IgG working solutions, planning 100 µL/reaction and sufficient extra to accommodate pipetting losses as follows:
NOTE: Neutravidin protein powder is reconstituted with ultrapure water and then diluted to a 1 mg/mL stock solution with PBS before aliquoting for storage/use (neutravidin protein is not directly soluble in PBS but is soluble in water to ~10 mg/mL).- Prepare neutravidin working solution at a concentration of 125 µg/mL in MES Buffer in a 1.5 mL low protein-binding microfuge tube.
- Prepare goat IgG control antibody working solution at a concentration of 17.5 µg/mL in MES Buffer.
- Prepare the microtiter plate containing activated beads. Immobilize beads on a magnetic plate separator for 30 s. With the microtiter plate still positioned on the magnetic separator, aspirate the supernatant from magnet-immobilized beads.
- Add 100 µL of neutravidin working solution (125 µg/mL) to the appropriate wells containing beads (for neutravidin-biotin and neutravidin-ACE2 coupling).
- Add 100 µL of goat IgG working solution (17.5 µg/mL) to the well containing beads assigned as goat IgG-only controls.
- Add 100 µL of MES Buffer to the well assigned as control Unconjugated Beads.
- Seal the microtiter plate and incubate for 2 h on an orbital shaker (650 rpm) at RT (18-22 °C) in the dark. Vortex the plate briefly after 1 h of incubation to ensure beads remain in suspension.
- Wash beads with PBS-T.
- Centrifuge the microtiter plate at 233 × g for 1 min.
- Immobilize coupled beads on a magnetic plate separator for 30 s. With the microtiter plate still positioned on the magnetic separator, aspirate the supernatant from magnet-immobilized beads.
- Remove the microtiter plate from the magnetic separator.
- Add 100 µL of PBS-T to each well containing beads.
- Repeat washing steps 1.6.2-1.6.4 one time for a total of two washes with PBS-T.
- Prepare conjugated beads for storage.
- Immobilize coupled beads on a magnetic plate separator for 30 s. With the microtiter plate still positioned on the magnetic separator, aspirate the supernatant from magnet-immobilized beads. Remove the microtiter plate from the magnetic separator.
- Add 50 µL of Storage Buffer to each microsphere ID to quench the remaining bead activity.
- Incubate the microtiter plate at refrigerator temperatures (4-8 °C) in the dark overnight (16-22 h).
- Transfer Unconjugated and goat-IgG-conjugated beads suspensions (50 µL) to appropriately-labeled 1.5 mL low protein-binding microfuge tubes, combined with two 100-µL Storage Buffer rinses of the wells to ensure maximum bead recovery.
NOTE: Unconjugated and goat IgG-conjugated beads will both number 5 × 10⁵ in a final volume of 250 µL (i.e., 2 × 10³ beads/µL). Store the microfuge tubes at refrigerator temperatures (4-8 °C) until use.
- Bind biotinylated ACE2 and biotin to neutravidin-conjugated beads.
- Prepare the recombinant human biotinylated ACE2 working solution at 18 µg/mL ACE2 in 10 mM PBS. Per reaction, 100 µL will be needed. Prepare the biotin working solution at 2.4 mg/mL biotin in 10 mM PBS. Per reaction, 100 µL will be needed.
- Prepare the microtiter plate containing neutravidin-conjugated microspheres.
- Immobilize the microspheres on a magnetic plate separator for 30 s. With the microtiter plate still positioned on the magnetic separator, remove the plate sealer and aspirate the supernatant from magnet-immobilized microspheres.
- Remove the microtiter plate from the magnetic separator and add 50 µL of 10 mM PBS/well.
- Repeat steps 1.8.2.1-1.8.2.2 one time.
- Add 100 µL of the biotinylated-ACE2 working solution to appropriate wells containing neutravidin-conjugated microspheres. Add 100 µL of the biotin working solution to appropriate wells containing neutravidin-conjugated microspheres.
- Seal the microtiter plate and incubate for 1 h on an orbital shaker (650 rpm) at RT (18-22 °C) in the dark.
- Wash the microspheres as described in steps 1.6.1-1.6.5.
- Prepare and store the ACE2- and biotin-conjugated microspheres as described in steps 1.7.1-1.7.4.
NOTE: Biotinylated ACE2- and biotin-conjugated beads will both number 5 × 10⁵ in a final volume of 250 µL (i.e., 2 × 10³ beads/µL).
2. Conjugation test
- Prepare a Bead Mixture by combining all four types of microspheres created in section 1 (i.e., neutravidin-conjugated biotinylated ACE2, neutravidin-conjugated biotin, goat IgG-conjugated, and Unconjugated).
NOTE: Stock microspheres were stored at 2 × 10³ beads/µL and combined such that the final bead concentration in the working Bead Mixture is 40 beads of each set/µL.- Calculate the volume of the working Bead Mixture necessary for testing (5 µL/reaction), allowing the extra volume to accommodate pipetting losses. Briefly vortex each tube and combine equal calculated volumes of each bead suspension in a new low protein-binding microfuge tube. The bead concentration is now 400 beads of each set/µL.
- Create the working Bead Mixture by diluting the combined bead suspension an additional 10-fold with Storage Buffer (40 of each set/µL working concentration).
NOTE: Make a small amount of working Bead Mixture first to estimate the number of microspheres/µL for each ID.
- Incubate the microspheres with goat anti-ACE2 antibody.
- Pipette 5 µL of working Bead Mixture into 3 wells of a flat-bottom, half-well, 96-well microtiter plate.
- Add 50 µL of goat anti-ACE2 (0.4 µg/mL diluted in PBS-T, Table of Materials) each to the 3 wells containing beads in the microtiter plate. Seal the microtiter plate, vortex, and incubate on an orbital shaker (650 rpm) at RT (18-22 °C) for 1 h in the dark.
- Pulse down the microtiter plate at 233 × g for 1 min and wash the microspheres three times with PBS-T as described in 1.6.2-1.6.4.
- Incubate microspheres with detection antibodies.
- Pipette 5 µL of working Bead Mixture into 6 new wells of the microtiter plate.
- Prepare 1 µg/mL each of the working detection mixtures: anti-goat IgG PE, anti-mouse IgG PE, and anti-rabbit IgG PE in 3 separate 1.5 mL tubes, using PBS-T as diluent.
- Add 50 µL of the detection mixtures to 3 wells each, and the anti-goat IgG is added to the same wells as the anti-ACE2 from step 2.2.
- Seal, vortex, and incubate on an orbital shaker (650 rpm) at RT (18-22 °C) for 30 min.
- Pulse down the plate at 233 × g for 1 min and wash the microspheres three times with PBS-T as described in 1.6.2-1.6.4.
- Add 100 µL of PBS-T and run on the dual-reporter flow analysis instrument with the following settings:
Mode: Dual reporter; Time-out: 45 s; DD-gating: 7500-17500; Minimum microsphere count: 100 microspheres/set (lowest QC cut-off: 35 microspheres/set).
3. Production of SARS-CoV-2 infected cell supernatant
SARS-CoV-2 virus is propagated in host Vero E6 cells (monkey kidney epithelial cell line; ATCC; Table of Materials). Vero E6 cells are cultured in Modified Eagles medium (MEM) at 37°C in a 5% CO2 and 95% relative humidity atmosphere. Each liter of MEM is supplemented with 10 mL of L-glutamine (200 mM), 38 mL of NaHCO3 (7.5%), 5 mL of penicillin/streptomycin solution, and 50 mL of fetal bovine serum (FCS); Table of Materials.
CAUTION: Use appropriate biosafety procedures and equipment when handling SARS-CoV-2.
- Vero E6 cells are grown to confluence in two 150-cm2 tissue culture flasks. Infect one flask with the SARS-CoV-2 virus and use the other sham-infected as a control.
- Mix approximately 100,000 wild-type (WT) SARS-CoV-2 infectious particles with 5 mL of Eagles MEM medium.
- Aspirate the media from one 150-cm2 flask and add 55 mL of complete MEM to generate uninfected control supernatants. Aspirate the media from the other 150-cm2 flask and add the virus mixture to the cells. Incubate the cells for 1 h at 37 °C. Mildly shake the flask every 15 min to distribute the virus.
- Add 50 mL of complete MEM medium to the flask with SARS-CoV-2 added and incubate the cells until cytopathic effects are observed, visually evaluating flasks every 24 h.
NOTE: It should take approximately 3-4 days post infection for cytopathy to occur. Cytopathic effects on the Vero E6 cell monolayer structure (e.g., cell retraction, crenation, rounding, de-adhesion, loss of intracytoplasmic granularity, overt lysis) are assessed qualitatively by observing the cells using an inverted light microscope, per International Standardization Organization guidelines for in vitro cytotoxicity testing16. - Collect the cell supernatant from both flasks and spin for 6 min at 253 × g to sediment cell debris.
- UV-inactivate SARS-CoV-2 virus in cell supernatant
- Pipette 0.5 mL of supernatant per well to 12 wells in a 24-well microtiter plate. UV-irradiate the microtiter plate, without lid, for 30 s under a suitable ultraviolet lamp (Table of Materials).
NOTE: Viral inactivation in cell supernatant should be ascertained by attempting virus propagation in Vero E6 cell cultures.
- Pipette 0.5 mL of supernatant per well to 12 wells in a 24-well microtiter plate. UV-irradiate the microtiter plate, without lid, for 30 s under a suitable ultraviolet lamp (Table of Materials).
- Aliquot the cell supernatant into 1.5 mL tubes and store at -20 °C until further use.
NOTE: The cell supernatant can be stored at -80 °C.
4. Assay: Detection of SARS-CoV-2 viral particles in cell supernatant
- Prepare Assays Buffer by mixing 0.1% casein, 0.5% polyvinyl alcohol, 0.8% polyvinylpyrrolidone, and 1% BSA (all w/v) (pH 7). Prepare the Sample Dilution Buffer by preparing 10% rabbit IgG in Assay Buffer.
- Calculate and prepare the volume of the working Bead Mixture (step 2.1) necessary for testing (5 µL/reaction), allowing excess volume to accommodate pipetting losses.
- Prepare supernatant dilution series. Calculate the supernatant volumes necessary. Assay each dilution point in triplicate wells for each of the five scFvs, resulting in 15 wells per dilution point and sample type. Use 45 µL of diluted supernatants in each well, for a total of 675 µL required; a single 1.5 mL microfuge tube for each of SARS-CoV-2 and control supernatants is sufficient.
- Thaw SARS-CoV-2 supernatants and control supernatants at 4 °C for at least 1 h. Keep the supernatants and their dilutions cold (2-8 °C) until use. Label and arrange eight 1.5-mL microfuge tubes each for SARS-CoV-2 and control supernatants.
NOTE: The highest concentration assayed will be a 1:1 (2-fold) supernatant dilution, from which a series of 1:2 (3-fold) dilutions will be made using Sample Dilution Buffer, with the highest dilution being a 1:1458 dilution. Blanks containing Sample Dilution Buffer only serve as no-supernatant controls. Thus, tested dilutions of each supernatant type (SARS-CoV-2 or control) will be 2, 6, 18, 54, 162, 486 and 1458-fold, with a buffer-only control. - Add Sample Dilution Buffer to the labeled microfuge tubes. The 1:1 (2-fold) dilution tubes require 600 µL of buffer, and the remaining tubes require 800 µL of buffer. Create the highest dilution (1:1; 2-fold) of each supernatant by combining 600 µL of the supernatant with 600 µL of Sample Dilution Buffer in appropriately labeled tubes, followed by briefly vortexing the tube to mix.
- Continue the series by sequentially transferring 400 µL of the 1:1 (2-fold) diluted supernatants to the next dilution tube (i.e., 6-fold dilution), and continue 3-fold dilutions until the lowest dilution (1458-fold) has been created. Briefly vortex each diluted supernatant before proceeding with the next dilution.
- Thaw SARS-CoV-2 supernatants and control supernatants at 4 °C for at least 1 h. Keep the supernatants and their dilutions cold (2-8 °C) until use. Label and arrange eight 1.5-mL microfuge tubes each for SARS-CoV-2 and control supernatants.
- Incubate the microspheres with the supernatant.
- Vortex the pre-prepared working Bead Mixture for 30 s to resuspend the microspheres and add 5 µL of the Bead Mixture to each assigned well of a flat-bottom 384-well microtiter plate.
NOTE: 96-well plates can also be used. - Add 45 µL of the prepared supernatant dilutions to assigned wells containing microspheres in the 384-well plate. Seal the plate and incubate overnight (16-22 h) on an orbital shaker (650 rpm) at RT (18-22°C) in the dark.
- Vortex the pre-prepared working Bead Mixture for 30 s to resuspend the microspheres and add 5 µL of the Bead Mixture to each assigned well of a flat-bottom 384-well microtiter plate.
- Wash excess supernatant from beads.
- Remove the microtiter plate from the orbital shaker and remove the plate sealer. Centrifuge the plate at 931 x g for 1 min.
- Immobilize the beads by placing the microtiter plate on a magnetic plate separator for 30 s. With the microtiter plate still positioned on the magnetic separator, remove the plate sealer and aspirate the supernatant from magnet-immobilized beads.
- Remove the microtiter plate from the magnetic separator.
- Add 60 µL of PBS-T to each well containing beads.
- Repeat washing steps 4.5.2-4.5.4 two times for a total of three PBS-T washes.
- Prepare the different Detection Mixes in separate 1.5 mL tubes. Each detection mix consists of a commercial human monoclonal anti-S1 (Hu-anti-S1) antibody (1 µg/mL) and one of five different FLAG-tagged scFvs (1 µg/mL) (Supplementary File 1, Supplementary Table 1, and Supplementary Table 2) targeting the spike protein on the SARS-CoV-2 particle, diluted in Assay Buffer (step 4.1), resulting in a total of five different detection mixes.
- Repeat steps 4.5.2-4.5.3. Resuspend the washed microspheres in 50 µL/well of the appropriate scFv-specific Spike Detection Mix. Seal the microtiter plate and incubate for 1 h on an orbital shaker (650 rpm) at RT (18-22 °C) in the dark.
- Centrifuge the microtiter plate at 931 × g for 1 min. Wash excess Spike Detection Reagent from beads. Perform three washing steps with 60 µL of PBS-T according to steps 4.5.2-4.5.5.
- Incubate microspheres with fluorescent detection antibody mixture.
- Prepare a Fluorescent Solution Mix consisting of commercially available PE-conjugated anti-human IgG together with BV421-conjugated anti-FLAG antibody diluted in the Assay Buffer, with working concentrations of 0.2 µg/mL and 1 µg/mL, respectively. Per reaction, 50 µL of Fluorescent Detection Reagent is needed.
- Repeat Steps 4.5.2-4.5.3. Resuspend the microspheres in 50 µL/well of Fluorescent Solution Mix. Seal the microtiter plate and incubate for 30 min on an orbital shaker (650 rpm) at RT (18-22 °C) in the dark.
- Spin down microtiter plate at 931 × g for 1 min. Wash excess Fluorescent Solution Mix from the microspheres. Perform three washing steps with 60 µL of PBS-T according to steps 4.5.2-4.5.5.
- Suspend the microspheres in 60 µL of PBS-T from the last wash step. Analyze the plate on a dual-reporter flow analysis system with the settings described in step 2.6.
Results
Conjugation test
The conjugation test showed that goat-IgG and neutravidin-biotinylated ACE2 were successfully conjugated to the microspheres. The assay detection specificity was confirmed by probing ACE2-conjugated microspheres with PE-labeled secondary antibodies generated in different animal species (Figure 2). No cross-reactivity between the different detection antibodies was observed. When the bead mixtures were probed with goat anti-ACE2 + anti-goat IgG PE, a median fluorescence intensity (MFI; arbitrary units) value above the background was detected for both ACE2 and goat IgG-conjugated microspheres but not for the unconjugated microsphere (bare) or for the biotin-coated microspheres. Anti-mouse IgG PE and anti-rabbit IgG PE were used as negative controls to check for false-positive signals. A negligible fluorescence signal was generated upon incubation with the microspheres, indicating that the positive signals for the ACE2 and the goat IgG were specific.
Viral particle detectability in cell supernatants
Magnetic beads coupled to recombinant human ACE2 were used to capture SARS-CoV-2 viral particles from infected and control (no virus) VeroE6 cell culture supernatants and were then simultaneously probed for two distinct viral spike regions using a monoclonal antibody and one of five distinct scFvs. A concentration-dependent signal in the dilutions of SARS-Cov-2 infected cell supernatants was observed in both reporter channels (RP1 and RP2) (Figure 3), indicating that both the commercial Hu-anti-S1 antibody and the different scFvs detected the viral particle bound to the ACE2-conjugated microsphere. With three out of five scFvs, the virus is detectable in dilutions down to 1:18 (scFv2, scFv3, scFv5); for the remaining two scFvs (scFv7 and scFv9), it is detectable down to 1:6 dilutions. This could be attributable to a different affinity for the target. As shown in Figure 3 and Table 1, scFv3 provides the highest MFI intensity, followed by scFv5, scFv2, scFv7, and scFv9, respectively.
Globally, scFvs detection results in lower MFI in comparison to the Hu-anti-S1. This could indicate lower affinity, but it could also be an artifact due to the labeling with different fluorescent dyes (PE and BV421). Another trend that can be seen for scFv7 and scFv9 is that the MFI values are slightly lower for the RP1 channel (anti-spike) as well compared to the other three configurations. This could indicate that the scFvs are either cross-reacting or interfering in another way with the ACE2-Hu-anti-S1 interaction, which could also explain the lower signal in the RP2 channel. No viral particles were detected in the supernatant of the non-infected Vero E6 cells in either the RP1 or the RP2 channel.
The neutravidin-biotin conjugated microsphere, the goat-IgG microsphere, and the unconjugated microspheres are used as negative control beads. The viral particles were captured with magnetic microspheres coupled to ACE2 and tested with commercial human anti-spike in the RP1 reporter channel and with different scFvs in the RP2 reporter channel (scFv is indicated in the top left of each panel). No virus particles were detected in any of the infected and non-infected samples.
Assay precision and robustness
To evaluate assay precision, all the conditions were run in triplicate. A coefficient of variance (CV) for the ACE2 microsphere was calculated for each dilution point. All of the calculated CVs for the assay were below 15%, where the highest measured CV was 13%, and the lowest CV was 1% (Table 2). As can be seen in the density plot (Figure 4) of the RP1 channel, PE detection of the commercial Hu-anti-S1 shows higher precision, mainly concentrated around a CV of 3%. The RP2 channel, BV detection of scFVs, shows higher CVs. However, as can be seen in Table 2, the higher range of CVs is driven by the samples with low concentrations of viral particles, such as the blank. To test the robustness of the protocol, the assay was repeated twice by different operators, using bead mixtures generated on different days and a lower sample volume (72% lower). A very good Pearson correlation, ranging between 0.98 and 1, was observed for both the RP1 and the RP2 channels (p-value < 0.01), confirming assay robustness and the possibility of applying the assay when less sample is available (Figure 5). This flow analysis technology follows the "ambient analyte theory"17, making the assay sensitive to concentration but not volume.

Figure 1: The virus particle assay. (A) Cell supernatant from both infected and un-infected Vero E6 cells are added in a serial dilution to either a 96-well or 384-well plate, together with magnetic microspheres conjugated with neutravidin, and then coupled to either biotinylated human ACE2 or Biotin. Unconjugated microspheres coupled with goat-IgG and bare microspheres are used as negative controls together with the neutravidin-biotin conjugated microsphere. (B) Microsphere-virus particle complexes that have formed are detected with a detection cocktail consisting of Hu-anti-S1 and one of the different scFvs with FLAG-tag. A fluorescent mix with anti-human IgG PE targeting the Hu-anti-S1 and anti-FLAG Brilliant Violet 421 targeting the scFvs is then added. (C) The three-laser, dual-detection system emits a red, green, and violet laser to detect the microparticle complex. The red laser detects the microsphere dye label, while the green and violet lasers detect the anti-S1 and the scFvs, respectively. The generated data are then analyzed. Please click here to view a larger version of this figure.

Figure 2: Conjugation confirmation plot. The bead mixtures consisted of four different microsphere IDs, each conjugated with a different protein: neutravidin-biotin-ACE2 (ACE2), unconjugated microsphere (Bare Bead), neutravidin-biotin (Biotin), and goat-IgG (Goat IgG). In the conjugation test three different configurations of detection fluorophores were used. Namely, goat anti-ACE2 + anti-goat IgG PE, anti-mouse IgG PE, and anti-rabbit IgG PE. The Y-axis shows the average measured MFI (median fluorescence intensity; arbitrary units) signal from each microsphere with the three different conditions. The X-axis shows the different capture antibodies applied. Please click here to view a larger version of this figure.

Figure 3: Multiplexed detection of surface proteins. Y-axis: Mean MFI (median fluorescence intensity; arbitrary units ± standard deviation) for each sample, analyzed in triplicate wells per condition. X-axis: Serial dilution points of cell supernatant. Orange: Virus particles in supernatant from Vero E6 infected with SARS-CoV-2 WT detected with human anti-spike + anti-human PE (phycoerythrin). Blue: Supernatant from Vero E6 infected with SARS-CoV-2 WT detected with the different scFvs + anti-FLAG Brilliant Violet 421. Grey: Non-infected cell supernatant detected with human anti-spike + anti-human PE. Black: Non-infected cell supernatant detected with the five different scFvs + anti-FLAG Brilliant Violet 421. The viral particles were captured with magnetic microspheres coupled to ACE2 and tested with commercial human anti-spike antibodies in the RP1 reporter channel and with different scFvs in the RP2 reporter channel (scFv is indicated in the top left of each panel). No virus particles were detected in any of the non-infected samples. The epitope targeted by scFv3 had the highest affinity. Please click here to view a larger version of this figure.
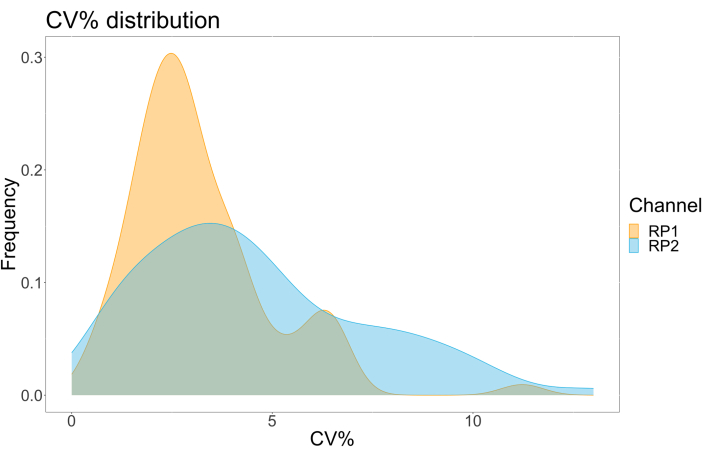
Figure 4: Variation dispersion plot. The Y-axis is the frequency of events, and the X-axis shows the coefficient of variance (CV) in percentage for each replicate of the different samples. RP1 and RP2 are the first and second reporter channels that detect fluorescence associated with phycoerythrin and Brilliant Violet 421, respectively. Please click here to view a larger version of this figure.
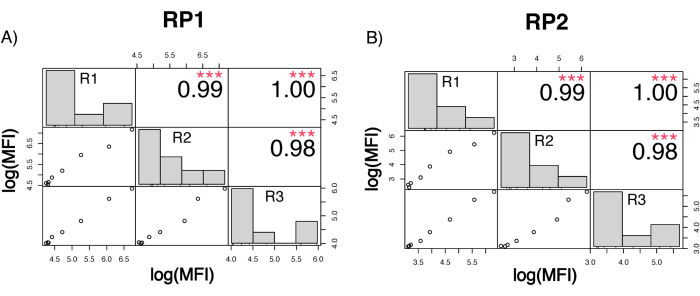
Figure 5: Run correlation matrix. (A,B) Y-axis: Pearson correlation matrix in log10-scale between three separate runs, run by three different operators and with different bead mixtures. A lower sample volume was applied in the third run. The histograms show the distribution of the different variable clusters based on measured MFI. (A) Correlation for the RP1 reporter channel between the different runs. (B) Correlation for the RP2 reporter channel between the different runs. MFI=median fluorescence intensity in arbitrary units. ***p < 0.001. Please click here to view a larger version of this figure.
| Detection | Reactivity |
| scFv2 | ++ |
| scFv3 | +++ |
| scFv5 | ++ |
| scFv7 | + |
| scFv9 | + |
| Human anti-Spike IgG | ++++ |
Table 1: Ranking of scFvs in detection based on the MFI intensity obtained in the standard curves.
| RP1 (PE) | RP2 (BV421) | |
| Sample Dilution | CV range [%] | CV range [%] |
| Blank | 3–11 | 2–13 |
| 1:1458 | 1–7 | 2–7 |
| 1:456 | 4–6 | 3–8 |
| 1:162 | 3–6 | 3–7 |
| 1:54 | 2–4 | 2–4 |
| 1:18 | 2–4 | 1–4 |
| 1:6 | 2–6 | 1–6 |
| 1:2 | 1–5 | 1–3 |
Table 2: CV% (mean/standard deviation × 100) range of each dilution point of the SARS-CoV-2 infected supernatant for both the RP1 and the RP2 reporter channels.
Supplementary File 1: Immunoglobulin single-chain variable fragment (scFv) generation. Please click here to download this File.
Supplementary Table 1: Screening scFvs in pairs with Fabs against serial dilution of recombinant Spike (RBD). To evaluate the performance of different detection peptides, 12 combinations of spike protein, Fab, were used as capture in buffer spiked with recombinant RBD. Ten (10) scFvs targeting different epitopes of the spike protein were applied as detection. Depending on the performance of the capture-detection pair, they were either marked as failed (-) or successful (+). Please click here to download this File.
Supplementary Table 2: Screening scFvs in pairs with Fabs against serial dilution of SARS-Cov-2 infected Calu-3 cell supernatant. For evaluation of different detection peptides performance, 12 combinations of spike protein, Fab, were used as capture in SARS-Cov-2 infected Calu-3 cell supernatant. Ten (10) scFvs targeting different epitopes of the spike protein were applied as detection. Depending on the performance of the capture-detection pair, they were either marked as failed (-) or successful (+). Please click here to download this File.
Discussion
Bead-based multiplex technology has been shown to be a valuable platform for high-throughput pathogen detection in a number of clinical applications. The high flexibility of the platform, based on flow-cytometry principles, allows targeting antibodies, proteins, and nucleic acids18,19,20,21,22, multiplexing hundreds of analytes simultaneously. However, to our knowledge, this technology has not previously been applied to detect intact viral particles. In this report, the technology was applied for the detection of intact viral particles by targeting three independent surface epitopes of SARS-CoV-2.
Enveloped RNA viruses show high structural similarity to extracellular vesicles (EVs), small phospholipid membranes carrying viral RNA and proteins along with host proteins23. Sandwich immunoassays have previously been applied to the detection of EVs, using an antibody pair targeting two distinct surface proteins24,25. The limitation of sandwich assays to simultaneously detect only two proteins is removed with multiplex approaches that allow the simultaneous detection of more than two proteins per reaction.
The three-laser dual-reporter detection system described here is the most advanced bead-based flow analysis instrument to date. With respect to single-reporter readout systems, the dual-reporter (RP1 and RP2 channels) allows the detection of three surface proteins/epitopes in parallel. Targeting multiple viral surface proteins and epitopes provides a more accurate representation of the viral protein load, which, beyond confirming that the virus is in fact, intact, also opens up the opportunity to further investigate viral surface antigens and the mechanisms of the viral and host protein interactions.
During the COVID-19 pandemic, the importance of promptly identifying individuals carrying active viral particles was important in efforts to contain virus spread. Genomic RNA is detected by quantitative RT-PCR regardless of its origin (intact virus particles or free). However, only an intact envelope with accessible S protein can mediate cell entry and subsequent virus replication. Previous studies with microfluidic chips in patient samples have shown how the detection of intact viral particles combined with point-of-care testing would enable frequent testing and enhanced surveillance of disease spread, including a more informed choice of individuals to be quarantined26. The application of a multiplexed microsphere-based assay would allow for the design of assays aimed at the screening of multiple viruses and their surface antigen variants, obtaining a more accurate picture of virus spread in the population.
Flow virometry is a recent development of flow cytometry aiming at the analysis of viral particles. Despite being capable of detecting discrete viral particles, the analysis of small viruses poses a current issue for flow virometry27,28. Similarly to the method described here, flow virometry involves the capture of intact virions by gold nanoparticles coupled to antibodies. Limitations for both methods include (i) the dependence on high-affinity capture and detection reagents for surface-expressed antigen targeted by the microspheres or nanoparticles, (ii) limited capability to discriminate between virus particles and extracellular vesicles, and (iii) lack of standards for proper particle quantification.
Cells secrete EVs into their surroundings, and when infected by a virus, they may also secrete virions that are similarly sized as the EVs and may eventually express the same antigens29. Because the EVs will have similar membrane compositions as the virus, it could be hard to distinguish them from each other using only affinity-based methods such as the dual laser single-reporter approach. However, strategies described here feature a higher multiplex capacity, enabling a broader and deeper investigation of particles' protein composition. Flow-based methods allow tracking of discrete particles, providing opportunities for digital quantification. One strategy to address the quantification issue in our method would be to use well-characterized synthetic vesicles expressing antigens of interest as virus-like particles (VLPs) for preparing standard curves.
A common path of entry and exit of SARS-CoV-2 from the host cells is through the interaction of the virus and host cell membrane2,15. In this process, the probability of host membrane proteins being incorporated into the virus surface is high. By screening incorporated host proteins, one can track the pathway of the infection and potentially predict disease course for different risk patients, allowing earlier treatment decisions. It also allows for the characterization of the viruses across different sample batches in research laboratories. This can be explored further by testing if different characteristics are related to different levels of viral infectivity and for screening of antibodies and drug molecules that target viral surface proteins.
An important aspect concerning the method described is that it relies on the affinity of the capture and detection reagents against their target proteins on the virus. The choice of affinity reagents is, therefore, a determining factor in assay performance. Possibly, multiple affinity reagents should be screened and tested for capture and detection to select those with the highest affinity. Here, the performance of ten scFvs and twelve Fab fragments was preliminarily assessed using recombinant RBD and on viral particles from the supernatant of SARS-Cov-2 infected Calu-3 lung epithelial cells (VeroE6 cells were used to culture/assess cytotoxicity in all subsequent studies). Anti-FLAG PE was used to detect the FLAG-tagged scFvs (Supplementary Table 1 and Supplementary Table 2). The five best-performing scFvs were then selected to be applied in the dual-reporter assay, together with commercial Hu-anti-S1 (Table 1), on supernatants from infected VeroE6 African green monkey kidney epithelial cells.
Another critical factor for the protocol's success is the procedure selected for microsphere coupling. The coupling method should be efficient and, at the same time, keep conformational epitopes or amino acid residues involved in the protein binding intact and unmodified. Here, the EDC-NHS reaction was applied to couple neutravidin directly to microspheres, adapting a protocol previously described30 and a neutravidin + biotin system to bind recombinant ACE2 to the coupled microspheres. Alternative coupling methods and their efficiency can be tested and compared. Finally, it was observed that different fluorescently labeled detection reagents (e.g., anti-FLAG PE (phycoerythrin) and anti-FLAG Brilliant Violet 421) may result in different MFI levels that may affect assay sensitivity.
In conclusion, the method described allows the detection of intact viral particles in solution, applying a dual-reporter strategy. The analysis of three surface determinants in parallel provides a more specific tool to characterize viral particles and eventually discriminate them from other EVs (e.g., not containing viral antigens). This strategy is an alternative to flow virometry. Although the current approach does not discriminate particle sizes, magnetic bead strategies using color-coded microspheres offer a broader capability in surface antigen profiling and experimental design by high-multiplex and high-throughput analysis. The assay shows high precision and robustness and can be extended to the analysis of any type of extracellular vesicle and any other type of bioparticle exposing surface antigens in body fluids or other liquid matrices. This was a proof-of-concept study that demonstrated the utility of using scFvs as one detection reagent in a multiplex analysis of multiple protein epitopes on viral particles. Future studies are necessary to determine the specific characteristics of scFvs (e.g., binding affinities, cross-reactivity with other reagents and targets) if they are to be used for quantitative or clinical purposes.
Disclosures
The authors declare no conflict of interest.
Acknowledgements
We acknowledge at SciLifeLab, Sweden, the Affinity Proteomics-Stockholm Scilifelab Unit team for developing and applying the method described here, the Human Antibody Therapeutics Unit for providing scFvs and Fab reagents, and Jonas Klingström for the VeroE6 cells infected with SARS-CoV-2 isolates stemming from clinical samples. The authors thank Sherry Dunbar, PhD, MBA of Luminex Corporation (Austin, TX), for research support, and Matt Silverman MSci, PhD of Biomedical Publishing Solutions (Panama City, FL; mattsilver@yahoo.com) for scientific and writing assistance. This work was supported by funds from the Knut and Alice Wallenberg Foundation and Science for Life Laboratory (SciLifeLab) (VC2020-0015 to Claudia Fredolini and Francesca Chiodi and VC-2022-0028 to Claudia Fredolini).
Materials
| Name | Company | Catalog Number | Comments |
|---|---|---|---|
| ACE2-Biotin | Acro Biosystems (Newark, DE) | AC2-H82E6-25 ug | Conc: 340 µg/mL, LOT#BV35376-203HFI-2128 |
| Anti-Goat IgG, PE-conjugated | Jackson ImmunoResearch (West Grove, PA) | 705-116-147 | Host species: Donkey |
| Anti-Human IgG R-PE | Life Technologies/Thermo Fisher (Waltham, MA) | H10104 | Conc: 0.15 mg/mL, LOT#2079224, Host species: Goat |
| Anti-Mouse IgG, PE-conjugated | Jackson ImmunoResearch (West Grove, PA) | 115-116-146 | Host species: Goat |
| Anti-Rabbit IgG, PE-conjugated | Jackson ImmunoResearch (West Grove, PA) | 111-116-144 | Host species: Goat |
| Biotin | Thermo-Fisher Scientific (Waltham, MA) | 20RUO | 100 mM, pH 10 Conc. 1 mg/mL |
| Blocker Casein in PBS | Thermo-Fisher Scientific (Waltham, MA) | 37528 | LOT#VD301372 |
| Blocker reagent for ELISA (BRE) | Roche (Basel, Switzerland) | 11112589001 | |
| Brilliant Violet 421 anti-DYKDDDDK Tag Antibody (Anti-FLAG) 0.2 mg/ml, rat IgG2a, λ | BioLegend (Amsterdam, The Netherlands) | 637321 | |
| Bovine serum albumin (BSA) | Saveen & Werner (Limhamn, Sweden) | B2000-500 | LOT#04D5865 |
| EDC (1-Ethyl-3-[3-dimethylaminopropyl]carbodiimide hydrochloride) | Proteochem (Hurricane, UT) | C1100-custom (65 mg) | LOT# MK3857 |
| Fetal calf serum (FCS) | Gibco/Thermo Fisher (Waltham, MA) | 10270-106 | |
| Goat anti-ACE2 polyclonal antibody | R&D Systems/Bio-Techne (Minneapolis, MN) | AF933 | Host species: Goat |
| Goat IgG | Bethyl Labs (Montgomery, TX) | P50-200 | LOT#P50-200-6 |
| L-glutamine | Thermo-Fisher Scientific (Waltham, MA) | 25030024 | |
| Low-bind 1.5 mL microfuge tubes | VWR (Radnor, PA) | 525-0133 | |
| MagPlex-C Microspheres | Luminex Corporation (Austin, TX) | MC10XXX-01 | |
| MEM tissue cuture media | Gibco/Thermo Fisher (Waltham, MA) | 21430-020 | |
| Microplate, 96-Well, Polystyrene, Half-area, Clear | Greiner Bio-One (Kremsmünster, Austria) | 675101 | |
| NaHCO3 | Gibco/Thermo Fisher (Waltham, MA) | 25080-060 | |
| Neutravidin | Thermo-Fisher Scientific (Waltham, MA) | 31000 | LOT#UK292857 |
| PBS tablets | Medicago AB (Uppsala, Sweden) | 09-9400-100 | LOT#272320-01 |
| Penicillin/Streptomycin | Gibco/Thermo Fisher (Waltham, MA) | 15140122 | |
| Poly(vinyl alcohol) | Sigma-Aldrich (St. Louis, MO) | 360627 | |
| Polyvinylpyrrolidone | Sigma-Aldrich (St. Louis, MO) | 437190 | |
| ProClin 300 | Sigma-Aldrich (St. Louis, MO) | 48915-U | |
| Rabbit IgG | Bethyl Labs (Montgomery, TX) | P120-301 | LOT#12 |
| scFv-FAb1 | In-house production | Human Antibody Therapeutics Unit, Scilifelab, Sweden. Monoclonal scFv. Conc: 0.12 mg/mL. | |
| scFv-FAb2 | In-house production | Human Antibody Therapeutics Unit, Scilifelab, Sweden. Monoclonal scFv. Conc batch1: 0.38 mg/mL. Conc batch2: 0.45 mg/mL | |
| scFv-FAb3 | In-house production | Human Antibody Therapeutics Unit, Scilifelab, Sweden. Monoclonal scFv. Conc: 0.34 mg/mL. | |
| scFv-FAb4 | In-house production | Human Antibody Therapeutics Unit, Scilifelab, Sweden. Monoclonal scFv. Conc: 2.85 mg/mL. | |
| scFv-FAb5 | In-house production | Human Antibody Therapeutics Unit, Scilifelab, Sweden. Monoclonal scFv. Conc:2.7mg/mL. | |
| SARS-CoV-2 infectious particles, Swedish isolate | In-house production | The Public Health Agency of Sweden | |
| SARS-CoV-2 Spike Antibody (Hu-anti-S1) | Novus Biologicals (Centennial, CO) | NBP2-90980 | Monoclonal antibody. Conc: 1 mg/mL. Host: Human. Clone: CR3022. Isotype: IgG1 Kappa. LOT#T201B06 |
| Sodium phosphate monobasic, anhydrous | Sigma-Aldrich (St. Louis, MO) | S3139 | |
| Sulfo-NHS (N-hydroxysulfosuccinimide) | Thermo-Fisher Scientific (Waltham, MA) | 24510 | LOT# XH321563 |
| Tween | Thermo-Fisher Scientific (Waltham, MA) | BP337-50 | LOT#194435 |
| Ultraviolet lamp | Vilber Lourmat GmbH (Eberhardzell, Germany) | VL-215.G | Wavelength = 254 nm; 2 × 15-watt bulbs |
| Vero E6 cells | ATCC (Manassus, VA) | CRL-1586 | |
| xMAP INTELLIFLEX DR-SE (dual-reporter flow instrument) | Luminex Corporation (Austin, TX) | INTELLIFLEX-DRSE-RUO |
References
- Rey, F. A., Lok, S. M. Common features of enveloped viruses and implications for immunogen design for next-generation vaccines. Cell. 172 (6), 1319-1334 (2018).
- V'kovski, P., Kratzel, A., Steiner, S., Stalder, H., Thiel, V. Coronavirus biology and replication: implications for SARS-CoV-2. Nature Reviews Microbiology. 19 (3), 155-170 (2021).
- Burnie, J., et al. Flow virometry quantification of host proteins on the surface of HIV-1 pseudovirus particles. Viruses. 12 (11), 1296(2020).
- Gentili, M., et al. Transmission of innate immune signaling by packaging of cGAMP in viral particles. Science. 349 (6253), 1232-1236 (2015).
- Modrow, S., Falke, D., Truyen, U., Schätzl, H. Viruses: Definition, Structure, Classification. In Molecular Virology. , Springer. Berlin, Heidelberg. 163-181 (2013).
- Trinh, K. T. L., Do, H. D. K., Lee, N. Y. Recent advances in molecular and immunological diagnostic platform for virus detection: A review. Biosensors. 13 (4), 490(2023).
- Zamora, J. L. R., Aguilar, H. C. Flow virometry as a tool to study viruses. Methods. 134-135, 87-97 (2018).
- Graham, H., Chandler, D. J., Dunbar, S. A. The genesis and evolution of bead-based multiplexing. Methods. 158, 2-11 (2019).
- Byström, S., et al. Affinity proteomic profiling of plasma for proteins associated to area-based mammographic breast density. Breast Cancer Research. 20 (1), 14(2018).
- Rudberg, A. -S., et al. SARS-CoV-2 exposure, symptoms and seroprevalence in healthcare workers in Sweden. Nature Communications. 11 (1), 5064(2020).
- Liu, J., et al. Multiplex reverse transcription PCR Luminex assay for detection and quantitation of viral agents of gastroenteritis. Journal of Clinical Virology. 50 (4), 308-313 (2011).
- Gadsby, N. J., Hardie, A., Claas, E. C. J., Templeton, K. E. Comparison of the Luminex respiratory virus panel fast assay with in-house real-time PCR for respiratory viral infection diagnosis. Journal of Clinical Microbiology. 48 (6), 2213-2216 (2010).
- Lorenzen, E., et al. Multiplexed analysis of the secretin-like GPCR-RAMP interactome. Science Advances. 5 (9), (2019).
- Angeloni, S., Cameron, A., Pecora, N. D., Dunbar, S. A rapid, multiplex dual reporter IgG and IgM SARS-CoV-2 neutralization assay for a multiplexed bead-based flow analysis system. Journal of Visualized Experiments: JoVE. (170), e62487(2021).
- Jackson, C. B., Farzan, M., Chen, B., Choe, H. Mechanisms of SARS-CoV-2 entry into cells. Nature Reviews Molecular Cell Biology. 23 (1), 3-20 (2022).
- International Standardization Organization. ISO10993-5 Biological evaluation of medical devices - Part 5: Tests for in vitro cytotoxicity. International Standardization Organization. , Geneva, Switzerland. Available from: https://nhiso.com/wp-content/uploads/2018/05/ISO-10993-5-2009.pdf (2009).
- Poetz, O., et al. Sequential multiplex analyte capturing for phosphoprotein profiling. Molecular & Cellular Proteomics. 9 (11), 2474-2481 (2010).
- Dunbar, S. A., Vander Zee, C. A., Oliver, K. G., Karem, K. L., Jacobson, J. W. Quantitative, multiplexed detection of bacterial pathogens: DNA and protein applications of the Luminex LabMAP system. Journal of Microbiological Methods. 53 (2), 245-252 (2003).
- Taniuchi, M., et al. Multiplex polymerase chain reaction method to detect Cyclospora, Cystoisospora, and Microsporidia in stool samples. Diagnostic Microbiology and Infectious Disease. 71 (4), 386-390 (2011).
- Wu, M., et al. High-throughput Luminex xMAP assay for simultaneous detection of antibodies against rabbit hemorrhagic disease virus, Sendai virus, and rabbit rotavirus. Archives of Virology. 164 (6), 1639-1646 (2019).
- Dias, D., et al. Optimization and validation of a multiplexed Luminex assay to quantify antibodies to neutralizing epitopes on human papillomaviruses 6, 11, 16, and 18. Clinical and Vaccine Immunology. 12 (8), 959-969 (2005).
- Opalka, D., et al. Simultaneous quantitation of antibodies to neutralizing epitopes on virus-like particles for human papillomavirus types 6, 11, 16, and 18 by a multiplexes lumina assay. Clinical and Diagnostic Laboratory Immunology. 10 (1), 108-115 (2003).
- Nolte-'T Hoen, E., Cremer, T., Gallo, R. C., Margolis, L. B. Extracellular vesicles and viruses: Are they close relatives. Proceedings of the National Academy of Sciences. 113 (33), 9155-9161 (2016).
- Ohmichi, T., et al. Quantification of brain-derived extracellular vesicles in plasma as a biomarker to diagnose Parkinson's and related diseases. Parkinsonism & Related Disorders. 61, 82-87 (2019).
- Ter-Ovanesyan, D., et al. Framework for rapid comparison of extracellular vesicle isolation methods. Elife. 10, e70725(2021).
- Gamage, S. S. T., et al. Microfluidic affinity selection of active SARS-CoV-2 virus particles. Science Advances. 8 (39), (2022).
- Renner, T. M., Tang, V. A., Burger, D., Langlois, M. -A. Intact viral particle counts measured by flow virometry provide insight into the infectivity and genome packaging efficiency of moloney murine leukemia virus. Journal of Virology. 94 (2), e01600-01619 (2020).
- Niraja, S., et al. A flow virometry process proposed for detection of SARS-CoV-2 and large-scale screening of COVID-19 cases. Future Virology. 15 (8), 525-532 (2020).
- Lippé, R. Flow virometry: A powerful tool to functionally characterize viruses. Journal of Virology. 92 (3), e01765(2018).
- Drobin, K., Nilsson, P., Schwenk, J. M. Highly multiplexed antibody suspension bead arrays for plasma protein profiling. Methods in Molecular Biology. 1023, 137-145 (2013).
Reprints and Permissions
