We describe a method to study how pH responds to environmental cues in the glycosomes of the bloodstream form of African trypanosomes. This approach involves a pH-sensitive heritable protein sensor in combination with flow cytometry to measure pH dynamics, both as a time-course assay and in a high-throughput screen format.
Method Article
Measuring Dynamic Glycosomal pH Changes in Living Trypanosoma brucei
* These authors contributed equally
In This Article
Summary
Abstract
Glucose metabolism is critical for the African trypanosome, Trypanosoma brucei, as an essential metabolic process and regulator of parasite development. Little is known about the cellular responses generated when environmental glucose levels change. In both bloodstream and procyclic form (insect stage) parasites, glycosomes house most of glycolysis. These organelles are rapidly acidified in response to glucose deprivation, which likely results in the allosteric regulation of glycolytic enzymes such as hexokinase. In previous work, localizing the chemical probe used to make pH measurements was challenging, limiting its utility in other applications.
This paper describes the development and use of parasites that express glycosomally localized pHluorin2, a heritable protein pH biosensor. pHluorin2 is a ratiometric pHluorin variant that displays a pH (acid)-dependent decrease in excitation at 395 nm while simultaneously yielding an increase in excitation at 475 nm. Transgenic parasites were generated by cloning the pHluorin2 open reading frame into the trypanosome expression vector pLEW100v5, enabling inducible protein expression in either lifecycle stage. Immunofluorescence was used to confirm the glycosomal localization of the pHluorin2 biosensor, comparing the localization of the biosensor to the glycosomal resident protein aldolase. The sensor responsiveness was calibrated at differing pH levels by incubating cells in a series of buffers that ranged in pH from 4 to 8, an approach we have previously used to calibrate a fluorescein-based pH sensor. We then measured pHluorin2 fluorescence at 405 nm and 488 nm using flow cytometry to determine glycosomal pH. We validated the performance of the live transgenic pHluorin2-expressing parasites, monitoring pH over time in response to glucose deprivation, a known trigger of glycosomal acidification in PF parasites. This tool has a range of potential applications, including potentially being used in high-throughput drug screening. Beyond glycosomal pH, the sensor could be adapted to other organelles or used in other trypanosomatids to understand pH dynamics in the live cell setting.
Introduction
Parasitic kinetoplastids, like most living organisms, rely on glucose as a fundamental component of central carbon metabolism. This group includes medically important organisms, such as the African trypanosome, Trypanosoma brucei; the American trypanosome, T. cruzi; and parasites of the genus Leishmania. Glucose metabolism is critical to parasite growth in the pathogenic lifecycle stages. For example, when deprived of glucose, the bloodstream form (BSF) of the African trypanosome dies rapidly. Notably, glycolysis serves as the sole source of ATP during this stage of infection1. Leishmania parasites are likewise dependent on glucose in the human host, with the amastigote lifecycle stage that resides in host macrophages reliant on this carbon source for growth2.
While these parasites have distinct lifestyles involving different insect vectors, they share many commonalities in how they respond to and consume glucose. For example, these parasites localize most glycolytic enzymes into modified peroxisomes called glycosomes. This kinetoplastid-specific organelle is related to mammalian peroxisomes based on conserved biosynthetic mechanisms and morphology3,4,5,6.
The compartmentalization of most of the glycolytic pathway enzymes into the glycosome offers parasite-specific means of regulation of the pathway. Using a chemical pH probe, we established that nutrient deprivation triggers a rapid acidification of procyclic form (PF) parasite glycosomes that results in altered glycolytic enzyme activity through exposure of an allosteric regulator binding site on the key glycolytic enzyme hexokinase7,8. In our previous work, the chemical probe required constant delivery for use, limiting its utility in other applications. Additionally, challenges maintaining the probe distribution in the glycosome in the BSF limited the utility of the approach for investigating glycosomal pH in that life stage.
In this study, we have used the fluorescent protein biosensor pHluorin2 to monitor glycosomal pH change in BSF T. brucei in response to environmental cues including glucose starvation9 (Figure 1). Results from this work suggest that BSF T. brucei acidifies glycosomes rapidly in response to starvation in a reversible fashion, similar to responses we have observed in PF parasites. We expect this biosensor will improve our understanding of glycolytic regulation in T. brucei and related parasites.
Protocol
Using T. brucei brucei 90-13 BSF trypanosomes, a monomorphic parasite line, requires consideration of safety as they are considered Risk Group 2 organisms that should be handled in biosafety level 2 facilities.
1. Trypanosome culture and transfection
- Culture T. brucei brucei 90-13 BSF trypanosomes in HMI-9 medium supplemented with 10% heat-inactivated FBS and 10% Nu-Serum at 37 °C in 5% CO210.
NOTE: To keep the culture healthy, maintain the cell density between 2 × 10⁴ and 5 × 10⁶ cells/mL. - Cloning pHluorin2-PTS1 into pLEW100v5
- Synthesize the pHluorin2 open reading frame commercially to yield the gene with a 3' extension encoding a two glycine linker followed by the tripeptide AKL, a PTS1 localization tag.
- Clone this construct into the inducible trypanosome expression vector pLEW100v5 by restriction digest. Double digest both the cloning vector containing pHluorin2-PTS1 and pLEW100v5 using HindIII and BamHI11. Perform a cleanup step, preferably by agarose gel purification, to remove restriction enzymes, the undesired cloning vector backbone, and the excised luciferase gene-containing fragment.
- Ligate the pHluorin2-bearing insert into digested pLEW100v5 with T4 DNA Ligase12. (see Supplemental Figure S1 for a scheme for cloning).
- Sequence the plasmid by next-generation whole-plasmid sequencing to verify the insert and vector are ligated correctly and that no mutations are introduced within the pHluorin2-PTS1 gene during the cloning process.
NOTE: The complete plasmid sequence has been submitted to Addgene.org and has been assigned #83680. - Linearize 20 µg of the plasmid by digesting with 40 units of NotI; then, transfect into BSF 90-13 parasites via nucleofection using the referenced human T-cell kit (see Table of Materials). Select for stable integration as described by Burkard et al.13.
2. Immunofluorescence colocalization of pHlourin2-PTS1
- Prepare microscopy slides by treating them with poly-L-lysine 0.1% (w/v) in H2O for 10 min. After removal of the poly-L-lysine solution, wash the slide once with PBS.
- To induce pHluorin2-PTS1 expression, treat cells at 2 × 10⁵ cells/mL with tetracycline or doxycycline (1 µg/mL) 24 h prior to harvest. Pellet 2 × 10⁶ parental and induced pLEWpHluorin2-PTS1 (pHL) parasites by centrifugation (room temperature [RT], 10 min, 1,000 × g) and wash once with PBS.
- Resuspend the cells in 200 µL of freshly prepared 2% paraformaldehyde in PBS made from commercially supplied 16% EM grade solution. Apply the cells in the fixative to the slide and allow the cells to settle for 30 min. Wash the adhered cells 2x with wash solution (0.1% normal goat serum in PBS).
- Apply the permeabilization solution (0.5% Triton X-100 in PBS) to the cells and incubate for exactly 30 min. Remove the permeabilization solution and wash once with ample amounts of wash solution.
- Apply the block solution (10% normal goat serum and 0.1% Triton X-100 in PBS) and incubate for 30 min.
- Dilute the antisera raised against T. brucei aldolase 1:500 in block solution and apply it to the cells14. Incubate for 1 h at RT. Wash the slides for 5x for 3-5 min min with wash solution.
- Dilute goat anti-rabbit Alexa fluor 568 1:1,000 in block solution and apply to the cells. Incubate for 1 h at RT. Wash the slides for 5x for 3-5 min with wash solution.
- Apply mounting medium and seal a coverslip to the slide.
- Image the cells with a 100x objective (NA 1.4-0.7) and analyze the images using ImageJ. Perform Pearson's colocalization analysis using the 'Coloc 2' plug-in for ImageJ. See Supplemental Figure S2 for a field of representative cells.)
- To complete this, add the image file to Fiji and select Images.
- Adjust brightness and contrast for each channel to a point in which no background is visible.
- Change images from 16-bit to 8-bit, merge the images, and then crop to a single cell with split channels.
- Under Analyze and Colocalization, select the Coloc2 plug-in. Select aldolase (the red channel) as Channel 1 and pHL (the green channel) as Channel 2 and click okay to initiate calculation of Pearson's correlation.
3. Sample preparation for flow cytometry
- Induce pHL cells with either tetracycline or doxycycline (1 µg/mL) overnight.
- Pellet the cells (~4 × 10⁷ pHL and ~1 × 10⁶ parental) by centrifugation (RT, 10 min, 1,000 × g). Remove the supernatant and resuspend the cells in 1 mL of PBS either with or without 10 mM glucose depending on whether the sample is starved or un-starved. For time-course assays, resuspend in PBS supplemented with 10 mM glucose to prevent the cells from starving till the washes are complete. For the high-throughput screen (HTS) assay, resuspend in PBS without glucose to minimize carryover of glucose; repeat the washes two more times.
- Centrifuge the cells for a fourth time, remove the supernatant, and resuspend the cell pellet in either PBS, PBS plus 5 mM glucose, or PBS plus 10 mM glucose depending on the treatment. Supplement the samples with either 1 µg/mL propidium iodide (PI) or 100 nM thiazole red (TR) for live/dead determination. Transfer each sample to 5 mL tubes compatible with the flow cytometer.
4. Flow cytometry
NOTE: Prepare the experiment on a flow cytometer containing the following lasers: 405 nm (violet), 488 nm (blue), and 561 nm (yellow) or 638 nm (red). See Supplemental Table S1 for common names for channels discussed below.
- To measure pHL fluorescence, use the channels KO525 (VL2-H, excitation 405 nm, emission 542/27 nm) and FITC (BL1-H, excitation 488 nm, emission 530/30 nm). To differentiate live cells from dead cells, use either PI or TR; measure PI on the YL2-H channel (excitation 561 nm, emission 620/25 nm). Measure TR on the RL1-H channel (638 nm excitation, 660/10 BP).
- To set up the experiment on the flow cytometer software, create the following plots: 1) YL2-H channel histogram (if using PI) or an RL1-H channel histogram (if using TR), 2) FSC-A vs SSC-A dot plot, 3) FSC-A vs FSC-H dot plot, and 4) BL1-H vs VL2-H channel dot plot.
- Place the unstained WT (parental cell-line) control onto the sample injection port (SIP) first and raise the stage into position. Begin acquiring data on the cytometer at the lowest flow rate to give time to make necessary adjustments. To avoid scoring spurious debris and dead cells, begin recording events 5 s after sample acquisition begins.
- Adjust the YL2 or RL1 voltage so the main peak is within 103-104 relative fluorescence intensity (RFI) units. Adjust FSC and SSC voltages so that >90% of events fit on the dot plot. Adjust the FSC threshold to exclude the debris population but not likely cells.
- Adjust the VL2 and BL1 channels so the primary peak is within 103-104 RFI units for the unstained WT control.
- Place the first sample containing induced pHL stained with either PI or TR onto the SIP and raise the stage into position. Begin acquiring data at the lowest flow rate and carefully observe events in each plot. Ensure >90% of events are within each plot and that no events are saturating the VL2-H and BL1-H channels.
- Proceed with running the samples. Be sure to record at least 10,000 events per sample.
- Save the data from the samples in .fcs file format and export for analysis.
5. Data analysis of flow cytometry results
NOTE: This data analysis workflow uses FlowJo software. If other flow cytometry analysis software is used, continue to follow the key steps described below, using software-appropriate tools. To visualize the plots and gating, see Supplemental Figure S3 and Supplemental Figure S4.
- Open a new layout and open the .fcs files acquired in step 4.3. Drag and drop the .fcs files into the layout window.
- Gate for live cells.
- Double-click the unstained WT control to open a window for this sample.
- View the data as a histogram on either the YL2-H channel (if using PI) or RL2-H (if using TR) channel. Toggle between this and samples stained with the viability dye to identify the live and dead populations.
NOTE: All events should be unstained since a viability dye was not added to this sample. - Create a bisector gate dividing the live and dead populations; name the left gate Live and the right gate Dead. Apply this gate to all samples then toggle between samples to ensure this gate is drawn appropriately for all samples. Adjust the gate as needed.
- Gate for the cells.
- On the unstained WT control, double-click on the Live gate to view events in that gate. Change the dot plot x-axis to FSC-A and y-axis to SSC-A.
- Use the polygon gate tool to draw a gate around the cell population and name it Cells. Take care to exclude debris/dying cells (typically in the far left and bottom of the dot plot) and aggregates (far right and top of the dot plot).
- Apply this gate under the Live gate for all samples. Toggle between samples to ensure the gate encompasses the likely cell population for all samples and make necessary adjustments. Be sure to reapply the gate to all samples after altering it.
NOTE: The cell population distribution noticeably changes between starved and un-starved conditions on FSC vs SSC; ensure the Cell gate encompasses the cell population in all conditions.
- Gate for single cells to increase the quality of pH measurements.
- On the unstained WT control, double-click on the Cell gate to view events in that gate. Change the dot plot x-axis to FSC-A and y-axis to FSC-H.
- Look for a diagonal distribution of single cells on this dot plot with doublets forming a secondary population to the lower right of the singlet population (see Supplemental Figure S1 third plot). Using the polygon gate tool, draw a gate around the singlet events excluding the doublet population. Name this gate Singlets.
- Apply the Singlets gate under the Cell gate for all samples. Again, toggle between samples to ensure the gate is properly excluding the doublet population while including the singlet population. Adjust as needed.
- Gate for fluorescent pHL cells.
- On the unstained WT control sample, double-click on the Singlets gate to open a dot plot for that population. Change the x-axis to BL1-H and the y-axis to VL2-H.
- The pH sensor pHluorin2 is fluorescent in both VL2 and BL1. Use the polygon gate tool to draw a diagonal-shaped gate extending to the top and right away from the autofluorescent population in the lower left of the dot plot. Name this gate pHL+.
- Apply the pHL+ gate under the Singlets gate for all samples. Toggle to a pHL sample and adjust the gate to include events with greater fluorescence intensity in both VL2-H and BL1-H than the WT control. Ensure this gate encompasses this fluorescent population for all samples as the position of this population will shift as glycosomal pH changes.
NOTE: This small but visible shift in the pHL+ population is due to pH-dependent changes in the fluorophore's excitation spectrum.
- Export the statistics.
- Click on Table Editor | Edit bar | Add Column to add new statistics to export.
NOTE: For each statistic to export, choose the respective statistic and which population to export it from. Be sure to choose the appropriate parameter for applicable statistics such as Median. Leave the Sample unchanged. - Add columns with the following statistics: Total (ungated) Count, pHL+ Count, Live Freq. of Total (percentage based on total events), pHL+ Freq. of Parent (percentage based on parent gate), pHL+ Median VL2-H, and pHL+ Median BL1-H.
- Click on the Table Editor and change the following export settings: Display to To File and Text to CSV and then choose the file destination and name. Click on Create Table.
- Click on Table Editor | Edit bar | Add Column to add new statistics to export.
- Calculate the fluorescence ratio.
- Save the exported .csv file as a spreadsheet file.
- Perform quality control analysis by comparing the following across all samples in the experiment: number of events per sample, percentage of live events, and percentage of pHL+ events. Compare these visually in bar or scatter plots depending on the experiment.
- Label a new column as pHL+ Median VL2/BL1. For each sample, divide the median VL2-H value by the median BL1-H value as shown in equation (1).
 (1)
(1)
- Use statistical analysis software to perform statistical analysis using the fluorescence ratio.
6. pH biosensor calibration
NOTE: To convert measured fluorescence ratios to pH units, calibrate pHL-expressing cells using nigericin and valinomycin. Nigericin is a K+/H+ antiporter, an ionophore that can equilibrate pH across membranes when there is sufficient K+ in the buffer15. Nigericin has been commonly used to calibrate pHluorin and other pH sensors16,17. As peroxisomally localized pHluorin was previously calibrated using 10 µM nigericin18, we chose to treat with that concentration. Valinomycin is a potassium ionophore and has been used (at 4 µM) to equilibrate pH across mitochondrial membranes19. We used 10 µM valinomycin to assist the pH equilibration activity of nigericin by ensuring K+ ions were equilibrated across the membranes. While we used a nigericin-valinomycin combination, nigericin may be sufficient to equilibrate organellar pH.
- Prepare eight solutions of universal calibration buffer (UCB; 15 mM MES, 15 mM HEPES, and 130 mM KCl) each at a different pH ranging from 5 to 8.5.
- Centrifuge (RT, 10 min, 800-1,000 × g) eight separate tubes of 2 mL of pHL-expressing BSF culture (~4 × 10⁶ cells each).
- Remove the supernatant and then resuspend each cell pellet in UCB at different pH values.
- Introduce nigericin and valinomycin, each to 10 µM. Spike in PI to 1 µg/mL.
- Incubate the cells in each solution for 15 min.
- Run each sample on a flow cytometer to measure the fluorescence ratio as described in steps 4-5.
- Repeat this experiment twice more to obtain three biological replicates for each pH value. Export data in .fcs format.
- Analyze the .fcs files as described in steps 5.1 through 5.8. Use the measured fluorescence ratio for each pH to interpolate glycosomal pH in future experiments using equation (2).
 (2)
(2)
NOTE: Supplemental Figure S3 shows the dot plots and gating scheme. The results can be found in Supplemental Table S2. The following describes how to interpolate pH from fluorescence ratio using GraphPad Prism. If using other statistical software, follow the same key steps.- Open GraphPad Prism and create an XY table with three y-replicates. Paste the pH values in the x-column and their associated fluorescence ratio values in the y-replicate columns.
- Click on the graph associated with the table. When viewing the graph, click on Analyze under the Analysis ribbon | Interpolate a standard curve under XY analyses.
- Choose Sigmoidal, 4PL, X is log(concentration) since pH units are on a logarithmic scale. The Top and Bottom parameters are the estimated top and bottom plateaus. Choose No special handling of outliers.
NOTE: The software will seek to fit the data to the model described in equation (2) and step 6.9.3. Look for evidence of lack of fit in the Table of results and the curve on the graph. - To interpolate pH from fluorescence ratios in other experiments, go to the table with the pHL calibration data. Paste the fluorescence ratio values below the calibration data in the y-column(s). Give each y-value a title but leave the x-value (the pH) blank since it is unknown.
- In the Results gallery, click on the interpolation analysis and then go to the Interpolated X replicates tab. Look for the interpolated pH values that will be listed alongside the entered fluorescence ratio values.
NOTE: The software uses the model and best-fit parameter values found from the calibration data to interpolate pH from fluorescence ratios for experiments where pH is unknown.
7. Glucose starvation and addback time-courses
- Induce 15 mL of BSF pHL parasites overnight with 1 µg/mL doxycycline incubated at 37 °C as described in step 1.1.
- Wash 15 mL of induced pHL culture in PBS supplemented with 10 mM glucose. Repeat this step 3x.
- Concurrently, wash 3 mL of WT culture in PBS 3x as described in step 3.2.
- After the first wash when the pHL sample is resuspended in 1 mL of PBS, remove a 0.1 mL aliquot of pHL cell suspension to keep in 10 mM glucose as an un-starved control.
- After the final wash, resuspend the pHL sample in PBS supplemented with 1 µg/mL PI.
- Acquiring flow cytometry data
- Begin monitoring glycosomal pH for both the starved and un-starved samples by measuring each sample on a flow cytometer every 5, 10, 30, or 90 min, depending on the experiment and sample. Acquire flow cytometry data as described in steps 4.1 through 4.3, ensuring the voltages and plots are prepared beforehand.
- Run the unstained WT control first at 0 min.
- Run the un-starved control sample on the cytometer every 90 min starting at 0 min. For the Starvation time-course assay, run the starved sample every 10 min starting at 0 min. For the Glucose Addback assay, run the starved sample at 0, 5, 10, 20, 30, 60, and 90 min; then, repeat after introducing glucose.
- Incubate the samples at room temperature during the 90 min starvation time course and the 180 min Glucose Addback time course.
- Analyze the .fcs files as described in steps 5.1 through 5.8.
NOTE: Supplemental Figure S4 shows how to perform the gating and what the dot plots should look like. Supplemental Table S3 and Supplemental Table S4 show the results of the glucose starvation time course assay and the glucose add-back time course assay, respectively.
8. Optimizing the assay for drug screening
- Wash approximately 32 mL of pHL-expressing BSF parasites and 3 mL of WT cells, both at approximately 2 × 10⁶ cells/mL, 2x in PBS as described previously.
NOTE: More than 10,000 events need to be recorded per well to minimize variability of measured fluorescence ratios and accurately measure the Z-factor statistic. The minimum culture necessary to accomplish this is approximately 26 mL, but we recommend 32 mL for ease of handling.- After the first wash, separate the pHL sample equally into two microcentrifuge tubes.
- After the washes, resuspend one pHL sample in 18 mL of PBS containing 5 mM glucose, 0.1% DMSO, and TR. Resuspend the other pHL sample in 18 mL of PBS plus 0.1% DMSO and TR.
NOTE: The DMSO is used to mimic the buffer composition in a drug screen as compounds are typically dissolved in DMSO. - Transfer these two cell solutions into a 12-well reservoir, 9 mL per well.
- Use a pipetting robot to pipet the cell solutions into separate halves of a 384-well plate, 80 µL per well.
- Incubate the plate at room temperature for 1.5 h, gently shaking and wrapped in aluminum foil to protect the fluorophores from light.
- Run the plate on a flow cytometer capable of running 384-well plates.
NOTE: The following workflow is adapted to an Attune NxT with Cytkick Max Auto Sampler. If another flow cytometer is used, continue to follow the key steps.- For the plate, run at the fastest flow rate (1,000 uL/min) and enable boost mode. Acquire 20 µL/well. Include one mix cycle and one rinse cycle between each well.
- Create plots as described in step 4.1.3.
- Run an unstained WT tube control and optimize voltages as described in steps 4.1.3 and 4.1.4. Run a starved pHL tube sample and optimize the VL2 and BL1 voltages as described in step 4.1.
- Begin acquiring the plate on the flow cytometer. Run the plate horizontally so there is no significant acquisition time difference between the starved and un-starved sample wells. Ensure that plate acquisition is finished in ~1.5 h.
- Export the .fcs files and analyze the data as described in steps 5.1 through 5.8. Find the average (AVG) and standard deviation (SD) of the fluorescence ratios for the samples treated with either glucose (Glc) or no glucose (Starved).
NOTE: The data from our Z-factor experiments can be found in Supplemental Table S5. - Calculate the Z-factor20 statistic using equation (3).
 (3)
(3)
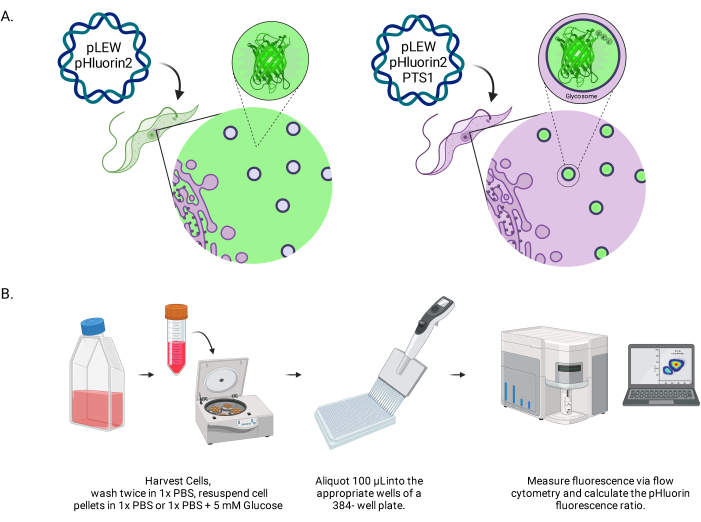
Figure 1: Diagram of the method for scoring glycosomal pH in live BSF trypanosomes. (A) Depiction of cell lines expressing glycosomally located pHluorin2 sensor. The inclusion of a peroxisomal targeting sequence provides control over the localization. NOTE: We anticipate that elimination of the PTS-1 would lead to cytosolic localization, allowing future analysis of pH in that subcellular compartment. (B) Depiction of the sensor validation assay. Abbreviation: BSF = bloodstream form. Please click here to view a larger version of this figure.
NOTE: The Z-factor statistic is used to determine how suitable an assay is for HTS. Values between 0.5 and 1.0 generally mean the assay quality is acceptable for HTS.
Results
pHLuorin2-PTS1 localization to glycosomes in BSF T. brucei
To assess the subcellular localization of the pHluorin2-PTS1, parasites were subjected to immunofluorescence assays. Signal from the transgene colocalized with anti-sera raised against a glycosome-resident protein, aldolase (TbAldolase) (Figure 2A). The average Pearson's correlation coefficient of colocalization between anti-TbAldolase and pHluorin2-PTS1 was 0.895, indicating that pHluorin2-PTS1 was primarily localized to glycosomes. With pHluorin2-PTS1 localized to the glycosome, we proceeded to investigate BF glycosome pH.

Figure 2: Localization of pHluorin2-PTS1 to glycosomes in BSF Trypanosoma brucei. (A) Colocalization of pHluorin2-PTS1 with the glycosomal-resident protein TbAldolase. BF 90-13 parasites were transfected with pLEWpHluorin2-PTS1 and expression was induced with Doxycycline (1 µg/mL). TbAldolase was localized using anti-TbAldolase sera, followed by incubation with goat anti-rabbit Alexa fluor 568. The average Pearson's correlation coefficient was 0.895 (30 cells). (B) Calibration of pHluorin2-PTS1 in BSF T. brucei. Scale bars = 4 µm. Abbreviation: BSF = bloodstream form. Please click here to view a larger version of this figure.
pHluorin2-PTS1 calibration
Changes in pH alter the excitation spectrum of pHluorin2-PTS1. Under neutral pH, pHluorin2-PTS1 excitation at 405 nm is greater than at 488 nm; as pH falls, the reverse is true9,21. To measure the relative pH of the glycosome by flow cytometry, we measured emission when excited by the 405 nm laser (VL2 channel) and emission when excited by the 488 nm laser (BL1 channel), using the ratio of VL2/BL1 (fluorescence ratio) to measure the relative glycosomal pH. To convert the fluorescence ratio to pH, we equilibrated intracellular and glycosomal pH with extracellular pH using the ionophores valinomycin and nigericin17,18 followed by flow cytometry analysis to find the fluorescence ratio. As expected, the fluorescence ratio increased as extracellular pH increased with an intracellular Kd of pH 6.5 (Figure 2B). This Kd was slightly lower than the reported in vitro Kd of pHluorin29. Interestingly, the BSF glycosomal pH in the presence of glucose was ~pH 8.0, which was more basic than PF glycosomes in the presence of glucose22. We used this calibration curve to convert the fluorescence ratio to pH in subsequent experiments.
Glycosome acidification due to glucose starvation
While T. brucei PF parasites acidify their glycosomes when starved of glucose22, how BSF glycosomes respond to glucose is unknown. To explore this, we washed BSF parasites expressing pHluorin2-PTS1 in PBS plus 10 mM glucose to remove the culture medium and then resuspended the cells in PBS without glucose. The sensor response to this perturbation was measured immediately and then every 10 min thereafter for 1.5 h by flow cytometry. Responses were compared to cells in PBS plus 10 mM glucose (un-starved).
In response to starvation, we observed a gradual mild acidification over time, which plateaued by ~90 min (Figure 3A). This change in glycosomal pH was statistically significant (p < 0.0001) and repeatable across three separate experiments. This suggests that BSF cells mildly acidify their glycosomes when starved of glucose, similar to the response observed in the PF life stage9.
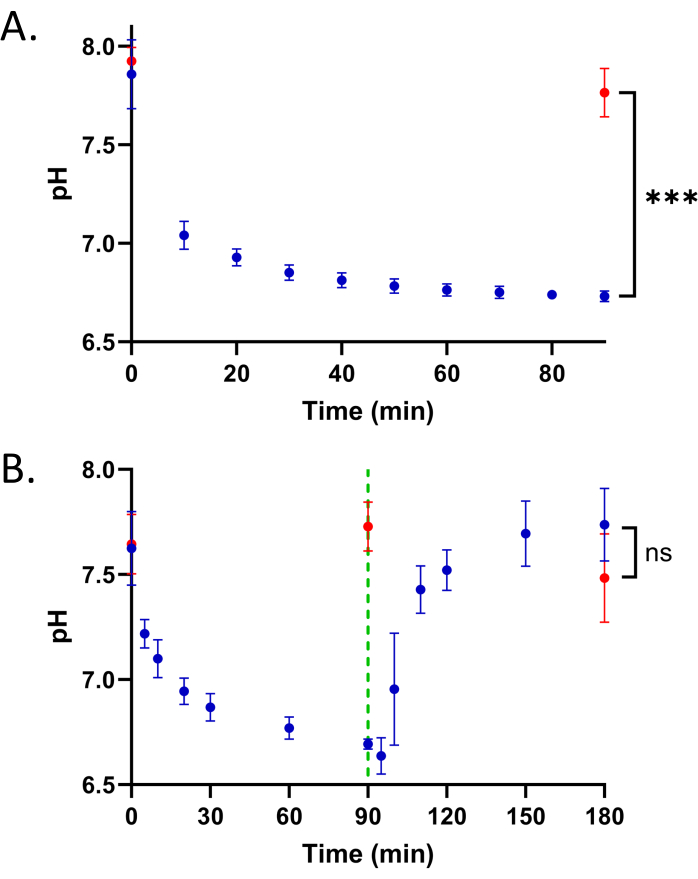
Figure 3: Reversible acidification of glycosomes of BSF T. brucei when deprived of glucose. (A) Glycosomal pH of cells grown in the absence (starved, blue) or presence (un-starved, red) of glucose. The starved cells were resuspended in PBS without glucose ~2 min prior to the first measurement on an Attune NxT flow cytometer. Three biological replicates of the time course were performed. Un-starved parasites were incubated in PBS plus 10 mM glucose. An unpaired two-tailed Student's t-test was performed comparing the starved and un-starved 90 min time points, ***p = 0.0001. (B) Time course of glycosomal pH change starved (blue) and un-starved (red) BSF parasites with 10 mM glucose reintroduced at 90 min (green dotted line). Five biological replicates of the time course were performed. NS = not significant (p = 0.25, unpaired two-tailed Student's t-test). Please click here to view a larger version of this figure.
Reversible glycosomal acidification in response to glucose
We next tested if BSF glycosome acidification was reversible by starving the cells and then reintroducing glucose. Parasites were incubated in the absence of glucose for 90 min. Glucose (10 mM) was then added and the sensor response was measured by cytometry for another 90 min (Figure 3B). We observed that after glucose was reintroduced, glycosomal pH returned to pre-starvation levels in ~30 min. These results suggest that BSF glycosomal pH is dynamic and regulable in response to glucose, similar to the pH response observed in PF parasites.
Adaptation of the pHluorin2 assay for high-throughput drug screening
Glycosomes are essential organelles for the trypanosome, as they house key metabolic pathways. The importance of glycosomes suggests that inhibitors of their homeostasis could hold promise as potential therapeutic leads. Here, we have adapted the assay for glycosomal pH to a high-throughput format, which will allow adaptation to drug screens to identify inhibitors of glycosomal pH. We anticipate disruption of the regulation of this response could be detrimental to the parasite, given the known impact of pH on glycosome-resident protein function7.
To establish the high-throughput format, we scored the assay robustness. To complete this, parasites induced to express the pHluorin2-PTS1 were plated in a 384-well microtiter plate in either 5 mM glucose (high controls) or no glucose (low controls) and then incubated for 90 min at room temperature. The plate was then analyzed by flow cytometry. As shown in Figure 4, there was low variability between replicate measurements and the high and low controls are well-separated, features that resulted in an acceptable Z-factor of 0.645. Assays with values > 0.5 are generally considered robust enough for adaptation to high-throughput screening campaigns. Given the success here, we anticipate that this sensor and approach will be used in future high-throughput drug screens.
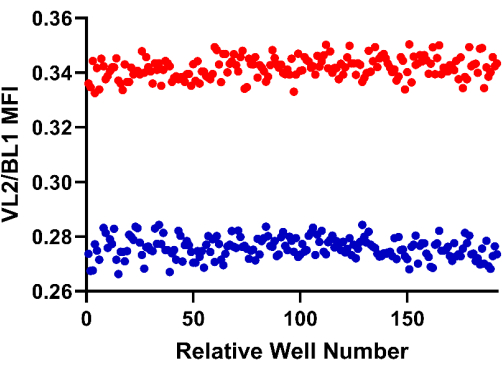
Figure 4: Assay to assess the suitability of the pHluorin2-PTS1 sensor-bearing BSF for future HTS campaigns. Cells were incubated for 90 min with glucose (high control, red, 5 mM glucose) or without the hexose (low control, blue, no additional glucose). The calculated Z-factor was 0.645. Please click here to view a larger version of this figure.
Supplemental Figure S1: Cloning pHluorin2-PTS1 gene into the inducible T. brucei expression vector pLEW100v5. (A) Both vectors were double restriction digested by HindIII and BamHI and then purified. The pHluorin2-PTS1 gene fragment was ligated into pLEW100v5 using T4 DNA ligase. (B) pLEW100-pHlourin2-PTS1. Please click here to download this File.
Supplemental Figure S2: Colocalization of pHL with TbAldolase BF 90-13 parasites transfected with pLEWpHluorin2-PTS1. Expression was induced with doxycycline (1 µg/mL). TbAldolase was localized using anti-TbAldolase sera (diluted 1:500 in block), followed by incubation with goat anG-rabbit Alexa fluor 568. The average Pearson's correlation coefficient was 0.895 (30 cells). Scale bars = 10 µm. Please click here to download this File.
Supplemental Figure S3: Representative gating and dot plots for calibration of BSF pHL sensor cell-line using the pH 8 calibration buffer sample as an example. Samples were stained with the viability dye PI to assess how pH affected viability using the YL2-H channel, but viability was not used in the gating scheme. A wide gate on FSC-A vs SSC-A was used to gate for cells as both live and dead cells were used in the calibration. After gating for cells, single cells (singlets) were gated using FSC-A vs FSC-H. Last, a stringent gate was used for events fluorescent for pHL in the BL1-H and VL2-H channels. Abbreviations: BSF = bloodstream form; PI = propidium iodide; FSC-A = forward scatter-peak area; SSC-A = side scatter-peak area; FSC-H = forward scatter-peak height. Please click here to download this File.
Supplemental Figure S4: Representative gating and dot plots for glucose starvation and add-back time course assays. The Starved 0 min sample is used as an example. Live cells were gated on the YL2-H channel since PI was used. Cells were gated using FSC-A vs SSC-A to exclude debris and aggregates. Singlets were gated using FSC-A vs FSC-H. Channels BL1-H and VL2-H were used to gate for pHL+ events. A WT control was used to exclude auto-fluorescent events when setting this gate. Abbreviations: PI = propidium iodide; FSC-A = forward scatter-peak area; SSC-A = side scatter-peak area. Please click here to download this File.
Supplemental Table S1: Channel and common name used for flow cytometry. The channel name, common name, and the laser and emission filter used are provided. Please click here to download this File.
Supplemental Table S2: Results from pHL calibration using nigericin and valinomycin in different pH buffers. This table includes the exported statistics from the FlowJo analysis of the .fcs files. These values were used to find the fluorescence ratio (VL2-H/BL1-H) for calibrating pHL, as shown in Figure 2. These pH calibration results were also used to interpolate pH for the glucose starvation and add-back time-course experiments (Figure 3). The following statistics were used for quality control: Total event count, pHL+ count, PI- (%), PI+ (%), and pHL+ (%). Data for each biological replicate is in a separate tab, and the tab labeled "Summarized Results" contains the fluorescence ratios for each pH treatment and replicate. Please click here to download this File.
Supplemental Table S3: Analyzed data from BSF pHL glucose starvation time-course assay presented in Figure 3A. This table includes exported statistics from .fcs files analyzed in FlowJo software. Fluorescence ratios were calculated by taking the ratio of median VL2-H and median BL1-H (both from the pHL+ population). These ratios were compiled in the tab labeled "Summarized Results". PI- (%) was used to determine the impact of glucose starvation on viability over time. Total count and pHL+ count were used for quality control. Please click here to download this File.
Supplemental Table S4: Analyzed data from the BSF pHL glucose add-back time-course assay presented in Figure 3B. This table contains exported statistics from .fcs files analyzed in FlowJo software. The pHL+ Median VL2/BL1 values were calculated from pHL+ median VL2-H and BL1-H in Excel. The other statistics were used for quality control. Please click here to download this File.
Supplemental Table S5: Resultant data from FlowJo analysis of the Z-Factor trial high-throughput screening assay using pHL. Tabs labeled "0 mM Glucose" (Low) and "5 mM Glucose" (High) include data from cells treated with 0 or 5 mM glucose, respectively. These fluorescence ratios are presented in Figure 4. In the "Pooled Analysis" tab, the fluorescence ratios for both treatments were compiled and the mean and standard deviation of the sample (SD) were calculated for each. The Z-factor statistic was calculated using equation 3. The ratio of mean High/Low was calculated to measure the separation of the means. Please click here to download this File.
Discussion
Environmental perception and response mechanisms in the African trypanosome are poorly understood. Changes in nutrient availability are known to trigger diverse responses in the parasite, including acidification of glycosomes. Here, we have described a method to study glycosomal pH response to environmental perturbations in living cells using a heritable protein sensor, pHluorin2, and flow cytometry.
There are several critical steps in the use of the sensor. First, the characterization of transfected parasites that express the transgene is important, as there can be cell-to-cell variation in expression. Expression levels of some transgenes can fall over time. While that has not been observed with the pHluorin2-bearing cells to date, if sensor responsiveness becomes highly variable (e.g., after induction, the sensor signal is not robust), it may be necessary to clone out the culture, as some members of the population may express the protein at higher levels than others. Alternatively, retransformation and selection have proven useful for generating new cell lines with higher (albeit possibly transient) expression. If re-transfection is required, we recommend cloning out individual lines, as the expression of the transgene of interest could impart a subtle growth disadvantage leading to loss of high expressors in the population over time.
Additionally, it is essential to monitor parasite viability-both during the assay and while routinely maintaining cultures. We have included either PI or thiazole red for this purpose during the assay, and these reporters ensure that data only reflects responses in living cells. Ensuring that cell doubling time during normal culture is constant, particularly prior to initiation of large-scale assays (e.g., HTS-type assays) limits concern about initiating assays with cells that are not thriving, which could negatively alter high and low control signals and impact overall robustness of the screen.
The approach we have described here for measuring glycosomal pH is robust and sensitive. However, there are limitations to the approach. First, access to cytometers with appropriate capabilities, including samplers capable of accepting microtiter plates, is required. While ratiometric data can be collected by fluorescence microscopy, the limited number of samples that can be analyzed that way limits the utility of approaches such as screens (and time course-based assays).
A second potential limitation is that the assays involve an agent of biosafety concern. It is possible that core facilities that house the instruments needed for the work may not allow living parasites on their equipment. These limitations, along with the technical challenges of generating and maintaining transgenic trypanosomes, can be overcome through collaboration between groups with appropriate expertise in parasite biology and cell analyses.
The work described here focuses on using the glycosomal pH sensor in African trypanosomes but the tool could be adapted for use in other kinetoplastid parasites. While it is unclear what role acidification of the organelle might have in the biology of Leishmania spp. or Trypanosoma cruzi, is it possible that pHLuorin2-PTS1 could be expressed as a transgene in the cells given that parasite-specific expression vectors are available and that the glycosomal import machinery is similar in the organisms5,23,24.
One potential application of the sensor-bearing cells is the identification of small molecules that alter the cellular capacity to acidify the glycosome. These would likely be noxious to the parasite, as altered pH has been found to be a possible means of regulation of hexokinase, a glycosome-resident protein that is essential in the pathogenic life cycle stage of the African trypanosome7. The assay described here has been adapted to be high throughput (Figure 4), allowing interrogation of large chemical collections for this activity.
In summary, this tool offers the opportunity to dissect mechanisms involved in dynamic responses in a parasite-specific organelle. Using the sensor lines in combination with forward and reverse genetics it is likely that unique parasite-specific pathways will be identified. Further, the sensor lines offer the opportunity for the identification of small molecule inhibitors of the response, opening the door to new drug target discovery.
Disclosures
The authors declare no conflicts of interest.
Acknowledgements
pHluorin2-PTS1 was cloned into pLEW100v5 by Twist Bioscience who provided the construct in a high-copy cloning vector; pLEW100v5 was a gift from Dr. George Cross. Antiserum raised against T. brucei aldolase is available from Dr. Meredith T. Morris, Clemson University, upon request. Work from the JCM and KAC laboratories was partially supported by an award from the National Institutes of Health (R01AI156382). SSP was supported by NIH 3R01AI156382.
Materials
| Name | Company | Catalog Number | Comments |
|---|---|---|---|
| 50 mL Tissue Culture Flasks (Non-treated, sterile) | VWR | 10861-572 | |
| 75 cm2 Tissue Culture Flask (Non-Treated, sterile) | Corning | 431464U | |
| 80 µL flat-bottom 384-well plate | BrandTech | 781620 | |
| Amaxa Human T Cell Nucleofector Kit | Lonza | VPA-1002 | |
| Attune NxT Flow Cytometer | invitrogen by Thermo Fisher Scientific | A24858 | FlowJo software |
| BRANDplates 96-Well, flat bottom plate | Millipore Sigma | BR781662 | |
| Coloc 2 plugin of ImageJ | https://imagej.net/plugins/coloc-2 | ||
| CytKick Max Auto Sampler | invitrogen by Thermo Fisher Scientific | A42973 | |
| CytoFLEX Flow Cytometer | Beckman-Coulter | ||
| Electron Microscopy Sciences 16% Paraformaldehyde Aqueous Solution, EM Grade, 10 mL Ampoule | Fisher Scientific | 50-980-487 | |
| GraphPad Prism | statistical software | ||
| Nigericin (sodium salt) | Cayman Chemical | 11437 | |
| Nucleofector 2b | Lonza | Discontinued Product | |
| OP2 Liquid Handler | opentrons | OP2 | |
| poly-L-lysine, 0.1% (w/v) in H2O | Sigma Life Science | CAS:25988-63-0 | Pipetting robot for HTS assay |
| Thiazole Red (TO-PRO-3) | biotium | #40087 | We machined a custom acrylic plate stand so this brand of plate could be detected and used on our CytKick Max Auto Sampler |
| valinomycin | Cayman Chemical | 10009152 | Pipetting robot for HTS assay |
| For pH calibration | |||
| For pH calibration |
References
- Coley, A. F., Dodson, H. C., Morris, M. T., Morris, J. C. Glycolysis in the African trypanosome: Targeting enzymes and their subcellular compartments for therapeutic development. Molecular Biology International. 2011, 123702(2011).
- Mcconville, M. J., Saunders, E. C., Kloehn, J., Dagley, M. J. Leishmania carbon metabolism in the macrophage phagolysosome- feast or famine. F1000Res. 4, 938(2015).
- Parsons, M. Glycosomes: Parasites and the divergence of peroxisomal purpose. Molecular Microbiology. 53 (3), 717-724 (2004).
- Parsons, M., Furuya, T., Pal, S., Kessler, P. Biogenesis and function of peroxisomes and glycosomes. Molecular and Biochemical Parasitology. 115 (1), 19-28 (2001).
- Haanstra, J. R., Gonzalez-Marcano, E. B., Gualdron-Lopez, M., Michels, P. A. Biogenesis, maintenance and dynamics of glycosomes in trypanosomatid parasites. Biochimica et Biophysica Acta. 1863 (5), 1038-1048 (2016).
- Allmann, S., Bringaud, F. Glycosomes: A comprehensive view of their metabolic roles in t. Brucei. International Journal of Biochemistry and Cell Biology. 85, 85-90 (2017).
- Dodson, H. C., Morris, M. T., Morris, J. C. Glycerol 3-phosphate alters Trypanosoma brucei hexokinase activity in response to environmental change. The Journal of Biological Chemistry. 286 (38), 33150-33157 (2011).
- Lin, S., Morris, M. T., Ackroyd, P. C., Morris, J. C., Christensen, K. A. Peptide targeted delivery of pH sensor for quantitative measurements of intraglycosomal pH in live Trypanosoma brucei. Biochemistry. 52 (21), 3629-3637 (2013).
- Mahon, M. J. Phluorin2: An enhanced, ratiometric, pH-sensitive green florescent protein. Advances in Bioscience and Biotechnology. 2 (3), 132-137 (2011).
- Wirtz, E., Leal, S., Ochatt, C., Cross, G. A. A tightly regulated inducible expression system for conditional gene knock-outs and dominant-negative genetics in Trypanosoma brucei. Molecular and Biochemical Parasitology. 99 (1), 89-101 (1999).
- Restriction digest v.2. , Available from: https://www.protocols.io/view/restriction-digest-nkqdg33pg25z/v2 (2018).
- Ligation protocol with t4 DNA ligaase (m0202) v.3. , Available from: https://www.protocols.io/view/ligation-protocol-with-t4-dna-ligase-m0202-95qpvorzv4o1/v3 (2021).
- Burkard, G., Fragoso, C. M., Roditi, I. Highly efficient stable transformation of bloodstream forms of Trypanosoma brucei. Molecular and Biochemical Parasitology. 153 (2), 220-223 (2007).
- Crowe, L. P., Wilkinson, C. L., Nicholson, K. R., Morris, M. T. Trypanosoma brucei pex13.2 is an accessory peroxin that functions in the import of peroxisome targeting sequence type 2 proteins and localizes to subdomains of the glycosome. mSphere. 5 (1), e00744(2020).
- Kucejova, B., Kucej, M., Petrezselyova, S., Abelovska, L., Tomaska, L. A screen for nigericin-resistant yeast mutants revealed genes controlling mitochondrial volume and mitochondrial cation homeostasis. Genetics. 171 (2), 517-526 (2005).
- Huynh, M. H., Carruthers, V. B. Toxoplasma gondii excretion of glycolytic products is associated with acidification of the parasitophorous vacuole during parasite egress. PLoS Pathogens. 18 (5), e1010139(2022).
- Lehoux, S., Abe, J., Florian, J. A., Berk, B. C. 14-3-3 binding to Na+/H+ exchanger isoform-1 is associated with serum-dependent activation of Na+/H+ exchange. TheJournal of Biological Chemistry. 276 (19), 15794-15800 (2001).
- Jankowski, A., et al. In situ measurements of the ph of mammalian peroxisomes using the fluorescent protein phluorin. The Journal of Biological Chemistry. 276 (52), 48748-48753 (2001).
- Jankowski, A., Grinstein, S. A. A noninvasive fluorimetric procedure for measurement of membrane potential. Quantification of the NADPH oxidase-induced depolarization in activated neutrophils. The Journal of Biological Chemistry. 274 (37), 26098-26104 (1999).
- Zhang, J. H., Chung, T. D., Oldenburg, K. R. A simple statistical parameter for use in evaluation and validation of high throughput screening assays. Journal of Biomolecular Screening. 4 (2), 67-73 (1999).
- Miesenbock, G., De Angelis, D. A., Rothman, J. E. Visualizing secretion and synaptic transmission with pH-sensitive green fluorescent proteins. Nature. 394 (6689), 192-195 (1998).
- Lin, S., et al. Ph regulation in glycosomes of procyclic form Trypanosoma brucei. The Journal of Biological Chemistry. 292 (19), 7795-7805 (2017).
- Ha, D. S., Schwarz, J. K., Turco, S. J., Beverley, S. M. Use of the green fluorescent protein as a marker in transfected Leishmania. Molecular and Biochemical Parasitology. 77 (1), 57-64 (1996).
- Kelly, J. M., Ward, H. M., Miles, M. A., Kendall, G. A shuttle vector which facilitates the expression of transfected genes in Trypanosoma cruzi and Leishmania. Nucleic Acids Research. 20 (15), 3963-3969 (1992).
Reprints and Permissions
