The protocol describes an advanced microfluidic platform to quantitatively measure cytokine secretion dynamics of individual human peripheral blood mononuclear cells. The platform measures up to three cytokines in parallel (IL-6, TNFα, and IL-1β) for each individual cell stimulated with lipopolysaccharide as an example.
Method Article
Microfluidic Approach to Resolve Simultaneous and Sequential Cytokine Secretion of Individual Polyfunctional Cells
* These authors contributed equally
In This Article
Summary
Abstract
Infections, autoimmune diseases, desired and adverse immunological responses to treatment can lead to a complex and dynamic cytokine response in vivo. This response involves numerous immune cells secreting various cytokines to orchestrate the immune reaction. However, the secretion dynamics, amounts, and co-occurrence of the different cytokines by various cell subtypes remain poorly understood due to a lack of appropriate tools to study them. Here, we describe a protocol using a microfluidic droplet platform that allows the time-resolved quantitative measurement of secretion dynamics for several cytokines in parallel on the single-cell level. This is enabled by the encapsulation of individual cells into microfluidic droplets together with a multiplexed immunoassay for parallel quantification of cytokine concentrations, their immobilization for dynamic fluorescent imaging, and the analysis of the respective images to derive secreted quantities and dynamics. The protocol describes the preparation of functionalized magnetic nanoparticles, calibration experiments, cell preparation, and the encapsulation of the cells and nanoparticles into droplets for fluorescent imaging and subsequent image and data analysis using the example of lipopolysaccharide-stimulated human peripheral blood mononuclear cells. The presented platform identified distinct cytokine secretion behavior for single and co-secreting cells, characterizing the expected phenotypic heterogeneity in the measured cell sample. Furthermore, the modular nature of the assay allows its adaptation and application to study a variety of proteins, cytokines, and cell samples, potentially leading to a deeper understanding of the interplay between different immune cell types and the role of the different cytokines secreted dynamically to shape the tightly regulated immune response. These new insights could be particularly interesting in the studies of immune dysregulations or in identifying target populations in therapy and drug development.
Introduction
Infections often cause complex host reactions involving the innate and adaptive immune systems1,2. Upon infection or recognition of infectious agents, host cells can produce a diverse range of chemo- and cytokines, which are small proteins known as critical communicators and modulatory of the immune system3. Pro-inflammatory cytokines are released early upon infection to initiate the immune response, followed later on by anti-inflammatory cytokines, which are critical to prevent tissue damage and subsequent chronic or autoinflammatory diseases. This balance between threat elimination and tissue protection manifests as a wide repertoire of cytokines exerting different functions during the infection, allowing for a fine-tuning of the response4,5. Within this mixture, unique signatures can be observed depending on the pathogen and the signals they induce, the tissue location, and the immune cells from which they originate. However, cytokine release also appears to constitute a multi-functional biological process unique to each cell population, diverse in secretion dynamics and individual response. This heterogeneity has been described in the literature for many years, for instance, among T-cell subpopulations6,7, where investigations into autoinflammatory diseases and severe COVID-19 infections exhibited a large functional diversity of inflammatory markers within and in between patients8,9. Lately, the advent of single-cell sequencing highlighted the high plasticity and crosstalk between subpopulations within immune microenvironments that were not previously apparent, indicating that single-cell methods are necessary to capture this heterogeneity10,11. While novel methods are being developed to analyze the transcriptome, phenotypic analysis remains challenging, as this requires simultaneous, quantitative, and time-resolved measurements of protein secretion on a single-cell level. Such measurements allow us to investigate secreting cell identities, dynamics, and secretion patterns (slow/fast, early/late, simultaneous/sequential) for a repertoire or a panel of cytokines. By enabling the study of the dynamics of cytokine release during an immune response quantitatively and with temporal resolution, the resulting insights might allow for an understanding of the cellular ensemble and the induced response.
In standard protocols, cytokines are usually detected in the supernatant of cell suspensions and serum using enzyme-linked immunosorbent assay (ELISA), yielding bulk-secreted amounts. Bulk measurements do not allow for quantification of the cytokine amounts produced by each cell, a problem especially highlighted in heterogeneous cell samples. Alternative methods such as intracellular cytokine staining, enzyme-linked immunospot (ELISpot) assay or micro-engraved assays (e.g., Isoplexis) detect cytokines expressed by individual cells but provide endpoint measurements only12,13. This means that secretion dynamics and changes that might happen in the cellular secretion pattern over the incubation time are ignored. Additionally, endpoint measurements cannot differentiate between simultaneous and sequential cytokine secretion, so the true extent of simultaneous polyfunctionality of immune cells in cytokine secretion remains unclear using these methods.
Single-cell resolution can be achieved using droplet microfluidics to generate and process picoliter-sized physical compartments in order to study immune cells on their unique cytokine secretion phenotypes on the single-cell level14,15. These compartments consist of water-in-oil emulsions and can be generated using microfluidic chips16,17. Indeed, droplet-based microfluidic assays have demonstrated extreme versatility in enabling the analysis of different biological samples and repertoires on the single-cell level and their integration with upstream (cell and reagent processing) and downstream processes (single-cell sorting, proteomics or sequencing)18,19,20,21,22. In particular, setups that permit droplet immobilization allow for the measurement of a single-cell functionality over time, which is valuable for the analysis of protein secretion18. Furthermore, integrating multiplexed, quantitative assays facilitates additional investigations in previously inaccessible dimensions, into processes such as co-secretion and the identification of polyfunctional immune cells23,24.
In this protocol, we describe an immobilized droplet-based single-cell workflow to detect, quantify and temporally measure the secretion of up to three cytokines in parallel from individual cells17,23. The technology offers the ability to monitor cytokine responses from over 20,000 cells in parallel.
The presented workflow consists of the microfluidic encapsulation of single immune cells and functionalized nanoparticles into 60 pL water-in-oil droplets. The immobilization of >100,000 droplets in an observation chamber and time-resolved fluorescence microscopy allow for the measurement of cytokine secretion dynamics within each droplet and each cytokine (Figure 1A). For each individual cell within a droplet, the cytokine secretion is measured by a sandwich immunoassay, where magnetic nanoparticles functionalized with a specific capture antibody bind the secreted cytokine, leading to the subsequent relocation and binding of fluorescently labeled detection antibodies (Figure 1B,C). A beadline is formed by aligning the magnetic nanoparticles, to which fluorescence relocation can be quantified in the presence of cytokine. Here, fluorescence relocation is defined as the average fluorescence intensity found on the beadline divided by the average fluorescence intensity of the remaining droplet. This assay can be multiplexed for several cytokines by mixing differently functionalized nanoparticle batches and respective detection antibodies labeled in different fluorescence channels23, resulting in specific fluorescence relocations in the different channels. With the help of a customized analysis script, fluorescence relocation values can be extracted, and the images can be converted into secretion dynamic profiles for every individual cell and cytokine. Therefore, the resulting datasets yield numerous readouts, such as the quantitative secretion measurement over time, the identification of co-secreting subpopulations, and the distributions of the cells according to secreted amounts, rates, and combinations of cytokines.

Figure 1: Workflow and assay principle. (A) Overview of the workflow for analyzing cytokine-secreting cells after stimulation. Single-cell suspensions and magnetic nanoparticles are prepared and encapsulated into 60 pL in volume oil/water emulsions (droplets). Droplets are immobilized and nanoparticles aligned inside a magnetic field before measurement for up to 4 h every 30 min. Finally, images are analyzed, and the parameters for every droplet, timepoint and fluorescent channel are extracted. This figure has been modified from17. (B) Principle of the droplet sandwich bioassay. Functionalized nanoparticles bind the secreted cytokines, which leads to the subsequent relocation of fluorescently labeled detection antibodies to the nanoparticles. This relocation of fluorescence is quantified and validated with calibration experiments performed with recombinant cytokines. Mixing different functionalized nanoparticles allows the multiplexed measurements of up to three cytokines simultaneously. (C) In cell-based experiments, droplets are followed over the measurement time and secreting cells are identified by an overtime increase of fluorescence relocation onto the nanoparticles. Schematics are not up to scale. Figure created with BioRender.com. Please click here to view a larger version of this figure.
Protocol
All experiments were performed under ethics agreement EK202-N-56 and approved by ETH Zurich's ethics commission. Handling of human cells was performed in a laminar flow cabinet contained in a biosafety level 2 laboratory.
NOTE: The following sections detail the protocol to measure time-resolved cytokine secretion on a single-cell level. The procedure outlined here is applied to the stimulation of peripheral blood mononuclear cells (PBMC) with lipopolysaccharide (LPS) and the parallel measurement of the cytokines IL-6, TNFα and IL-1β. However, if required, the protocol can be adapted to other cell types, stimulants, and cytokines.
1. Observation chamber fabrication
NOTE: To avoid movement of the droplets during imaging, an observation chamber is prepared with a height that is around 10% smaller than the droplet diameter.
- Preparation of the cutting double-sided tape and top glass slide
- Draw or load the desired design of the chamber cutout in the Design tab of the cutting software. For the specific dimensions used here, see Figure 2E.
- Fix the double-sided adhesive tape of 32 µm thickness to the adhesive cutting mat using tape and place the cutting mat in the automatic cutting machine.
- Cut the chamber design out of the tape, while paying attention to cutting the long edges of the chamber in the same direction for easier detachment in step 1.3.
- Store the tape cutouts at room temperature for long-term storage. For short-term storage, store them at -20 °C and remove them only shortly before step 1.3. for easier handling.
- Drill two holes of around 1 mm diameter in the middle of one standard microscope slide (76 mm x 26 mm x 1 mm), with the distance between the two holes of around 3.5 cm.
- Cleaning and plasma activation of glass slides
- Clean one glass slide with holes and one without holes using soap. Rinse well with distilled water and dry using lint-free precision wipes.
- Place the glass slides in a plasma cleaner and plasma-treat the top surfaces at 55 W for 10 min. Remove the glass slides and proceed to step 1.3.
- Chamber assembly
- Place the glass slide with holes on a clean surface with the plasma-activated side facing upwards, without touching the activated surface.
- Remove the protective layer from one side of the double-sided adhesive tape, in the same direction of cutting. Without touching align the tape cutout with the edges of the glass slide and the drilled holes, and slowly put the tape in contact with the glass slide starting from the short edge.
NOTE: Pay attention not to generate any stretches or folds in the tape since this will result in incorrect chamber heights. Since this step is error prone and needs some practical experience, it is advisable to prepare several glass slides in parallel. - Remove the second protective layer from the tape, again in the direction of cutting, and place the second glass slide without holes with the activated surface facing downwards. Press the whole surface of the two glass slides together by placing a flat board on top and pressing down with upper body strength for about 10 s.
- After assembling the two glass slides, flip the chamber so that the two holes are facing you. Glue the nanoports to the two holes by putting a small amount of UV-curable glue in the ring below the port and placing the port on top of the hole in the glass slide. Add a ring of UV curable glue around the port and cure the glue with a UV lamp. The chamber should now look as depicted in Figure 2E. Proceed immediately to step 1.4.
NOTE: UV light can damage the eyes and skin. Wear appropriate protective equipment.
- Fluorophilic coating of the chamber surface
NOTE: This step should take place within 1 h after plasma treatment of the glass slides (step 1.2.2) to ensure good coating efficiency.- Freshly prepare 1 mL of 1% fluorosilane solution (1H,1H,2H,2H-perfluorodecyltrichlorosilane) in fluorinated oil (HFE-7500) and fill it in a syringe. Push the coating solution through a PTFE syringe filter and a 27G x 0.75 inch needle connected to 0.3 mm x 0.76 mm PTFE microtubing, into the observation chamber.
- After 1 min incubation, flush the coating solution out of the chamber using nitrogen pressure under a fume hood. Rinse the chamber with fluorinated oil (HFE-7500 only) using another syringe assembly.
- Store the chamber filled with fluorinated oil with closed inlets at room temperature (RT). After each experiment, wash out cells and droplets directly to ensure good preservation of the coating.
NOTE: The protocol can be paused here, and the chambers can be stored and reused for several months.
- Chamber holder with magnets
- For alignment of the magnetic nanoparticles, apply a static magnetic field to the observation chamber during droplet encapsulation and imaging. For this, place the chamber in a custom 3D-printed microscopy holder (see Figure 2D, and the file found in Bounab et al.17 Supplementary Data 4) that holds two neodymium magnets along the long sides of the chamber.
2. Nanoparticle functionalization
NOTE: The process for the nanoparticle functionalization is similar for each cytokine, the only difference being the addition of cytokine-specific capture antibodies. The functionalization for each cytokine is performed in different, individual reaction tubes in parallel. Prior to this protocol, the TNFα capture antibody and IL-1β detection antibody were labeled in-house with biotin and Alexa Fluor 647, respectively. Conjugation was performed according to the manufacturer's protocol found on the vendor's website (see links in Table of Materials) and the antibodies were aliquoted and stored at -20 °C.
- Add 50 µL of streptavidin-functionalized nanoparticles (diameter (Ø) 300 nm) into the tube destined for TNFα detection, 50 µL for IL-1β, and 100 µL for IL-6. Dilute the nanoparticle solution 1:1 (v/v) in phosphate-buffered saline (PBS).
- Add to each tube 1/20 (v/v) of the respective volume of the biotinylated capture antibodies (stock concentrations at 0.5 mg/mL) and incubate for 30 min at RT.
NOTE: When adding small volumes to the nanoparticle solution, deposit the volume at the top of the tube and wash it down multiple times with the bulk of the solution. This ensures proper mixing and prevents the formation of aggregates. - Add 1/100 (v/v) of 1 mM D-biotin solution to the tube and incubate for 5 min at RT. This results in a final biotin concentration of 10 µM.
NOTE: Excess biotin blocks free binding sides on the nanoparticles and reduces unwanted aggregate formation. - Collect the particles by holding a neodymium magnet close to the tube. Wait until the supernatant is clear and discard the supernatant.
NOTE: The magnets used throughout the assay exhibit very strong attractive forces, which can cause physical harm if two magnets snap together accidentally. - To reduce non-specific adsorption to the nanoparticle surface, immediately resuspend the nanoparticles in 0.5x the final volume of step 2.1 of Pluronic F-127 (10%) and 0.5x the volume PBS. Incubate the solution for 30 min at RT.
- Collect the particles using the magnet, discard the supernatant, and resuspend in 1x the volume of storage buffer (RPMI 1640, 5% knockout serum replacement, 1% Pen/Strep, 1% recombinant human serum albumin (HSA), 25 mM HEPES, 0.1% Pluronic F-127). Incubate the solution for 30 min at RT.
NOTE: The protocol can be paused here, and the particles can now be stored for up to 1 week at 4 °C. - Immediately before encapsulation, resuspend the particles by pipetting and mix the conjugated nanoparticles at a ratio of 2:1:1 (v/v) for IL-6:TNFα:IL-1β, respectively.
NOTE: The different ratios of functionalized nanoparticles depend on the used antibody pair for each cytokine and have been determined experimentally through calibration samples to obtain an optimal dynamic range. - Wash with complete media (RPMI 1640, 10% FBS, 1% Pen/Strep, 25 mM HEPES) by collecting the particles with the magnet, discarding the supernatant and resuspending. Repeat this step but resuspend only in 0.5x the volume of complete media from step 2.7.
- Add the differently labeled IL-6, TNFα, and IL-1β detection antibodies to the solution to reach a final concentration of 10 nM each. The solution is now ready to be used for the droplet experiments.
3. Cell preparation
NOTE: PBMC were isolated from a buffy coat received from the Zürich blood bank. The cells were frozen and stored in cryovials (1 x 10⁷ cells/vial) in liquid nitrogen for several months.
- Cell thawing
- At 1 h before starting the experiment, leave the complete media and MACS buffer (2 mM EDTA, 0.5% BSA in DPBS, sterile filtered) to warm up at RT. Prepare the tube containing the cells by adding 9 mL of complete media into a 15 mL tube and keeping it in the water bath at 37 °C.
- Retrieve a PBMC cryovial (containing ~1 x 10⁷ cells) from its storage in liquid nitrogen. Swirl the cryotube in the water bath at 37 °C until only a small amount of ice remains.
- Wipe the tube with 70% EtOH and transfer it to the laminar flow cabinet. Add 1 mL of pre-warmed complete media to the cryovial, mix gently and transfer all the cells into the tube containing warm complete media. The cryovial can be washed with 1 mL of warm complete media to recover the maximum number of cells.
- Spin the cells at 500 x g for 5 min at RT, discard the supernatant and resuspend gently with a pipette the cell pellet with 1 mL of complete media. Add 9 mL of complete media.
- Spin the cells at 500 x g for 5 min at RT. Discard the supernatant and resuspend as previously into 1 mL of complete media.
- Count the cells using the available cell counter. In this case, an automated cell counter was used. Cells were counted by mixing 10 µL of cell suspension with 10 µL of Trypan blue and transferring 10 µL of the mixture into the cell counting slide.
- Staining and FcR blocking
- Calculate the total number of cells and the volume needed to resuspend the cells at 2 x 10⁶ living cells/mL. Prepare the cell staining solution (CellTrace Violet) by diluting the stock (5mM) 1000x in PBS (working concentration of 5 µM).
- Spin the cells at 500 x g for 5 min at RT. Discard the supernatant and resuspend the cells in the calculated volume of cell staining solution prepared in step 3.2.1. Incubate the cells at 37 °C for 5 min.
- At the end of the incubation, quench the remaining dye in the solution by adding complete media (at least 2x the volume of dye solution). Spin the cells at 500 x g for 5 min at RT.
- Discard the supernatant, resuspend the cell pellet into 60 µL of MACS buffer and add 20 µL of human FcR block per 1 x 10⁷ cells. Incubate the cells for 10 min at RT.
- Fill the tube to 10 mL with MACS Buffer and spin the cells at 500 x g for 5 min at RT.
- Discard the supernatant and resuspend the cells in 1mL of complete media Count the cells as described in step 3.1.6.
- Cell stimulation with LPS
- Using the cell count, dilute the cells at 1 x 10⁶ cells/mL and transfer 2 mL of cells into each well in an ultra-low binding 6-well plate.
- Dilute LPS in complete media and add it into the well containing the cells for a final concentration of LPS of 1 µg/mL. Incubate the cells for 6 h at 37 °C.
- Preparation for encapsulation
- At the end of the stimulation time, transfer the cell suspension into a new 15 mL tube.
- Add 1 mL of complete media into the empty well. With a cell scraper, detach the remaining cells. Transfer the cells into a new 15 mL tube. Wash the well with 1 mL of complete media and transfer to another 15 mL tube.
- Spin the two tubes at 500 x g for 5 min at RT and transfer 1 mL of the undiluted supernatant solution (from the first tube containing the non-washed cells) to a new tube for further analysis if needed (e.g., ELISA).
- Discard the rest of the supernatants.
- Resuspend the pellets in 0.5 mL of complete media, combine the cells from the same well, and transfer them into a centrifuge tube. Count the cells as described in step 3.1.6.
- Spin the cells at 500 x g for 5 min at RT and discard most of the supernatant (leaving approximately 100 µL). Without resuspending the pellet, add very carefully 200 µL of complete media.
- Discard the supernatant. Resuspend the cells in complete media at a concentration of 6.6 to 13.3 x 10⁶ cells/mL to achieve an average cell number per droplet of λ = 0.2-0.4 for encapsulation, as defined in step 8.6.
NOTE: Steps 3.4.6 and 3.4.7 should be performed immediately before the encapsulation to avoid cytokine secretion into the supernatant. The number of cells per droplet follows a Poisson distribution: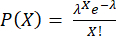 , where P shows the fraction of droplets containing X cells and λ is the mean number of cells per droplet.
4. Encapsulation and droplet production
NOTE: The encapsulation of cells in droplets is enabled by a microfluidic droplet generator chip, for which the fabrication is described in great detail elsewhere17. Alternatives are commercially available (see example in Table of Materials). A suitable droplet generator chip design has two inlets for aqueous phases, one inlet for the oil phase, and one outlet for the generated droplets. Furthermore, a suitable commercial droplet generator chip should enable the production of water in fluorinated oil droplets of 40-60 pL volume. The protocol described here results in water/oil emulsions (droplets) with a diameter of 50 µm. Using various options for altering the protocol can result in bigger or smaller droplets.
- Preparation of the syringe pump (Figure 2A)
- Fill a 1 mL syringe with 500 µL of continuous phase consisting of 2% 008-Fluorosurfactant in HFE-7500 fluorinated oil. Connect a 27G x 0.75 inch needle to 0.30 mm x 0.76 mm PTFE microtubing and mount the assembly on the syringe and subsequently onto the syringe pump.
NOTE: Ensure no air remains in the syringe or cannula as this prevents consistent flow rates. - Prepare two custom-made pipette tip connectors for the aqueous phases (Figure 2B): Punch a hole with a Ø0.75 mm biopsy punch into the middle of a ~5 mm high PDMS cutout with Ø6 mm. Pull ~3 cm of PTFE tubing (0.56 mm inner diameter, 1.07 mm outer diameter) through the hole in the PDMS cutout and push the assembly into the top of a 200 µL pipette tip. Connect the other side of the tube to a 23Gx 1.25 inch needle. Seal the connector by spreading UV-curable glue on top of the pipette and cure it with UV light.
NOTE: Since UV light is harmful to the eye, wear UV-blocking goggles for protection. - Fill two 1 mL syringes with 500 µL of light mineral oil, attach two 23G needles with the custom-made attachments, and mount both onto the syringe pump.
- Aspirate 30 µL of nanoparticle and 30 µL of cell solution into the pipette tips of the aqueous phases using the syringe pump control software.
- Prepare an observation chamber by cleaning the surface with water to remove dirt and dust and dry it with precision wipes. Clamp the chamber into the printed chamber holder equipped with two neodymium magnets.
NOTE: Make sure the magnets point in the right direction (attracting each other) to form an elongated aggregate. - Slightly angle the chamber (30°). Open both ports and plug a paper towel in the upper port to absorb the excess outer phase during filling.
- Fill a 1 mL syringe with 500 µL of continuous phase consisting of 2% 008-Fluorosurfactant in HFE-7500 fluorinated oil. Connect a 27G x 0.75 inch needle to 0.30 mm x 0.76 mm PTFE microtubing and mount the assembly on the syringe and subsequently onto the syringe pump.
- Droplet production and chamber filling
- Connect the continuous phase via tubing to the top inlet of the microfluidic chip (Figure 2A,C,F). Flush the chip for around 30 s with continuous phase using a flow rate of 1800 µL/h.
- Connect the pipette tips of the aqueous solutions to the two middle inlets (Figure 2A,C,F).
- Start the flow of the aqueous solution with 200 µL/h each and let the channels and the outlet be filled with liquid. When using magnetic nanoparticles, a homogenous, brown-red colored solution should flow out of the chip outlet.
- Once the liquid appears at the outlet, start the fluorinated oil phase flow at 800 µL/h and wait until a stable droplet production is established, confirmed by the outflow of a homogenous, grey, shiny solution at the outlet.
- Once a stable production of droplets is established, collect the produced droplets by connecting PTFE microtubing (0.3 mm inner diameter x 0.76 mm outer diameter) to the outlet port and direct them into an observation chamber by passing the microtubing through the ferrule module of a finger-tight one-piece fitting (Figure 2A).
- If proper droplet production occurs, a homogenous, shiny liquid should fill the chamber with a straight front from bottom to top.
- Once the chamber is filled, stop the flow and close off the ports with port plugs using finger-tight pressure.
NOTE: Pay attention to not close the chamber too tightly. Trapping or influx of air can lead to movements of the droplets and thus compromise tracking during the measurement. - After droplet production, flush the chip with fluorinated oil and blow out any reminders of fluid with nitrogen to preserve its function. Chips can be reused multiple times and stored for months as long as they are not clogged.

Figure 2: Overview of the microfluidic setup. (A) Setup for droplet encapsulation with the syringe pump, the droplet generation chip, and the observation chamber and microscope holder. (B) Picture of the punched PDMS plug (top) to form a connector to a 200 µL pipette tip (bottom), as described in protocol step 4.1.2. (C) Images of the connection of tubing ang pipette tips to the droplet generation chip. (D) Picture of the chamber placed inside the custom 3D-printed microscope holder with two magnets on top and bottom. (E) Photo of observation chamber (with white tape for illustration). (F) Layout of the microfluidic chip for droplet creation (scale bar: 750 µm). This figure has been modified from17. Please click here to view a larger version of this figure.
5. Image acquisition and measurement
NOTE: Image acquisition is performed on a standard inverted epi-fluorescence microscope enclosed in an incubator, allowing measurements at 37 °C. The here described settings are specific for a Nikon Eclipse Ti2 microscope running with the NIS Elements software (V. 5.30.04) equipped with an Orca Fusion camera but are generally adaptable to any other fluorescence microscopes and cameras.
- Setting measurement parameters
- To set the size of the image, select an array size of 10 x 10 images. This array will contain roughly 50,000-70,000 droplets. Use 1% overlap and activate blending for image stitching.
- To set the number of measured channels, select the DAPI channel for cell detection, FITC, TRITC, Cy5 channels for cytokine detection (beadlines) and the BF channel for droplet detection. Use pixel binning 2 x 2 and 16-bit for bit depth. Adapt the camera settings to achieve in-droplet intensity pixel values that do not reach the maximum of the camera for every fluorescence channel.
NOTE: Exact exposure times and lamp intensities for every channel depend on the used model and reagents and are established before generating calibration curves (step 7). Using the same acquisition settings in calibration and cell measurements is important for accurate quantification. - To set up the time-resolved measurement, select a measurement every 30 min for 9 measurements in total.
NOTE: Measurement parameters might differ for used cells, stimulants, reagents, measured cytokines, incubation temperature, and microscope models.
- Starting the measurement
- Mount the chamber holder onto the microscope with a well-plate format stage (Figure 2D) and switch to the brightfield (BF) channel using the 10x objective.
- Focus on the immobilized droplets in BF and ensure that the assembly is mounted in a perfect plane by panning around and adjusting if necessary. Move to the middle of the chamber for the subsequent steps.
- Activate the automated focusing system (PFS) and set it to the optimal measurement plane on the BF channel so that droplet edges appear as black, sharp circles that can be easily distinguished from the oil phase and background.
NOTE: Measurements are also possible without an automated focusing system, but if the microscope is equipped with one, we highly recommend using it. This improves the measurement quality for large and heavily stitched images. - Go through all the fluorescence channels and set the optimal measurement plane for each. For relocation measurements on the FITC, TRITC and Cy5 channels, ensure the nanoparticle aggregate is in perfect focus, for the DAPI channel, ensure the cells are in focus.
NOTE: Optimal focal planes and z-values might differ for all measured channels. Make sure to save individual PFS offsets for every channel. - Before starting the measurement, go through all channels to double-check the individual foci and wait 5 min to equilibrate since movement might occur initially while the solutions warm up.
- Start the measurement. After generating the first image, check for any irregularities (focus, moving droplets, wrong channels, etc.). Restart the acquisition if needed, or in the case of air, refill the chamber (start from step 4.1.4). Leave the assembly to image the droplets over 4 h.
6. Image analysis
- Install image analysis software (DropMap Analyzer App v 4.023) in MatLab (https://github.com/ESPCI-LCMD/MiMB) and transfer the generated .nd2 file from the experiment to an analysis computer.
- Open the application. Select the settings specified, otherwise leave the default value: CH1: DAPI, WD (whole droplet) selected; CH2: FITC, BL (beadline) selected; CH3: TRITC, BL selected; CH4: Cy5, BL selected; Max Drop Diameter (µm): 70; Drop Detection: Full; Tracking: Yes. Press on the Start button (fruit icon) to select the .nd2 file location and start the analysis.
- After a few minutes, the program will show an example section of the image (Figure 3A). Press Space until you find one suitable for droplet detection, then press Enter. In the same image section, draw a rectangle in a representative area for finding thresholding parameters to detect droplets.
- After a few minutes, another window will open showing the intensity distribution of the DAPI channel. Drag and drop the slider to detect only the signal from the stained cells and click Done in the upper right corner.
- After segmenting the image into single droplets with diameters smaller than Max. Drop Diameter (µm), the program will now perform the following steps for each droplet, timepoint, and fluorescence channel without further user input (see Figure 3).
- The software calculates the moved pixels of the droplet between time points (droplets moving more than 40 pixels are excluded automatically).
- The software measures the average fluorescence value of the whole droplet, detecting and measuring the mean beadline intensity by finding the brightest pixel on a horizontal line and averaging all pixel intensities on a vertical line from top to bottom of the droplet. This is done automatically and is used to calculate average beadline relocation values (Figure 3B) according to the equation:

- The software calculates the percentage of total pixels in the droplet area above the threshold set on the DAPI channel.
- The resulting .xslx file will contain the following columns of interest for further analysis: DropIdX (ID of the droplet tracked over time), TrueCentroid_ t*2-1 and t+2 (x and y coordinates, respectively, of the droplet center for timepoint t), DiameterMicrons (droplet diameter in µm), TrackingMove (number of pixels moved over the whole measurement time), FluoChannel_BL_Ratio_t (relocation value for FluoChannel at timepoint t), DAPI_WD_PosPxlCount_t (number of pixels above threshold in the whole droplet in the DAPI channel at timepoint t).
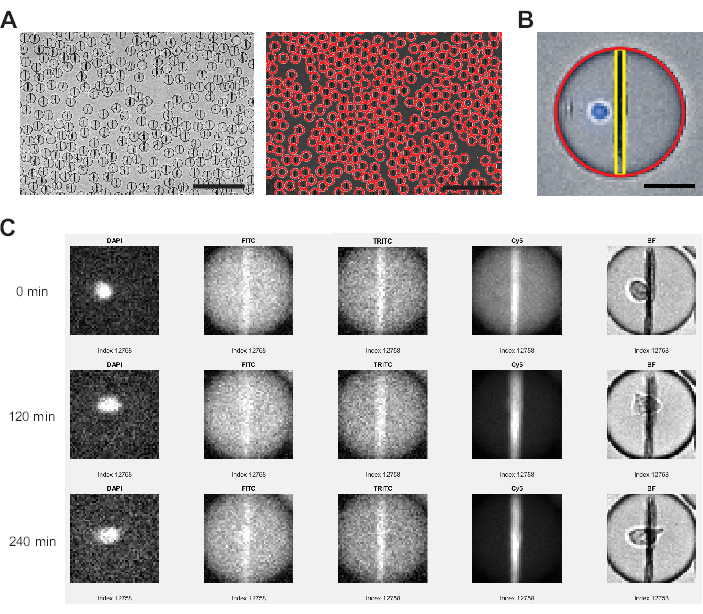
Figure 3: Image analysis performed by the image analysis software. (A) Droplets are detected in the brightfield (BF) channel using a Hough transformation, marking each droplet with a red circle. Scale bars: 200 µm. (B) Within each droplet, the nanoparticle beadline is identified through the brightest pixels in the horizontal plane and the fluorescence intensities averaged for all pixels spanning from top to bottom of the droplet. Additionally, the cell is identified through a pixel percentage >0 above threshold for the whole droplet area. Scale bar: 20 µm. (C) The analyzer software compares the fluorescence intensity on the nanoparticles to the droplet background for the FITC, TRITC and Cy5 channels over all the measured time points for every individual droplet. Shown are timepoints 0, 4 (120 min) and 9 (240 min). To manually check for correct droplet and cell detection, the DAPI and BF channels are displayed as well. Please click here to view a larger version of this figure.
7. Calibration
NOTE: For a quantitative readout, the calibration of cytokine concentrations to fluorescence relocation values needs to be performed once, as differences between different experimental setups can occur. All required steps are detailed in the previous protocol sections as referenced.
- Prepare nanoparticles as described in step 2.
- Reconstitute the human IL-6, TNFα and IL-1β recombinant proteins according to the manufacturer's instructions.
NOTE: Ensure that frozen aliquots are thawed only once and used promptly. - Prepare a 2-fold dilution series for all three proteins together using complete media (10% FBS, 1% Pen/Strep, 25 mM HEPES) with a starting concentration of 80 nM down to 0.625 nM.
- Perform the encapsulation as described in step 4 with functionalized nanoparticles in the first and RPMI only in the second aqueous phase. This measurement serves as the blank and the measured standard deviation is used for data analysis later.
- Wait 5 min and image the droplets as described in step 5. Take 3 images with an array size of 2 x 2 in the respective fluorescence channels.
- Repeat steps 7.4 and 7.5 with all prepared calibration solutions, starting with the lowest and ending with the highest concentration.
- Analyze the images as described in step 6. Do not use the WD option for the DAPI channel and set Tracking to No.
- The analysis outputs fluorescence relocation values for every measured droplet in one image. Extract the median and standard deviation for every fluorescence channel. Average the median and standard deviation for every measured image per concentration.
- Generate a calibration curve by plotting the averaged median relocation against the measured concentrations of each recombinant protein.
- Fit the curves using a one-phase association:
 ,
,
with Y = relocation at x, Y0 = relocation of blank measurement and x the used concentration. The obtained calibration curve is used to quantify relocation values as described in step 8.
NOTE: Only fit values up to the highest measured relocation and exclude values from higher concentrations with lower measured relocation. A decrease in measured relocation values at higher concentrations is expected and occurs due to the Hook effect and limited binding capacity of the nanoparticles.
8. Data analysis
- Exclude droplets with a TrackingMove value superior to 10, i.e. which moved more than 10 pixels over the time course of the measurement.
- Identify droplets containing stained cells (DAPI channel) in the first timepoint by sorting for droplets with values superior to 0 in the column DAPI_WD_PosPxlPercent_1.
- Identify droplets containing secreting cells by applying the following 3 criteria to the fluorescence relocation of every fluorescence channel (FluoChannel_BL_Ratio_t columns).
- Identifying droplets with increasing relocation values, by sorting for a positive slope over measurement time.
- Identifying droplets with relocation values reaching the limit of detection (LOD). A droplet is selected when the maximum fluorescence relocation over the measurement time is superior to the LOD, calculated as described elsewhere25:
 , where μRelocation t0 is the median of all the relocation values at timepoint 0 and σBLK the standard deviation of the blank measured during the calibration, each are cytokine specific.
 - Verifying that the increase in relocation value is significant by checking that the change between maximum and minimum measured fluorescence relocation over the measurement time is superior to:
 .
.
- Identify co-secreting cells by meeting the criteria described in step 8.3. for more than one fluorescence channel simultaneously.
- Repeat step 8.3. for all droplets containing no cell (DAPI_WD_PosPxlPercent_1 = 0). Use these droplets to calculate the false-positive percentage.
- Determine the accurate λ value of the measurement by randomly selecting 200 - 500 droplets and inspecting them with the Verify and sort function of the image analysis software. Count the number of cells in these droplets and calculate:
λ = number of counted cells / number of analyzed droplets - Calculate the total number of encapsulated cells for the measurement by:
Total cell count = λ × number of analyzed droplets - Calculate the percentage of secreting cells using the determined cell count. Additionally, calculate the false-positive percentage for every cytokine (usually less than 3%-5% relative to the number of real positives per channel) and use them as an internal control for experimental consistency and reproducibility.
- To calculate secreted cytokine concentrations, convert relocation values to concentration using the established calibration equations from step 7.10.
- Calculate secretion rate (SR) between time points by using the following equation.

- Calculate the average secretion rate over the measurement by averaging the individual secretion rates between time points. If the maximum measurable relocation was reached before the end of the measurement, set the concentration to the maximum measurable concentration (this value is cytokine-specific and corresponds to the maximum concentration measured and used in the calibration curve in step 6.10), and do not calculate further concentration. Calculate the secretion rate and average only up to this time point.
NOTE: If less than 50 secreting cells are detected in one fluorescence channel, the droplets should be examined visually through the verify and sort function and droplets having fluorescence or nanoparticle aggregates can be excluded from the analysis. - To extract further parameters from each single cell's secretion curve, perform a least square fit to the time-concentration curve for each cell and cytokine using a custom Python script (available upon request). The fitted function is a sigmoidal curve following the formula described below (Fits with R2<0.95 are excluded from the following steps):

where C corresponds to the concentration plateau [nM], t50 to the shift of the half-maximum [s], and m to the Hill slope [min-1]. From these parameters, the following curve descriptors are extracted as described below.- Cmax [nM]: Maximum measured concentration.
![Time calculation equation: t_start[s] = t_50[s] - 2 * m; analysis of reaction kinetics.](/files/ftp_upload/66492/66492eq08.jpg "figure-protocol-10") : Time of secretion start, where the fit reaches 10% of C.
: Time of secretion start, where the fit reaches 10% of C. : secretion rate as the approximated linear slope of the curve between 10% and 90% of the time-concentration curve.
Results
The presented functional single-cell platform allowed the measurement of several parameters. First, and similar to standard techniques, the frequency of secreting cells is depicted at the end of the measurement (Figure 4A). Following the stimulation with 1 µg/mL of lipopolysaccharide (LPS) for 6 h of peripheral blood mononuclear cells (PBMC), 5.81% of the cells secreted IL-6 (n= 1270), 4.55% TNFα (n= 995) and 6.06% IL-1β (n= 1326).
To quantify the cytokine secretion, calibration curves were generated with known concentrations of recombinant cytokines (Figure 4B). These calibration curves allow the quantification of the in-droplet cytokine concentrations over time. Exemplarily, the average in-droplet IL-6 concentration reached a plateau after 90 min for LPS-stimulated PBMC, whereas the average in-droplet IL-1β increased more rapidly from 90 min, displaying the dynamic resolution of the platform and the possibility to extract cell subpopulations secreting specific cytokines (Figure 4C). As the concentration changes between measurement points, calculating dynamic secretion rates per cytokine is possible. Considering the average secretion rate for each cytokine (Figure 4D), IL-6 secreting cells exhibited a constant decrease in average secretion rate, while TNFα and IL-1β secreting cells both showed an increase in secretion rate after 90 min measurement time and a second decrease after 150 min.
Furthermore, it is possible to cluster cells into subpopulations depending on the secreted and co-secreted cytokines (Figure 4E). Here, IL-6 and TNFα are single-secreted by 30.2% and 26.4% of the cells secreting IL-6 or TNFα, respectively, whereas single-secreting IL-1β cells made up 68.8% of all IL-1β secreting cells. Additionally, the effects of co-secretion on secreted concentrations and secretion rates can be resolved (Figure 4F). By looking at IL-6-secreting cells, different amounts of IL-6 were secreted if the cells additionally produced TNFα or IL-1β. Similarly, the distribution of averaged secretion rates over the measurement statistically differed between the cells secreting only IL-6 or IL-6 alongside TNFα (higher secretion rates) and IL-1β (lower IL-6 secretion rates).
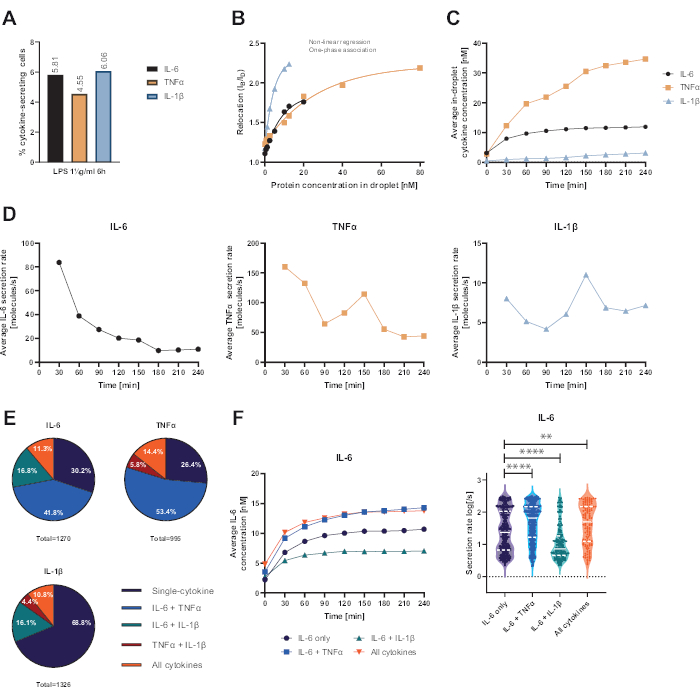
Figure 4: Representative results of IL-6, TNFα and IL-1β secreting PBMC after 6 h stimulation with 1 µg/mL LPS. (A) Percentage of PBMC secreting IL-6, TNFα and IL-1β at the end of the 4 h measurement. (B) Multiplexed cytokine calibration curves are generated with known concentrations of recombinant cytokines. This allows the quantification of cell experiments by computing from the relocation value the cytokine concentration within the droplet. Points were fitted using a non-linear one-phase association curve fit, r2=0.9926 (IL-6), 0.9901 (TNFα), 0.9990 (IL-1β). (C) Average secreted concentrations of IL-6, TNFα and IL-1β released by secreting PBMC over the 4 h measurement time. (D) Average secretion rates of IL-6, TNFα and IL-1β over the 4 h measurement time. (E) Relative percentage of co-secreting cells secreting IL-6, TNFα or IL-1β and combinations thereof. Normalized to all of the secreting cells detected for each cytokine. (F) Averaged IL-6 concentrations over the measurement time and average secretion rate (log) distributions for IL-6 secreting cells with co-secretion resolution (n=383 for IL-6 only, n=531 for IL-6 + TNFα, n= 213 for IL-6 + IL-1β and n=143 for IL-6+TNFα+IL-1β). Statistical differences in secretion rate distributions were assessed using two-sided, unpaired, nonparametric Kolmogorov-Smirnov tests with 95% confidence, the p-value are represented. ** (p <0.002) and **** (p <0.0001). The full line represents the median and the dotted line the quartiles. ntotal cells = 21 866. Please click here to view a larger version of this figure.
To extract additional information on the single-cell level, a sigmoid function can be fitted to the concentration-time points of each cell and cytokine (Figure 5). An exemplary concentration over time dataset for one cell and the corresponding sigmoidal fit is depicted in Figure 5A. Here, the least squares fitting procedure yields the following parameters: C, corresponding to the upper plateau value of the curve, t50 quantifying the time-wise shift of the curve from zero, and the Hill slope m, describing the steepness of the rising part of the sigmoid curve with 10% and 90% concentration values reached throughout the measurement. From these fit parameters, some curve descriptors can be extracted as explained in step 7.12. yielding the Cmax, the highest concentration value of the data, tstart, the start time of secretion, defined as reaching 10% of the upper plateau concentration value, and SRlin, the secretion rate during the rising part of the curve.
To classify cell subpopulations, the curve descriptors obtained from all single-cell fits were classified into three categories each: Cmax values were grouped into low, medium, and high for tstart into early, medium, and late an SRlin into slow, medium and fast secretors. To illustrate this classification, four exemplary single-cell secretion curves and their corresponding curve descriptors are shown (Figure 5A-D), where curve A exhibits the characteristics of an early low secretor of medium rate, curve B is an early, slow, and high secretor, curve C an early fast high secretor, and curve D shows late low secretion. It is important to note that the cutoffs for these criteria are cell-, cytokine-, and assay parameter-specific, and need to be adapted for each research question. Furthermore, only IL-6 secretion of PBMC after 1 µg/mL LPS stimulation for 6 h was considered here, meaning that most cells were early and high secretors with 80% and 79%, respectively (Figure 5E-F). Regarding the secretion rate, a bipolar response was observed with 55% of IL-6 secreting cells are slow secretors and 39% as fast secretors (Figure 5G).
To further characterize secretion behavior, the curve descriptors for each cell were plotted against each other and different clusters were extracted (Figure 5H-J). No clear correlation is given between tstart and Cmax (Figure 5H): the two largest populations were early low secretors and high secretors independent of secretion start. Considering the relation between tstart and SRlin (Figure 5I), most cells were early slow secretors with a clear population of early high secretors and few slow/medium to late secretors. Regarding SRlin and Cmax (Figure 5J) correlations, almost no fast low to medium secretors were present, with only a bigger population of fast low secretors. Furthermore, there was a large population of fast secretors that did not depend on the maximal measured concentration, and two populations of high secretors secreted either slow or fast. In summary, it can be concluded that investigating the relationship between the curve descriptors for individual cells yields a much more detailed analysis and can potentially extract new biological findings from single-cell secretion measurements.
With the analysis introduced above, we extracted the secretion dynamics of co-secreting cells (Figure 6). Two example curves show different dynamics of co-secretion for IL-6 and TNFα from two single cells with a simultaneous start of both cytokines (Figure 6A), or a sequential secretion start, with IL-6 being secreted first (Figure 6B). To classify all co-secreting cells, a secretion delay of 60 min was defined, where all cells starting secretion within this range are considered simultaneous secretors and all cells with longer delays are considered sequential secretors. This analysis also allowed the possibility to observe which cytokine was secreted first. For IL-6 and TNFα, mainly simultaneous co-secretion was observed in 76% of the cells (Figure 6C), while for IL-6 and IL-1β, sequential co-secretion was observed in 86% of the cells with IL-6 being the first cytokine to be secreted in most cases (Figure 6D).
Looking at the starting time of secretion for the different cytokines for all individual co-secreting cells, no clear correlation between secretion starting times was observed in the performed experiments. For IL-6 and TNFα co-secretion (Figure 6E), a larger vertical cluster around 0 min was present, corresponding to the co-secreting cells more prevalently starting with IL-6. For IL-6 and IL-1β co-secretion (Figure 6F), most cells started secreting IL-6 around the start of the measurement, while IL-1β was mainly secreted later. In summary, the analysis presented here enabled the identification of different secretor sub-populations and complex cytokine co-secretion dynamics.
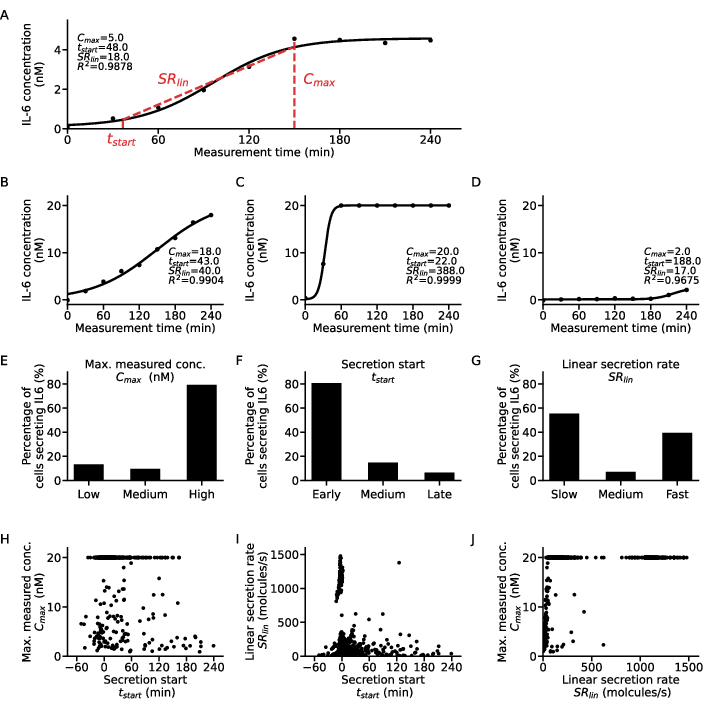
Figure 5: Detailed analysis of different secretion dynamic patterns for single IL-6 secreting cells curves. (A) Representative single-cell cytokine concentration data over measurement time with the fitted sigmoid curve and the extracted parameters. (B-D) Three exemplary single-cell cytokine concentration curves for the different cytokine secretor types found for IL-6 secretion after LPS stimulation. (E-G) Percentages of IL-6 secreting cells that are classified into the different secretor types with the following criteria (n=633): E. Cmax: low <5 nM, high >19.5 nM, F. tstart: early <30 min, late >120min, G. SRlin: slow <250 molecules/s, fast >750 molecules/s. (H-J) Relation between the three secretion curve descriptors Cmax, tstart and SRlin for each individual cell (n=633). The large population at Cmax=20nM results from reaching the upper detection limit of the assay. Please click here to view a larger version of this figure.

Figure 6: Extraction of co-secretion patterns from single-cell concentration curves. (A-B) Representative concentration curves for single cells co-secreting IL-6 and TNFα (A) simultaneously and (B) sequentially, respectively. (C-D) Percentage of cells exhibiting simultaneous and sequential co-secretion of IL-6 and TNFα (n=249), or IL-6 and IL-1β (n=72), respectively. Sequential secretion is defined through the delay between cytokine secretion starts of more than 60 min. Colors indicate which of the cytokines started secretion first. (E-F) Relation between the secretion start times for the different cytokines for each secreting cell (nIL6-TNFα=249, nIL6-IL1β=72). Please click here to view a larger version of this figure.
Discussion
Cytokine release and secretion are frequently investigated in immunology and clinical medicine3. Unbalanced cytokine secretion can lead to detrimental effects for patients suffering from infections but also in neurological disease, inflammation, or cancer26,27,28. Even though their importance in health and disease is well established, studying cytokines and their secreting cells remains challenging as the current methodologies are not capable of accurately detecting and quantifying cytokines originating from a single cell in a time-resolved manner. For the workflow presented here, an established stimulation protocol with PBMC was used and their secretion of IL-6, TNF-α and IL-1β was measured. The choice of using PBMCs instead of individual, purified subpopulations stemmed from the previous application to investigate cytokine release syndromes (CRS)23, a condition characterized by highly elevated plasma concentrations of pro-inflammatory cytokines, including IL-6, TNF-α and IL-1β29. As CRS is usually not only linked to one population, we used PBMCs as they would be present in vivo. However, cellular subpopulations can be purified and assessed individually, if the scientific question demands this step. The incubation time, stimulation conditions and dynamic assay ranges were optimized to measure secretion for the three cytokines of interest. The workflow and data presented here demonstrate how to set up, calibrate, quantify, measure, and analyze time-resolved single-cell secretion of multiple cytokines. This protocol provides a blueprint on how multi-functional analysis of cytokine secretion could enable the large functional and dynamic diversity of the cytokine secreted in patients.
Several crucial aspects of the described assay protocol enable a unique biological readout. First, single-cell encapsulation in microfluidic droplets allowed the extraction of data for each individual cell. Events of multiple cell encapsulations can be detected and sorted in or out by image analysis, depending on the research question. Second, the inclusion of several independent in-droplet fluorescent immunoassays and the alignment of the functionalized nanoparticles allowed for the quantitative measurement of up to three cytokine concentrations in parallel. This multiplexing enabled the analysis of cytokine co-secretion patterns on a single-cell level. Third, immobilization of the droplets permitted the time-wise measurement and correlation of cytokine secretion for each secreting cell and allowed to distinguish co-occurrent from sequential secretion. The time resolution uniquely provided data on secretion patterns and subpopulations of different secretor types. Finally, parallelized image analysis enabled the efficient extraction and tracking of large amounts of data from measurements with over 20,000 individual cells. The extraction from single secretion curves further permitted the discovery of phenotypic subpopulations and functionalities.
Next to its unique readout, the assay also has technical advantages over standard cytokine analysis. Thanks to the small size of the encapsulation compartments of around 60 pL, absolute amounts of secreted cytokines can be detected directly from the biological source with detection limits fitting cell secretion. The assay miniaturization also uses smaller quantities of expensive bio-reagents. Furthermore, the setup requires very little specialized equipment, which is often already available in biology and bioengineering laboratories. Fluorescence microscopes are broadly available, and syringe pumps are frequently used in bioengineering laboratories or can be purchased at a relatively low cost. If a cell culture is present, the cost for the full equipment needed to run the experiments is around 148,000 Euros, with the majority contributed by the automated epifluorescent microscope (130,000 Euros). However, such an instrument can be often found in biological laboratories, and the rest of the cost is distributed to the syringe pump (13,000 Euros, but cheaper alternatives are available) and smaller equipment. The fabrication of the droplet chip and observation chamber is very well described17 and can be performed outside of a cleanroom environment with necessary infrastructure, such as ovens and plasma cleaners present in most bioengineering labs. Alternatively, different suppliers are available to supply interested laboratories with droplet generator chips. Due to the small volumes needed, the assay is cost-effective and simple to set up.
The ensure the highest degree of reproducibility, we identified some critical steps for the success of the protocol. A common problem for first-time users is droplet movement during the measurement. While the analysis software can track individual droplets to some degree, excessive movement leads to loss of single-cell resolution and inaccurate results. Movement can be avoided by using properly airtight measurement chambers, correct droplet size and chamber sizes, a short equilibration period before starting the measurement, and proper surfactant concentration. Another critical step is accurate focusing before starting the measurement. Improper focusing leads to significantly lowered fluorescence relocation values and the underestimation of the amount of secreted cytokine. Finally, depending on the question and protocol at hand, correct timing between the different steps is of utmost importance for reproducibility. Especially the waiting time between filling the chamber and starting the measurement should be consistent, otherwise the measurement window of the secreted cytokines might be missed.
Limitations of the presented technology include the restricted ability to further manipulate the cells after encapsulation. It is therefore currently not possible to add or remove stimulants, antibodies, or additional reagents. Additionally, since the cells are encapsulated in their isolated bioreactor, no interactions between cells (contact-based or paracrine signaling) can take place during the measurement. This limitation can be partially overcome with bulk incubations beforehand. Besides, enhanced autocrine effects from secreted cytokines are also possible and these effects cannot be quantified or excluded with certainty, as only antibody-detected secreted cytokines are measured. So, the isolated view on cytokine secretion must always be described in the context of the corresponding question and application. However, this limitation could also be used for the detailed study of encapsulated multiples, doublets, and triplets if of interest. This would provide an interesting setup useful to investigate cell-cell contact or paracrine-based questions. Lastly, also the dynamic range of the assay is limited and needs adaptation to the specific application. Here, we have adapted the dynamic range of the assay to the expected secreted amount of the measured cytokines.
To further advance the capabilities and applicability of the assay, several developments could be addressed in the future, in biological, technical and data analysis aspects. On the biological side, the measurement of additional cytokines, other secreted proteins, metabolic or cell surface markers could be integrated by adapting the assay. Furthermore, this assay could be integrated into a workflow alongside other cell-based assays to broaden the readouts (e.g., flow cytometry staining or sequencing). Additionally, the usability of the assay could be simplified, e.g., by creating an integrated microfluidic chip for droplet creation and observation, thereby potentially enabling a wider application outside bioengineering laboratories in a clinical setting. Regarding the data analysis, extraction and tracking of information from images could be extended by enhancing automation and using machine learning approaches, e.g., to detect the presence and position of the cell(s) and beadline in each droplet without fluorescent labeling. Doing so would open additional fluorescent channels that could be used for immunoassays, resulting in the measurement of even more cytokines in parallel.
The presented assay and the associated protocols and analysis can be applied for diverse potential use cases related to cytokine secretion dynamics. More specifically, the assay could potentially address fundamental immunological questions such as identifying cell-type and activation-specific cytokine-secretion profiles, polyfunctionality of cytokine-secreting cells, or the temporality and maintenance mechanisms of cytokine balances. Furthermore, in clinical applications, the platform might enable the unraveling of the role of cytokines during active or chronic inflammatory responses, as observed in COVID-1930, or provide a tool for stratifying patients and personalizing treatments based on unique signatures such as in autoinflammation31. In conclusion, quantitative time-resolved assessment of cytokine secretion from single cells is a much-needed method as it elucidates how a particular drug, infection, genetic alteration, or ex vivo stimulation induces a particular response.
Disclosures
Specific aspects such as the beadline measurements of cells have been patented.
Acknowledgements
This project was supported by grant #2021-349 of the Strategic Focus Area Personalized Health and Related Technologies (PHRT) of the ETH Domain (Swiss Federal Institutes of Technology), the European Research Council starting grant (grant #803,336), and the Swiss National Science Foundation (grant #310030_197619). Additionally, we thank Guilhem Chenon and Jean Baudry for their work and development of the initial DropMap analyzer.
Materials
| Name | Company | Catalog Number | Comments |
|---|---|---|---|
| 008-FluoroSurfactant | RAN Biotechnologies | 008-FluoroSurfactant-10G | |
| 2-Stream flow-focusing droplet maker, 30 µm nozzle, PFOS hydrophobic surface treatment | Wunderli chips | ||
| Alexa Fluor 647 NHS Ester | ThermoFisher | A20006 | https://www.thermofisher.com/ch/en/home/references/protocols/cell-and-tissue-analysis/labeling-chemistry-protocols/fluorescent-amine-reactive-alexa-fluor-dye-labeling-of-igm-antibodies.html |
| Anti-Human IL-1β (Monoclonal Mouse), AF647 labelled in-house | PeproTech | 500-M01B | |
| ARcare92524 double-sided adhesive tape | Adhesvies Reasearch | ARcare92524 | |
| Bio-Adembeads Streptavidin plus 300nm | Ademtech | Cat#03233 | |
| Biotinylated Goat Anti-Human IL-1β | PeproTech | 500-P21BGBT | |
| Bovine Serum Albumin (BSA) | Sigma-Aldrich | A3059 | |
| Cell Scraper | TPP | 99002 | |
| CellTrace Violet Cell Proliferation Kit | Invitrogen | C34557 | Cell staining solution |
| Chromafil Xtra PTFE-45/25 syringe filters | Macherey-Nagel | 729205 | |
| Costar 6-well Clear Flat Bottom Ultra-Low Attachment | Corning | 3471 | |
| Countess Cell Counting Chamber Slides | Invitrogen | C10283 | |
| D-Biotin | Fluorochem | M02926 | |
| DPBS, no calcium, no magnesium | Gibco | 14196-094 | |
| epT.I.P.S. Standard 2-200 µl | Eppendorf | 30000889 | |
| Ethylenediaminetetraacetic acid disodium salt solution | Sigma-Aldrich | 3690 | |
| EZ-LINK-NHS-PEG4-Biotin | ThermoFisher | A39259 | https://www.thermofisher.com/order/catalog/product/20217 |
| FcR Blocking Reagent, human | Miltenyi Biotec | 130-059-901 | |
| Fetal Bovine Serum | Gibco | 10270-106 | |
| Handy dish soap | Migros | 5.01002E+11 | |
| HEPES (1 M) | Gibco | 15630-080 | |
| HFE-7500 Oil 3M TM Novec | Fluorochem | B40045191 | |
| Idex F-120 Fingertight One-Piece Fitting, Standard Knurl, Natural PEEK, 1/16" OD Tubing, 10-32 Coned | Cole-Parmer | GZ-02014-15 | |
| IL-6 Monoclonal Antibody (MQ2-13A5 - Rat), FITC | ThermoFisher | 11-7069-81 | |
| IL-6 Monoclonal Antibody (MQ2-39C3), Biotin | ThermoFisher | 13-7068-85 | |
| KnockOut Serum Replacement | ThermoFisher | 10828-010 | |
| Loctite AA 3491 curable UV glue | Henkel AG & Co | 3491 | |
| Microscope slides (76x26x1mm, clear white) | Menzel Gläser | ||
| Mineral oil light | Sigma-Aldrich | 330779 | |
| NanoPort Assembly Headless, 10-32 Coned, for 1/16" OD | Idex | N-333 | |
| Neodymium block magnet | K&J Magnetics | BZX082 | |
| Omnifix-F Spritze, 1 ml, LS | Braun | 9161406V | |
| Penicillin-Streptomycin (10,000 U/mL) | Gibco | 15140-122 | |
| Phosphate buffered saline | Sigma-Aldrich | P4417 | |
| Pluronic F-127, 0.2 µm filtered (10% Solution in Water) | ThermoFisher | P6866 | |
| Precision wipes | Kimtech Science | 5511 | |
| PTFE microtubing 0.30 × 0.76 mm | FisherScientific | 1191-9445 | |
| PTFE microtubing 0.56 × 1.07 mm | FisherScientific | 1192-9445 | |
| Recombinant Human IL-1β | Peprotech | Cat#200-01B | |
| Recombinant Human IL-6 | Peprotech | Cat#200-06 | |
| Recombinant human serum albumine (HSA) | Sigma-Aldrich | A9731 | |
| Recombinant Human TNF-α | Peprotech | Cat#300-01A | |
| Reusable biopsy punch diameter 0.75 mm and 6 mm | Stiefel | 504529 and 504532 | |
| RPMI 1640 Medium, no phenol red | Gibco | 11835-030 | |
| Standard LPS, E. coli K12 | InvivoGen | tlrl-eklps | |
| Sterican needles 23 G for 0.56 mm diameter microtubing | FisherScientific | 15351547 | |
| Sterican needles 27 G for 0.30mm diameter microtubing | FisherScientific | 15341557 | |
| TNF alpha Monoclonal Antibody (MAb11), PE | ThermoFisher | 12-7349-81 | |
| TNF-alpha Monoclonal Antibody (MAb1), biotinylated in-house | ThermoFisher | 14-7348-85 | |
| Trypan Blue Stain (0.4%) for use with the Countess Automated Cell Counter | Invitrogen | T10282 | |
| Vacuum Filtration "rapid"-Filtermax | TPP | 99500 | |
| Devices | |||
| Cameo 4 automatic cutting machine | Silhouette | ||
| Cetoni Base 120 + 3x NEMESYS Low Pressure Syringe Pumps | Cetoni | NEM-B101-03 A | |
| Countess II Automated Cell Counter | ThermoFisher | ||
| Inverted Epi-fluorescence microscope Ti2 | Nikon | ECLIPSE Ti2-E, Ti2-E/B*1 | |
| OKO Lab Cage Incubator, dark panels | OKO Lab | ||
| ORCA-Fusion Digital CMOS camera | Hammatsu | C14440 | |
| SOLA Light Engine | Lumencor | sola 80-10247 |
References
- Chen, L., et al. Inflammatory responses and inflammation-associated diseases in organs. Oncotarget. 9 (6), 7204-7218 (2017).
- Cicchese, J. M., et al. Dynamic balance of pro- and anti-inflammatory signals controls disease and limits pathology. Immunol Rev. 285 (1), 147-167 (2018).
- Liu, C., et al. Cytokines: From clinical significance to quantification. Adv Sci. 8 (15), e2004433(2021).
- Rojas, J. M., Avia, M., Martín, V., Sevilla, N. IL-10: A multifunctional cytokine in viral infections. J Immunol Res. 2017, 6104054(2017).
- Kohanawa, Y. M. A regulatory effect of the balance between TNF-α and IL-6 in the granulomatous and inflammatory response to Rhodococcus aurantiacus infection in mice. J Immunol. 177 (1), 642-650 (2006).
- Geginat, J., et al. Plasticity of human CD4 T cell subsets. Front Immunol. 5, 630(2014).
- Sallusto, F. Heterogeneity of human CD4+ T cells against microbes. Ann Rev Immunol. 34 (1), 317-334 (2016).
- Chetaille Nézondet, A. L., Poubelle, P. E., Pelletier, M. The evaluation of cytokines to help establish diagnosis and guide treatment of autoinflammatory and autoimmune diseases. J Leukocyte Biol. 108 (2), 647-657 (2020).
- Sims, J. T., et al. Characterization of the cytokine storm reflects hyperinflammatory endothelial dysfunction in COVID-19. J Allergy Clin Immunol. 147 (1), 107-111 (2021).
- Yasen, A., et al. Single-cell RNA sequencing reveals the heterogeneity of infiltrating immune cell profiles in the hepatic cystic echinococcosis microenvironment. Infection and Immunity. 89 (12), (2021).
- Jiang, Y., et al. Single-cell RNA sequencing highlights intratumor heterogeneity and intercellular network featured in adamantinomatous craniopharyngioma. Sci Adv. 9 (15), (2023).
- Tanguay, S., Killion, J. J. Direct comparison of ELISPOT and ELISA-based assays for detection of individual cytokine-secreting cells. Lymphokine Cytokine Res. 13 (4), 259-263 (1994).
- Bucheli, O. T. M., Sigvaldadóttir, I., Eyer, K. Measuring single-cell protein secretion in immunology: Technologies, advances, and applications. Eur J Immunol. 51 (6), 1334-1347 (2021).
- Brower, K. K., et al. Double emulsion flow cytometry with high-throughput single droplet isolation and nucleic acid recovery. Lab Chip. 20 (12), 2062-2074 (2020).
- Brower, K. K., et al. Double emulsion picoreactors for high-throughput single-cell encapsulation and phenotyping via FACS. Anal Chem. 92 (19), 13262-13270 (2020).
- Luo, X., Chen, J. Y., Ataei, M., Lee, A. Microfluidic compartmentalization platforms for single cell analysis. Biosensors. 12 (2), 58(2022).
- Bounab, Y., et al. Dynamic single-cell phenotyping of immune cells using the microfluidic platform DropMap. Nat Protoc. 15 (9), 2920-2955 (2020).
- Eyer, K., et al. Single-cell deep phenotyping of IgG-secreting cells for high-resolution immune monitoring. Nat Biotechnol. 35 (10), 977-982 (2017).
- Gaa, R., et al. Versatile and rapid microfluidics-assisted antibody discovery. mAbs. 13 (1), 198130(2021).
- Gerard, A., et al. High-throughput single-cell activity-based screening and sequencing of antibodies using droplet microfluidics. Nat Biotechnol. 38 (6), 715-721 (2020).
- De Jonghe, J., et al. spinDrop: a droplet microfluidic platform to maximise single-cell sequencing information content. Nat Comm. 14 (1), 4788(2023).
- Wheeler, M. A., et al. Droplet-based forward genetic screening of astrocyte-microglia cross-talk. Science. 379 (6636), 1023-1030 (2023).
- Portmann, K., Linder, A., Oelgarth, N., Eyer, K. Single-cell deep phenotyping of cytokine release unmasks stimulation-specific biological signatures and distinct secretion dynamics. Cell Rep Meth. 3 (7), 100502(2023).
- Portmann, K., Linder, A., Eyer, K. Stimulation-induced cytokine polyfunctionality as a dynamic concept. eLife. 12, 89781(2023).
- Armbruster, D. A., Pry, T. Limit of blank, limit of detection and limit of quantitation. Clin Biochem Rev. 29, S49-S52 (2008).
- Yang, J., et al. New insight into neurological degeneration: Inflammatory cytokines and blood-brain barrier. Front Mol Neurosci. 15, 1013933(2022).
- Kim, P. S., Ahmed, R. Features of responding T cells in cancer and chronic infection. Curr Opin Immunol. 22 (2), 223-230 (2010).
- Becher, B., Spath, S., Goverman, J. Cytokine networks in neuroinflammation. Nat Rev Immunol. 17 (1), 49-59 (2017).
- Cosenza, M., Sacchi, S., Pozzi, S. Cytokine release syndrome associated with T-cell-based therapies for hematological malignancies: Pathophysiology, clinical presentation, and treatment. Int J Mol Sci. 22 (14), 7652(2021).
- Hu, B., Huang, S., Yin, L. The cytokine storm and COVID-19. J Med Virol. 93 (1), 250-256 (2021).
- Marcuzzi, A., et al. Autoinflammatory diseases and cytokine storms-Imbalances of innate and adaptative immunity. Int J Mol Sci. 22 (20), 11241(2021).
Reprints and Permissions
