Here, we present a protocol to generate melanoma patient-derived organoids by culturing disassociated cell suspensions from fresh melanoma tissues. These organoids faithfully recapitulate patient-specific tumors in vitro, offering an innovative approach to exploring tumor immunosuppressive mechanisms, drug screening, drug resistance mechanisms, and cancer surveillance approaches.
Method Article
Unveiling Therapeutic Opportunities with Melanoma Patient-derived Organoid Models
Opens in a new tab
In This Article
Summary
Loading...
$$\rightleftharpoonup{xx}$$
$$\longleftharp{xx}$$,
$$\longrightharp{xx}$$,
Abstract
Loading...
$$\rightleftharpoonup{xx}$$
$$\longleftharp{xx}$$,
$$\longrightharp{xx}$$,
With the development of immunotherapy, there is an ongoing need to develop models that can recapitulate the tumor microenvironment of native tumors. While traditional two- and three-dimensional models can offer insights into cancer development and progression, these lack crucial aspects that hinder a faithful mimic of native tumors. An alternative model that has gained a lot of attention is the patient-derived organoid. The development of these organoids recapitulates the complex intercellular communication, tumor microenvironment, and histoarchitecture of tumors. This paper describes the protocol for establishing melanoma patient-derived organoid (MPDO) models. To validate these models, we assessed the immune cell composition, including the expression levels of T-cell activation markers, to confirm the cellular heterogeneity of the organoids. Additionally, to describe the potential utility of MPDOs in cellular therapies, we evaluated the cytotoxic capabilities of treating the organoids with γδ T-cells. In conclusion, the MPDO models offer promising avenues for understanding tumor complexity, validating therapeutic strategies, and potentially advancing personalized treatment.
Introduction
Loading...
$$\rightleftharpoonup{xx}$$
$$\longleftharp{xx}$$,
$$\longrightharp{xx}$$,
Conventional 2-D cell culture models are essential tools in cancer research for studying cancer progression and therapy1. These models not only allow for controlled experimental conditions to investigate the molecular and cellular mechanisms underlying cancer development and progression but also provide cost-effective and relatively rapid experimental results. Their usage, however, is restricted due to the limited cellular diversity in the tumor microenvironment (TME), which cannot be recapitulated in a coplanar nature of mono-culture models2. Additionally, cell culture models offer an oversimplified environment compared to the human body3. Thus, to better understand cancer progression and develop effective treatments, researchers have turned to innovative models that aim to recapitulate the TME in nature closely. Consequently, maintaining fidelity to native tumors is paramount in these models. Given the intricate nature of cancer, any significant deviation from the original tumor could introduce unforeseen variables that might confound meaningful conclusions about tumor behavior.
While patient-derived xenografts (PDX) have emerged as a model system that allows for monitoring of tumor progression in vivo, some limitations question how well the developed tumor recapitulates human cancer biology4. For instance, melanoma TME contains tumor-infiltrating immune cells and stromal cells. When passaged as a xenograft, the non-cancer cells from the patient will be gradually lost, which can select adaptations that differ from those in patient tumors. While these limitations can be mitigated by performing limited passages of the PDX in vivo, the differences between the species can still pose a risk of genetic changes to the PDX that deviate from that of the native tumor5. Moreover, PDX models are typically established in immunocompromised mice to prevent rejection of human tissues. This limits the ability to study the role of the host immune system in cancer, especially in immunotherapeutic studies6. We and others have engrafted PDXs in "humanized" mice7,8. However, establishing PDX models in humanized mice is time-consuming and expensive. It can take several months to years to develop a single PDX model from a patient's tumor specimen, thus limiting the speed and scale of research. Despite these limitations, PDX models have been shown to accurately represent the biology of the TME, thus having been extensively used for the development of cancer therapeutics, personalized medicine, and immunotherapy, among others9.
An alternative 3D culture technique that has emerged is the patient-derived organoid (PDO), where a freshly resected patient tumor is cultured to create models that maintain phenotypic heterogeneity, histoarchitecture, and intercellular communications10. Its ability to closely resemble native tumors has been previously demonstrated where cultured organoids from non-muscle invasive (NMIBC) and muscle-invasive bladder cancer (MIBC) successfully recapitulated key aspects of the parental tumors11. Due to their potential and advantages over other models, PDOs offer a wide variety of tailored applications that other models lack, including but not limited to the study and development of immune checkpoint inhibitors along with cellular and targeted therapies. For example, we have previously used melanoma patient-derived organoids (MPDOs) to study the ability of tumor-infiltrating lymphocytes (TILs) to be expanded by IL-2 and anti-PD1 antibodies (αPD-1). Results showed that the TILs expanded by IL-2 and αPD-1 not only had a higher number but could also successfully infiltrate MPDOs and kill melanoma cells with higher efficiency than TILs expanded using other methods12. Other groups have shown similar results where the usage of anti-PD-1 and/or anti-PD-L1 leads to TILs remaining functional in PDOs, which subsequently leads to tumor killing13. Additionally, our group has also used MPDOs to assess γδ T-cell infiltration and killing ability14. PDOs' applicability spans a wide range of areas, including TIL expansion, cytotoxicity studies, and small molecule screening. All these applications highlight the potential and usability that this model confers. As such, we describe the detailed protocol for the culture of MPDOs.
Protocol
Loading...
$$\rightleftharpoonup{xx}$$
$$\longleftharp{xx}$$,
$$\longrightharp{xx}$$,
Human melanoma tissues were obtained from patients receiving treatment at the University of Pennsylvania using the tissue collection protocol (UPCC08607) that is approved by the Institutional Review Board of the University of Pennsylvania. All patients have signed informed consent. Following resection of the human melanoma tissues, the tumor tissue is placed in Dulbecco's Modified Eagle Medium (DMEM) and kept at 4 °C until processing (within 6 h). Melanoma patient-derived organoids (MPDOs) were derived from a fresh tumor as illustrated in Figure 1.
1. Isolation of cells from human melanoma tissue
- Preparations before the start of the procedure
NOTE: Two culture methods (Matrigel and collagen gel) can be used to culture dissociated melanoma tissue:- For the Matrigel method: Prepare a coating solution of Growth Factor Reduced (GFR) Basement Membrane Matrix by diluting GFR Basement Membrane Matrix with organoid culture medium (see Table 1) at a 1:2 ratio. Add approximately 115 µL of the thawed solution to each of several wells of a 48-well plate and leave it to solidify for 30 min at 37 °C in a humidified incubator.
- For the collagen gel method: Add 1 mL of Collagen gel (see Table 1) to a 30 mm inner membrane insert. Allow the gel to solidify for 30 min at 37 °C in a humidified incubator.
- Prepare the L-WRN conditioned medium15. L-WRN conditioned medium is produced from an L-WRN cell line engineered to secrete Wnt3a, R-spondin 3, and Noggin into a single conditioned medium that is widely used for cell culture.
- Thaw a cryotube of L-WRN cells in the 37 °C water bath. Add 5 mL of L-cell medium (see Table 1) and the L-WRN cell suspension to a 15 mL conical tube, and centrifuge at 120 × g for 5 min at 4 °C. Aspirate the supernatant, ensuring that ~500 µL is left at the bottom to resuspend the pellet of cells.
- Transfer the cell pellet in the supernatant into 30 mL of L-cell medium on ice and add 150 µL of hygromycin (500 µg/mL) and 300 µL of G418 (500 µg/mL). Seed the cells at a density of 3 × 10⁶ on a T-150 flask and incubate at 37 °C in a humidified incubator with 5% CO2 until ~90% confluent.
- Once the cells are ~90% confluent, split cells into five T-150 flasks by washing with 20 mL of phosphate-buffered saline (PBS), aspirating, and digesting with 3 mL of trypsin substitute. After 5 min, neutralize with 9 mL of L-cell medium followed by centrifugation for 5 min at 120 × g at 4 °C . When ~100% confluent, split the five T-150 flasks into 10 T-175 3-layer flasks.
- Once confluent, wash cells with 2 x 50 mL of PBS and then with 25 mL of washing medium (see Table 1).
- Add 75 mL of primary culture medium to each T-175 3-layer flask and incubate for 3 days at 37 °C in a humidified incubator with 5% CO2 (see Table 1).
- After 3 days, harvest the conditioned medium into a 50 mL conical and spin at 1,100 × g for 5 min at 4 °C. Collect the supernatant (conditioned medium), ensuring that 5 mL is left behind.
- Add fresh 75 mL of primary cell culture medium to each T-175 3-layer flask and incubate for an additional 3 days to collect additional conditioned medium.
- To the collected conditioned medium, add an equal volume of primary cell culture medium (50% volume) and vacuum filter the contents using a 0.22 µm filter. Store aliquots into 50 mL tubes and store at -20 °C for long-term usage or 4 °C for up to 2-3 weeks. Use this medium to supplement the organoid culture media (see Table 1).
NOTE: Thaw aliquots at 4 °C overnight prior to use.
- Harvesting the cellular mixture from fresh melanoma tissue
- Wash the freshly resected melanoma tissue in a 10 mL Petri dish containing washing medium. After the first rinse, use sterile tweezers to transfer the tumor into a second Petri dish for further washing and repeat this process 3x on ice to preserve tumor integrity and viability. Throughout these rinsing cycles, use sterile scissors and a blade to remove excess connective tissue, fat, and residual blood. After the three washes, place the tumor in an empty Petri dish and use sterile blades to finely mince it.
NOTE: After mincing, the tumor should exhibit a gel-like consistency. The finer the mincing of the tumor, the higher the cell yield will be. This is because larger clumps of the tumor will be more challenging to digest and may not pass through the 70 µm Nylon cell strainer in the subsequent step. - Once the tumor tissue has been thoroughly washed and minced, transfer it into a 50 mL conical tube containing 10 mL of the prepared digestion medium (see Table 1). Place the conical in a water bath at 37 °C, ensuring the contents are vortexed every 5 min.
- After 25 min, add 30 mL of the ADMEM/F12 medium containing 10% FBS to stop digestion.
NOTE: These specified quantities are intended for tumors weighing no more than 0.2 g. - Filter the digested cell suspension through a 70 µm Nylon cell strainer, then rinse the strainer with ADMEM/F12 (1x) Reduced Serum Medium (1:1) containing 10% FBS. Following the washing step, use a pipette to retrieve any remaining media on the bottom of the filter to ensure that the highest possible number of cells is retrieved. Then, centrifuge at 300 × g for 7 min at 4 °C. Discard the supernatant and resuspend the pellet in organoid culture medium (see Table 1).
- Culture the melanoma single-cell suspension in either Matrigel or collagen culture systems:
- Matrigel: Count the single-cell suspension to ensure that approximately 2 × 10⁵ cells are seeded in the prewarmed Matrigel-coated wells supplemented with 200 µL of organoid culture medium.
NOTE: Matrigel-based organoids are used to study pathophysiology, screen drug efficacy, and test drug toxicity16. - Collagen gel: Count the single-cell suspension to ensure that approximately 106 cells are mixed with 1 mL of collagen gel. Add the mixture to the pre-solidified collagen gel membrane inserts and place these in a 6-well plate. Add enough organoid culture medium to submerge the inserts containing the cells and collagen gel.
NOTE: Collagen gel organoids are used to measure T cell migration and study tissue development16.
- Matrigel: Count the single-cell suspension to ensure that approximately 2 × 10⁵ cells are seeded in the prewarmed Matrigel-coated wells supplemented with 200 µL of organoid culture medium.
- Allow the organoids to grow while ensuring that fresh medium is added every 3 days.
- Passage the organoids once they reach 150-200 µm in size or cryopreserve them until further usage.
- For passage of organoids, transfer the organoids into a 15 mL conical and wash with 1x DPSB. Centrifuge the mixture at 300 × g for 7 min at 4 °C. Remove the supernatant and add trypsin substitute (50-100 µL per organoid) for 10 min in a 37 °C water bath, ensuring that contents are vortexed every 3 min.
- Stop the digestion using ADMEM/F12 (1x) Reduced Serum Medium (1:1) medium containing 10% FBS. Centrifuge the mixture at 300 × g for 7 min and resuspend in organoid culture medium.
- Seed the single-cell suspension into a new Matrigel/Collagen-coated well at the same initial seeding density (2 × 10⁵ cells in 200 µL of organoid culture media for Matrigel-coated wells in a 48 well plate or 106 cells in 1 mL of organoid culture media for collagen coated 30 mm inner membrane insert).
- For cryopreservation, digest MPDOs using the trypsin substitute into single-cell suspensions followed by resuspension of 106 cells into 1 mL of freezing medium (see Table 1).
- Wash the freshly resected melanoma tissue in a 10 mL Petri dish containing washing medium. After the first rinse, use sterile tweezers to transfer the tumor into a second Petri dish for further washing and repeat this process 3x on ice to preserve tumor integrity and viability. Throughout these rinsing cycles, use sterile scissors and a blade to remove excess connective tissue, fat, and residual blood. After the three washes, place the tumor in an empty Petri dish and use sterile blades to finely mince it.
Results
Loading...
$$\rightleftharpoonup{xx}$$
$$\longleftharp{xx}$$,
$$\longrightharp{xx}$$,
The shape and size of the MPDOs were monitored over time to study their growth dynamics. As seen in Figure 2, during the initial growth period, the organoid size increased substantially throughout the 7 days depicted. Following the observation of MPDO growth dynamics, attention turned to evaluating the immune cell composition to verify the faithful recapitulation of organoids to the original tumors. This assessment, primarily focusing on αβ T cell abundance, provided insights into the resemblance between the organoids and the parental tumor. As seen, Figure 3 illustrates that there was no statistically significant distinction in αβ T cell proportion between the parental tumors and the respective organoids cultured in either Matrigel or collagen. Having shown similarities between parental tumors and organoids, next, we assessed the T cell activity using flow cytometry. The gating strategy can be found in Figure 4, which was obtained by defining single, live leukocytes followed by gating on the CD3+ and CD8+ T cell populations to examine common T cell activation markers.
Given the role of cytotoxic T cells in generating cytokines and releasing cytotoxic molecules such as granzyme B and perforin, their expression was measured. The expression of granzyme B and perforin was detected at 35.1% and 2.17%, respectively17. The expression of T-cell immunoglobin and mucin domain 3 (Tim3) in 1.83% of CD8+ T cells, aligns with the characteristic of the immunosuppressive TME18. The expression of programmed death receptor (PD-1) in 49.5% of the CD8+ population within the MPDOs further emphasizes the immunosuppressive nature of the organoid's microenvironment. Lastly, Kiel 67 (Ki67) expression, a marker for proliferation, was also assessed in CD8+ T cells at 26.8%19
MPDOs can also be used to assess the killing ability of γδ T-cells. Multiple 10-day-old MPDOs were treated with γδ T-cells. After 24 h of incubation, the MPDOs were collected and disassociated into a single-cell suspension and resuspended in 100 µL of binding buffer containing 5 µL of AV-FITC and 5 µL of PI. Upon incubation for 15 min in the dark at room temperature, flow cytometry was conducted to determine γδ T-cell-induced cytotoxicity on the cells in the MPDOs. As seen in Figure 5 A,B, upon treatment with γδ T-cells, more cells in the MPDOs showed features of apoptosis (80.5%). This is in comparison to the control experiment, where only a minority of cells showed features of apoptosis (19.2%).
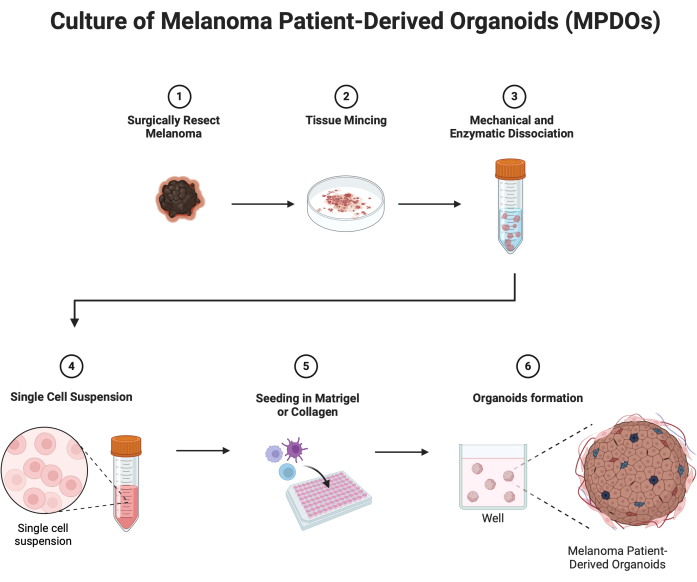
Figure 1: Schematic illustrating the culture of MPDOs. Excised fresh melanoma tissue is broken down mechanically and enzymatically to yield a single-cell suspension. This suspension is then cultured in wells coated with Matrigel or collagen gel to form organoids. Abbreviation: MPDO = melanoma patient-derived organoid. Please click here to view a larger version of this figure.
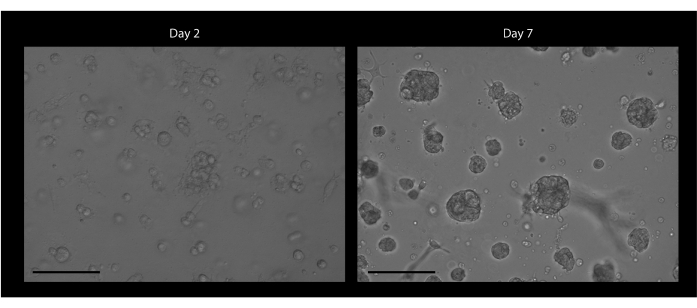
Figure 2: Confocal microscopy images of MPDOs inlaid in Matrigel on days 2 and 7. Single-cell suspension from fresh melanoma tissue is cultured in the Matrigel. Images were taken using a confocal microscope at day 2 and day 7. The size of organoids is gradually increasing. Scale bars = 100 µm. Abbreviation: MPDO = melanoma patient-derived organoid. Please click here to view a larger version of this figure.
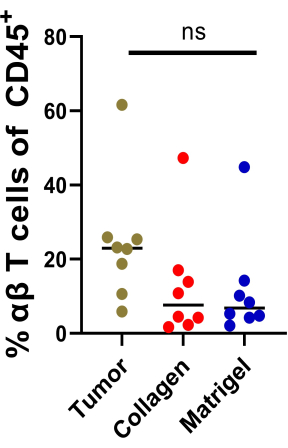
Figure 3: Flow cytometry analysis comparing αβ T cell composition in parental tumor vs organoids cultured in collagen gel or Matrigel. Quantification of immune cells in MPDOs was performed using FACS. Comparison of αβ T cells in parental tumors, MPDOs cultured in collagen gel or Matrigel after 7 days. n = 8; ns = no significance (nonparametric multiple test). Please click here to view a larger version of this figure.
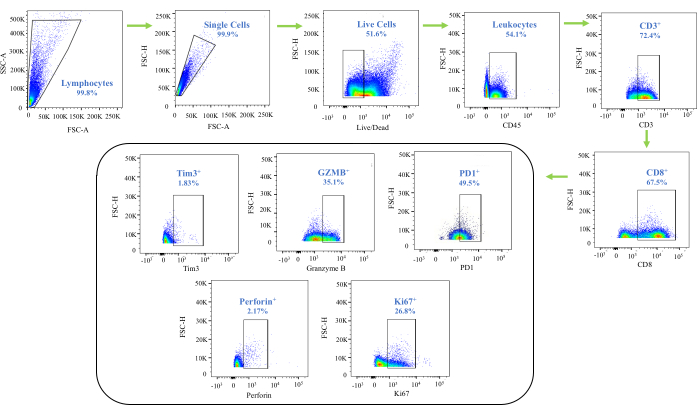
Figure 4: Flow cytometry gating strategy and analysis used to characterize immune cells in the day 10 MPDOs cultured in Matrigel. Gating strategy to discern immune cell subsets, followed by quantification and profile of the various markers expressed within the organoids. Abbreviations: MPDO = melanoma patient-derived organoid; FSC-A = forward scatter-peak height; FSC-H = forward scatter-peak height; SSC-A = side scatter-peak area. Please click here to view a larger version of this figure.
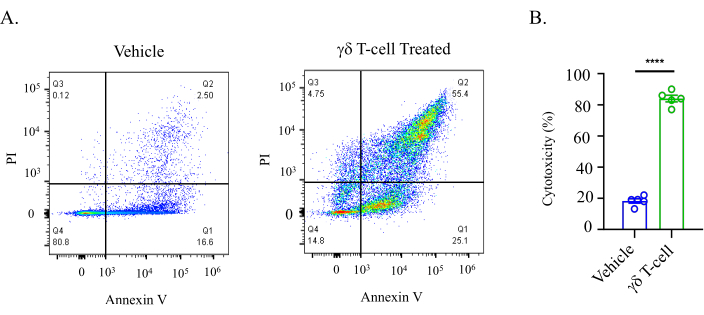
Figure 5: γδ T-cell treatment induces cell killing in MPDOs. MPDOs were incubated with γδ T-cells for 24 h, then the MPDOs were collected and disassociated into a single-cell suspension. (A) Annexin V and PI staining of organoids cultured in Matrigel after γδ T-cell treatment. Shift to necrosis upon treatment with γδ T-cell is evident. (B) Quantification of apoptotic cells in MPDOs after γδ T-cell treatment. n = 5 *p < 0.05; **p < 0.01 (nonparametric multiple test). Abbreviations: MPDO = melanoma patient-derived organoid; PI = propidium iodide. Please click here to view a larger version of this figure.
Table 1: Composition of all media and reagents used in this protocol. Please click here to download this Table.
Discussion
Loading...
$$\rightleftharpoonup{xx}$$
$$\longleftharp{xx}$$,
$$\longrightharp{xx}$$,
The emergence of PDOs has addressed multiple limitations posed by other previously established cancer research methods while introducing transformative potential applications in the field. This organoid technology was initially proposed in 2009 by Hans Clevers and colleagues, who were able to successfully establish an intestinal organoid culture system by culturing Lgr5+ stem cells derived from the intestine of mice in a 3D matrix gel containing R-sponsin, EGF, and Noggin factors20. A few years later, in 2020, Koehler's team reported an organoid culture model that enabled the generation of skin in vitro for the first time using only human PSCs21. In light of these remarkable advancements in organoid technology, the development of tumor organoid models quickly emerged, offering the potential to revolutionize cancer research and drug development.
Thus, this protocol focuses on elucidating the steps involved in deriving organoids from freshly resected human melanoma, contributing to the ongoing efforts to advance our understanding of cancer biology and improve drug development strategies. As such, the validation of the PDO's similarity to parental tumor has been a subject of exploration across multiple laboratories. Notably, Sun and colleagues conducted research using a comparable PDO methodology to model mucosal melanoma (MM), ultimately affirming that the organoids retained the histopathological characteristics of the original tumors. These included features such as chromosomal instability, along with the presence of melanoma and melanosome markers22. With the established retention of biology, numerous groups have also explored PDO's suitability to predict clinical responses to different drugs and novel therapeutic strategies. For instance, Vlachogiannis' group demonstrated that in metastatic gastrointestinal tumors, PDOs accurately predicted the drug responses which matched with the patient clinical outcome23. Similarly, Ganesh's group also generated a live biobank of organoids from patients with rectal cancer and concluded that the ex vivo responses to chemotherapy and radiation treatment correlated with the individual clinical responses from each patient24. Together, these studies suggest that PDOs can serve as faithful models for exploring tumor evolution and hold promise in advancing our understanding of cancer treatment responses.
PDOs show significant potential for research; however, the challenge lies in the invasive nature of acquiring tissue through surgical resection or core needle biopsies, which can be burdensome for patients. The tissue must then be mechanically or enzymatically dissociated which can disrupt native 3D growth architecture. To address this limitation, Fine Needle Aspiration (FNA) emerged as a clinically preferred, minimally invasive procedure that delicately extracts and separates tumor cells from the sclerotic stroma without the need for digestion or additional processing25. This approach preserves the native growth architecture of the tumor. Vilgelm and colleagues explored the efficiency of FNA as an organoid isolation procedure while studying the ability of the organoid to retain the biologic properties of parent tumors. Their findings concluded that tumor tissues isolated through FNA-PDO retained key histologic and immunophenotypic properties akin to those of the original tumor, suggesting the potential efficacy of this method in organoid isolation25.
PDOs represent a groundbreaking advancement with numerous potential applications. The ability to replicate patient-specific tumor environments opens doors to many critical research avenues. From drug screening to the discovery of resistance mechanisms to exploring the nuances of tumor heterogeneity and cancer surveillance approaches to exploring immune checkpoint inhibitors along with cellular and targeted therapies, the potential of this technology extends beyond its immediate applications.
Disclosures
Loading...
$$\rightleftharpoonup{xx}$$
$$\longleftharp{xx}$$,
$$\longrightharp{xx}$$,
The authors have no conflicts of interest to declare.
Acknowledgements
Loading...
$$\rightleftharpoonup{xx}$$
$$\longleftharp{xx}$$,
$$\longrightharp{xx}$$,
This study was funded in part by grants from the R01(CA258113), SPORE (CA261608), and P01 (CA114046). Figure 1 was prepared in BioRender.com.
Materials
| Name | Company | Catalog Number | Comments |
|---|---|---|---|
| 2 mL Red Cap Internal Threaded Polypropylene Cryogenic Vial | Corning | 431420 | |
| 50 mL Polypropylene Conical Tube | Corning | 352070 | |
| 100 mm TC-treated Cell Culture Dish | Corning | 353003 | |
| 105 mm Polystyrene Forceps Sterile | Caplugs Evergreen | 222-1121-B1I | |
| 150 cm2 Cell Culture Flask | Corning | CLS430825 | |
| A83-01 | Tocris | 2939 | |
| Advanced DMEM/F12 (1x) Reduced Serum Medium (1:1) | Gibco | 12634-010 | |
| B-27 Supplement (50x) | Gibco | 17504-044 | |
| Brilliant Violet 510 anti-human Perforin Antibody | BioLegend | 308120 | |
| Brilliant Violet 605 anti-human Ki-67 Antibody | BioLegend | 350522 | |
| Brilliant Violet 650 anti-human CD366 (Tim-3) Antibody | BioLegend | 345028 | |
| Brilliant Violet 711 anti-human CD45 Antibody | BioLegend | 304050 | |
| Cell Culture Inserts 0.4 µm, 30 mm Diameter | Millipore Sigma | PIHP03050 | |
| Cell Staining Buffer | BioLegend | 420201 | |
| Cell Strainer 40 µm Nylon | Corning | 352340 | |
| Cell Strainer 70 µm Nylon | Corning | 352350 | |
| Collagenase, Type IV, powder | Gibco | 17104019 | |
| Cultrex Rat Collagen I | Trevigen | 3440-100-01 | |
| Culture Plate, PS, 48 wells, TC treated with lid, sterile | Max Scientific | 07-6048 | |
| Dimethyl Sulfoxide (DMSO) Hybri-Max | Sigma-Aldrich | D2650 | |
| DMEM - high glucose 4.5 mg/mL | Corning | MT10-0130CV | |
| Dnase I - Grade II | Millipore Sigma | 10104159001 | |
| DPBS, 1% | Corning | 21-031-CV | |
| Fetal Bovine Serum, FBS | Corning | MT35-010-CV | |
| FITC Annexin V Apoptosis Detection Kit I | BD Biosciences | 556547 | |
| Forskolin | Tocris | 1099 | |
| Geneticin Selective Antibiotic (G418 Sulfate) (50 mg/mL) | ThermoFisher | 10131035 | |
| GlutaMAX Supplement | ThermoFisher | 35050061 | |
| Ham's F12 Nutrient Mix | ThermoFisher | 11765054 | |
| HEPES (1 M) | Gibco | 15630-080 | |
| Hygromycin B (50 mg/mL) | ThermoFisher | 10687010 | |
| L-Glutamine 200 mM (100x) | Gibco | 25030-081 | |
| L-WRN cell | ATCC | CRL-3276 | |
| Matrigel Phenol Free & Growth Fact. Reduced | Corning | 356231 | |
| Millex PVDF syringe filter, 0.22 μM | Millipore Sigma | SLGVR33RB | |
| N-Acetylcysteine | Sigma-Aldrich | A9165-5G | |
| Nicotinamide | Sigma-Aldrich | N0636-100G | |
| Nunc TripleFlask Treated Cell Culture Flask | ThermoFisher | 132867 | |
| PE/Cyanine5 anti-human CD8a Antibody | BioLegend | 301010 | |
| PE-Cy 7 Mouse anti-Human CD279 (PD-1) | BD Biosciences | 561272 | |
| Pen Strep | Gibco | 15140-122 | |
| Recombinant Human EGF | Peprotech | AF-100-15-1MG | |
| Recombinant Human FGF-acidic | Peprotech | 100-17A | |
| Sodium Bicarbonate Solution (NaHCO3) (7.5%) | Quality Biological | 118-085-721 | |
| Stainless Steel Surgical Blades no. 22 | Integra | 4-322 | |
| TrypLE Express | Gibco | 12604-021 |
References
Loading...
$$\rightleftharpoonup{xx}$$
$$\longleftharp{xx}$$,
$$\longrightharp{xx}$$,
- Mirabelli, P., Coppola, L., Salvatore, M. Cancer Cell Lines Are Useful Model Systems for Medical Research. Cancers (Basel). 11 (8), 1098(2019).
- Shannon, A. E., Boos, C. E., Hummon, A. B. Co-culturing multicellular tumor models: Modeling the tumor microenvironment and analysis techniques. Proteomics. 21 (9), e2000103(2021).
- Jubelin, C., Muñoz-Garcia, J., Griscom, L. Three-dimensional in vitro culture models in oncology research. Cell Biosci. 12, 155(2022).
- Jin, J., Yoshimura, K., Sewastjanow-Silva, M., Song, S., Ajani, J. A. Challenges and prospects of patient-derived xenografts for cancer research. Cancers (Basel). 15 (17), 4352(2023).
- Nabel, C. S., Heiden, M. G. V. Patient-derived xenografts to study cancer metabolism: when does X mark the spot). Cancer Res. 81 (17), 4399(2021).
- Choi, Y., et al. Studying cancer immunotherapy using patient-derived xenografts (PDXs) in humanized mice. Exp Mol Med. 50 (8), 99(2018).
- Woo, X. Y., et al. Conservation of copy number profiles during engraftment and passaging of patient-derived cancer xenografts. Nat Genet. 53 (1), 86(2021).
- Somasundaram, R. Tumor-infiltrating mast cells are associated with resistance to anti-PD-1 therapy. Nat Commun. 12 (1), 346(2021).
- Abdolahi, S. Patient-derived xenograft (PDX) models, applications and challenges in cancer research. J Transl Med. 20 (1), 206(2022).
- Yang, S., et al. Organoids: The current status and biomedical applications. Med Comm. 4 (3), e274(2023).
- Minoli, M. Bladder cancer organoids as a functional system to model different disease stages and therapy response. Nat Commun. 14, 2214(2023).
- Ou, L., et al. Patient-derived melanoma organoid models facilitate the assessment of immunotherapies. eBioMedicine. 92, 104614(2023).
- Grönholm, M., et al. Patient-derived organoids for precision cancer immunotherapy. Cancer Res. 81 (12), 3149-3155 (2021).
- Ou, L., et al. Preclinical platforms to study therapeutic efficacy of human γδ T cells. Clin Transl Med. 12 (6), e814(2022).
- Murine L-Wrn conditioned medium protocol. The University of Texas MD Anderson Cancer Center. , Available from: https://www.mdanderson.org/documents/Labs/Taniguchi%20Laboratory/Mouse%20CM.pdf (2024).
- Jee, J. H., et al. Development of collagen-based 3D matrix for gastrointestinal tract-derived organoid culture. Stem Cells Int. 13 (2019), 8472712(2019).
- Pipkin, M. E., Rao, A., Lichtenheld, M. G. The transcriptional control of the perforin locus. Immunol Rev. 235 (1), 55(2010).
- Li, X., et al. Tim-3 suppresses the killing effect of Vγ9Vδ2 cells on colon cancer cells by reducing perforin and granzyme B expression. Exp Cell Res. 386 (1), 111719(2020).
- Li, L. T., Jiang, G., Chen, Q., Zheng, J. N. Ki67 is a promising molecular target in the diagnosis of cancer (Review). Mol Med Rep. 11 (3), 1566-1572 (2015).
- Sato, T., et al. Single Lgr5 stem cells build crypt-villus structures in vitro without a mesenchymal niche. Nature. 459 (7244), 262-265 (2009).
- Li, H. Y., Ren, K., Wang, C., Bu, W. B. Skin organoid research progress and potential applications. International Journal of Dermatology and Venereology. 5 (2), 101-106 (2022).
- Sun, L., et al. A human mucosal melanoma organoid platform for modeling tumor heterogeneity and exploring immunotherapy combination options. Sci Adv. 9 (43), eadg6686 (2023).
- Vlachogiannis, G., et al. Patient-derived organoids model treatment response of metastatic gastrointestinal cancers. Science. 359 (6378), 920-926 (2018).
- Ganesh, K., et al. A rectal cancer organoid platform to study individual responses to chemoradiation. Nat Med. 25 (10), 1607-1614 (2019).
- Vilgelm, A. E., et al. Fine-needle aspiration-based patient-derived cancer organoids. iScience. 23 (8), 101408(2020).
Reprints and Permissions
Request permission to reuse the text or figures of this JoVE article
Request Permission