Here, we describe some established methods to determine endoplasmic reticulum (ER) stress and unfolded protein response (UPR) activation, with particular emphasis on HIV-1 infection. This article also describes a set of protocols to investigate the effect of ER stress/UPR on HIV-1 replication and virion infectivity.
Method Article
Measuring Endoplasmic Reticulum Stress and Unfolded Protein Response in HIV-1 Infected T-Cells and Analyzing its Role in HIV-1 Replication
Opens in a new tab
In This Article
Summary
Loading...
$$\rightleftharpoonup{xx}$$
$$\longleftharp{xx}$$,
$$\longrightharp{xx}$$,
Abstract
Loading...
$$\rightleftharpoonup{xx}$$
$$\longleftharp{xx}$$,
$$\longrightharp{xx}$$,
Viral infections can cause Endoplasmic Reticulum (ER) stress due to abnormal protein accumulation, leading to Unfolded Protein Response (UPR). Viruses have developed strategies to manipulate the host UPR, but there is a lack of detailed understanding of UPR modulation and its functional significance during HIV-1 infection in the literature. In this context, the current article describes the protocols used in our laboratory to measure ER stress levels and UPR during HIV-1 infection in T-cells and the effect of UPR on viral replication and infectivity.
Thioflavin T (ThT) staining is a relatively new method used to detect ER stress in the cells by detecting protein aggregates. Here, we have illustrated the protocol for ThT staining in HIV-1 infected cells to detect and quantify ER stress. Moreover, ER stress was also detected indirectly by measuring the levels of UPR markers such as BiP, phosphorylated IRE1, PERK, and eIF2α, splicing of XBP1, cleavage of ATF6, ATF4, CHOP, and GADD34 in HIV-1 infected cells, using conventional immunoblotting and quantitative reverse transcription polymerase chain reaction (RT-PCR). We have found that the ThT-fluorescence correlates with the indicators of UPR activation. This article also demonstrates the protocols to analyze the impact of ER stress and UPR modulation on HIV-1 replication by knockdown experiments as well as the use of pharmacological molecules. The effect of UPR on HIV-1 gene expression/replication and virus production was analyzed by Luciferase reporter assays and p24 antigen capture ELISA, respectively, whereas the effect on virion infectivity was analyzed by staining of infected reporter cells. Collectively, this set of methods provides a comprehensive understanding of the Unfolded Protein Response pathways during HIV-1 infection, revealing its intricate dynamics.
Introduction
Loading...
$$\rightleftharpoonup{xx}$$
$$\longleftharp{xx}$$,
$$\longrightharp{xx}$$,
Acquired immunodeficiency syndrome (AIDS) is characterized by a gradual reduction in the number of CD4+ T-lymphocytes, which leads to the progressive failure of immune response. Human immunodeficiency virus-1 (HIV-1) is the causative agent of AIDS. It is an enveloped, positive sense, single-stranded RNA virus with two copies of RNA per virion and belongs to the retroviridae family. Production of high concentrations of viral proteins within the host cell places excessive stress on the protein folding machinery of the cell1. ER is the first compartment in the secretory pathway of eukaryotic cells. It is in charge of producing, altering, and delivering proteins to the secretory pathway and the extracellular space target sites. Proteins undergo numerous post-translational changes and fold into their natural conformation in the ER, including asparagine-linked glycosylation and the creation of intra- and intermolecular disulfide bonds2. Therefore, high concentrations of proteins are present in the ER lumen and these are very prone to aggregation and misfolding. Various physiological conditions, such as heat shock, microbial, or viral infections, which demand enhanced protein synthesis or protein mutation, lead to ER stress due to increased protein accumulation in the ER, thereby disturbing the ER lumen homeostasis. The ER stress activates a network of highly conserved adaptive signal transduction pathways, the Unfolded Protein Response (UPR)3. UPR is employed to bring back the normal ER physiological condition by aligning its unfolded protein burden and folding capacity. This is brought upon by increasing the ER size and ER-resident molecular chaperones and foldases, resulting in an elevation of the ER's folding ability. UPR also decreases the protein load of the ER through global protein synthesis attenuation at the translational level and increases clearance of unfolded proteins from the ER by upregulating ER-associated degradation (ERAD)4,5.
ER stress is sensed by three ER-resident transmembrane proteins: Protein kinase R (PKR)-like endoplasmic reticulum kinase (PERK), Activating transcription factor 6 (ATF6), and Inositol-requiring enzyme type 1 (IRE1). All these effectors are kept inactive by binding to the chaperone Heat shock protein family A (Hsp70) member 5 (HSPA5), also known as binding protein (BiP)/78-kDa glucose-regulated protein (GRP78). Upon ER stress and accumulation of unfolded/misfolded proteins, HSPA5 dissociates and leads to activation of these effectors, which then activate a series of downstream targets that help in resolving the ER stress and, in extreme conditions, promote cell death6. Upon dissociation from HSPA5, PERK autophosphorylates, and its kinase activity is activated7. Its kinase activity phosphorylates eIF2α, which leads to translational attenuation, lowering the protein load of the ER8. However, in the presence of phospho-eukaryotic initiation factor 2α (eIF2α), non-translated open reading frames on specific mRNAs become preferentially translated, such as ATF4, regulating stress-induced genes. ATF4 and C/EBP homologous protein (CHOP) are transcription factors that regulate stress-induced genes and regulate apoptosis and cell death pathways9,10. One of the targets of ATF4 and CHOP is the growth arrest and DNA damage-inducible protein (GADD34), which, along with protein phosphatase 1 dephosphorylate peIF2α and acts as a feedback regulator for translational attenuation11. Under ER stress, ATF6 dissociates from HSPA5, and its Golgi-localization signal is exposed, leading to its translocation to Golgi apparatus. In the Golgi apparatus, ATF6 is cleaved by site-1 protease (S1P) and site-2 protease (S2P) to release the cleaved form of ATF6 (ATF6 P50). ATF6 p50 is then translocated to the nucleus, where it induces the expression of genes involved in protein folding, maturation, and secretion as well as protein degradation12,13. During ER stress, IRE1 dissociates from HSPA5, multimerizes, and auto-phosphorylates14. Phosphorylation of IRE1 activates its RNase domain, specifically mediating the splicing of 26 nucleotides from the central part of the mRNA of X-box binding protein 1 (XBP1)15,16. This generates a novel C-terminus conferring transactivation function, generating functional XBP1s protein, a potent transcription factor controlling several ER stress-induced genes17,18. The combined activity of these transcription factors switches on genetic programs aimed at restoring ER homeostasis.
There are various methods to detect ER stress and UPR. These include the conventional methods of analyzing the UPR markers19,20. Various non-conventional methods include measuring the redox state of the UPR and calcium distribution in the ER lumen as well as assessing the ER structure. Electron microscopy may be used to see how much the ER lumen enlarges in response to ER stress in cells and tissues. However, this method is time-consuming and depends on the availability of an electron microscope, which may not be available to every research group. Also, measuring the calcium flux and the redox state of the ER is challenging due to the availability of reagents. Moreover, the readout from these experiments is very sensitive and might be affected by other factors of cellular metabolism.
A powerful and simple technique for monitoring the UPR outputs is to measure the activation of the different signaling pathways of the UPR and has been used for decades in various stress scenarios. These conventional methods to measure UPR activation are economical, feasible, and provide the information in less time as compared to other known methods. These include immunoblotting to measure the expression of UPR markers at the protein level, such as phosphorylation of IRE1, PERK, and eIF2α and cleavage of ATF6 by measuring the P50 form of ATF6 and protein expression of other markers such as HSPA5, spliced XBP1, ATF4, CHOP and GADD34 as well as RT-PCR to determine the mRNA levels as well as splicing of XBP1 mRNA.
This article describes a validated and reliable set of protocols to monitor ER stress and UPR activation in HIV-1 infected cells and to determine the functional relevance of UPR in HIV-1 replication and infectivity. The protocols utilize easily available as well as economical reagents and provide convincing information about the UPR outputs. ER stress is the result of the accumulation of unfolded/misfolded proteins, which are prone to forming protein aggregates21. We hereby describe a method to detect these protein aggregates in HIV-1-infected cells. Thioflavin T staining is a relatively new method being used to detect and quantify these protein aggregates22. Beriault and Werstuck described this technique to detect and quantify protein aggregates and, hence ER stress levels in live cells. It has been demonstrated that the small fluorescent molecule thioflavin T (ThT) binds selectively to protein aggregates, especially amyloid fibrils.
In this article, we describe the use of ThT to detect and quantify ER stress in HIV-1 infected cells and correlate it to the conventional method of monitoring UPR by measuring the activation of different signaling pathways of UPR.
Since, there is also a lack of comprehensive information regarding the role of UPR during HIV-1 infection, we provide a set of protocols to understand the role of UPR in HIV-1 replication and virion infectivity. These protocols include the lentivirus mediated knockdown of UPR markers as well as treatment with pharmacological ER stress inducers. This article also shows the types of read-out which can be used to measure the HIV-1 gene expression, viral production as well as the infectivity of the produced virions, such as long terminal repeat (LTR)-based luciferase assay, p24 enzyme-linked immunosorbent assay (ELISA) and β-gal reporter staining assay respectively.
Using the majority of these protocols, we have recently reported the functional implication of HIV-1 infection on UPR in T-cells23, and the results of that article suggest the reliability of the methods described here. Thus, this article provides a set of methods for comprehensive information regarding the interplay of HIV-1 with ER stress and UPR activation.
Protocol
Loading...
$$\rightleftharpoonup{xx}$$
$$\longleftharp{xx}$$,
$$\longrightharp{xx}$$,
NOTE: The cell lines used here are HEK-293T and Jurkat J6 (a CD4+T cell line), which were obtained from the Cell Repository, NCCS, Pune, India; TZM-bl, a HeLa derived cell line that has integrated copies of β-galactosidase and luciferase genes under the HIV-1 long terminal repeat (LTR) promoter24 and CEM-GFP (another CD4+ T reporter cell line)25 were obtained from the NIH AIDS Repository, USA.
1. HIV-1 virus stock preparation and storage
- HIV-1 virus stock preparation
NOTE: It is advised to practice biosafety-related international guidelines as available in the World Health Organization (WHO) or Centers for Disease Control and Prevention (CDC) manual in all experiments involving HIV-1. Handling of the virus and any experiment with the live virus should only be done in an appropriate biosafety cabinet housed in at least a BSL2-level containment laboratory. Production of infectious HIV-1 particles using a Calcium phosphate mammalian transfection kit is described in this segment of the protocol.- Seed HEK-293T cells in 90 mm dishes with 10 mL of complete (supplemented with 10% Fetal bovine serum and 1% penicillin-streptomycin) DMEM (Dulbecco's Modified Eagle Medium) in a class II type A2 biosafety cabinet and keep for approximately 12 h in a tissue culture incubator at 37 °C so that the confluence of the cells is between 50%-60%.
- Next day, make the transfection mix: Prepare Solution A containing 25 µg of pNL4.3 (a molecular clone of HIV-1) plasmid DNA in sterile buffer, 86.8 µL of 2 M CaCl2, and the remaining sterile water to make the final volume 700 µL for each plate. Prepare Solution B containing 700 µL of 2x HEPES-buffered saline (HBS) for 1 plate. Then, adjust the calculation for the total number of plates.
- Now add Solution B to Solution A in a drop-wise manner while continuously vortexing Solution A. The total volume of the transfection mix now becomes 1.4 mL for one plate.
NOTE: Precise drop-wise addition of Solution B to Solution A while continuous vortexing leads to the formation of perfect transfection complexes. - Incubate this mixture at room temperature (RT) for about 20 min. Next, slowly add the mixture drop-wise to each plate containing fresh 9 mL of complete DMEM and transfer the plates to the CO2 incubator. After 8-10 h, change the existing media with fresh 10 mL of complete DMEM.
- After 24 h post-media change, collect the supernatant (that contains the virus particles) from all the plates in conical tubes. Centrifuge at 600 x g for 5 min using a low-speed tabletop centrifuge (Table of Materials) to remove cell debris.
- Transfer the supernatant to polyallomer ultracentrifuge tubes and place them in the swingout rotor of an ultracentrifuge (Table of Materials). Check the tube holders' weights for balance and adjust with a sterile medium if needed.
- Ultracentrifuge at 1,41,000 x g for 2.5 h at 4 °C. After this, carefully take out the tubes and decant the supernatant slowly inside the biosafety cabinet.
- To the pellet (which is the concentrated virus now) in each tube, add 1 mL of incomplete RPMI (Roswell Park Memorial Institute) 1640 medium and do vigorous pipetting to dislodge the pellet.
NOTE: The pellet after ultracentrifuge is almost invisible to the naked eye. So, it must be made sure to add RPMI 1640 in the middle of the tube so that the pellet is properly dislodged. - Next, add 25 µL of 1 M HEPES pH 7.4 to the 1 mL of virus suspension. Aliquot 50 µL of the suspension to 1.5 mL centrifuge tubes and store them in a -80 °C freezer immediately for long-term storage.
- Quantitation of virus concentration and virion infectivity
NOTE: For calculating the infectivity of the virus, it is essential first to quantify its concentration, which is done by p24 Antigen Capture ELISA (according to the manufacturer's instructions and thus is not being described here; see Table of Materials). This process gives the virus' concentration in nanograms per microliter (ng/µL) of the stock, which is then used to identify the infective virion number in the stock through the following experiment in TZM-bl reporter cells26.- Count and seed 0.1 x 10⁶ TZM-bl cells in a 24 well plate using 500 µL of complete DMEM for each well and keep it in a cell culture incubator for 10-12 h.
- Make sure the cells are 50%-60% confluent before beginning with infection for virus quantitation. Change the existing media with 250 µL of fresh complete DMEM to each well.
NOTE: Keep a positive control well to rule out any experimental fault. - Calculate the amount of stock virus needed for infections of 1 ng, 0.1 ng, and 0.01 ng in duplicates. Add the appropriate amount of virus to the wells and keep the plate in the incubator at 37 °C for 4 h.
- Wash the cells twice with 500 µL of incomplete DMEM and then add 500 µL of complete DMEM.
- Proceed with the β-gal staining procedure after 36 h of media change.
- Discard the existing media and wash the cells twice with 1 mL of PBS. Fix the cells by adding 500 µL of the fixing solution (0.25% Glutaraldehyde in PBS) to each well and incubate at RT inside the biosafety cabinet for 5-7 min.
- Prepare the staining solution as given in Table 1. Keep it away from light as X-gal is light-sensitive.
- Wash the cells once with 1 mL of PBS. Overlay the cells with 500 µL of freshly prepared staining solution and incubate at 37 °C in the dark for 2-18 h.
- To stop the reaction afterward, rinse the cells with 500 µL of 3% dimethyl sulfoxide (DMSO) in PBS twice and then keep the cells in 500 µL of fresh PBS.
- Count the blue infected cells (as shown in Figure 1A) under the microscope in 10x magnification for 5 random fields. Take an average count of the 5 fields and multiply it with the field factor and dilution factor. This quantifies the infective virion particles in the virus stock.
NOTE: For a 24 well plate, the field factor is 75.
| Components | Preparation | Required volume | |
| PBS | Prepare 1x PBS from a stock of 10x PBS | 14 mL | |
| Potassium Ferri-ferro cyanide | Dissolve 0.82 g of Potassium Ferricyanide and 1.06 g of Potassium Ferrocyanide in 25 mL of 1x PBS | 0.75 mL | |
| Magnesium chloride | 1 M in 1 mL of 1x PBS | 15 µL | |
| X-gal | Dissolve 30 mg in 0.6 mL of N,N-dimethyl formamide (in dark) | 0.3 mL | |
| Total = 15 mL | |||
Table 1: List of components required for β-gal staining in TZM-bl cells.
2. HIV-1 infection of T-cell lines
- Thaw and culture an immortalized T-cell line. This study used CEM-GFP cell line cultured in complete RPMI 1640 medium supplemented with 10% Fetal bovine serum, 1% penicillin-streptomycin, and 500 µg/mL G418.
- Count and take 2 million cells for each time point (Uninfected, 24 h, 48 h, 72 h, and 96 h). Harvest the uninfected cells immediately by centrifuging at 100 x g for 5 min and add cell lysis buffer (50 mM Tris-HCl pH 7.4, 0.12 M NaCl, 5 mM EDTA, 0.5% NP40, 0.5 mM NaF, 1 mM DTT), supplemented with protease inhibitor cocktail, 0.5 mM phenylmethylsulfonyl fluoride (PMSF) and 1x phosphatase inhibitor (50 µL for 1-3 million cells) or lyse in Trizol reagent (1 mL for 1-3 million cells) for RNA isolation (see Table of Materials).
- Wash the cells once with 1 mL of complete RPMI 1640 medium containing polybrene (5 µg/mL) at 100 x g for 5 min at RT. Resuspend the cells in 1 mL of complete medium.
NOTE: Polybrene is a cationic polymer that is used to enhance retroviral infection in mammalian cells. - Resuspend the 8 million cells in 1 mL of polybrene containing complete medium. Now calculate the volume of viral stock required for 4 million virion particles, add the virus stock, and make up the total volume to 2 mL by adding complete media. This makes it an MOI of 0.5.
- Keep the cells inside the CO2 incubator at 37 °C for 4 h, with intermittent tapping every 30-45 min.
- After 4 h, spin down the cells and discard the supernatant carefully inside the biosafety cabinet with proper disposal methods.
NOTE: From this step onwards, centrifuge the cells at 100 x g for 5 min at RT. - Wash the cells twice with 1 mL of incomplete medium. Resuspend the cells in 8 mL of complete medium, making it 1 million cells/mL.
- In a 6-well tissue culture plate, seed an equal number of cells in the required number of wells and keep the plate in a CO2 incubator maintained at 37 °C.
- For the next 4 days, harvest the cells every 24 h by adding cell lysis buffer. Also, collect the supernatant and immediately transfer it to the -80 °C freezer.
- To check whether infection has happened, proceed for p24 antigen capture ELISA for all the time points. Make proper dilutions for the time points, i.e., a lower dilution for initial time points and higher for later ones ranging from 1:50 to 1:500. Plot the readings in a graph that depicts the infection progression (Figure 1B).
3. Thioflavin T staining to determine ER stress
- Fix 1 million each uninfected and 0.5 MOI infected CEM-GFP cells (taken 72 h infected cells) with 200 µL of 4% paraformaldehyde in PBS for 20 min at RT.
- Pellet down the cells at 100 x g for 5 min and treat with 500 µL of 0.1 M glycine for 5 min, followed by washing with 500 µL of PBS twice. Resuspend the cells in 100 µL of PBS.
- Assemble the glass slides, filter cards, and sample chambers. Add the 100 µL of resuspended cells to the sample chambers and spin the cells at 1000 x g for 4 min to adhere the cells to the slides in a cytocentrifuge (Table of Materials).
NOTE: There would not be enough cells immobilized on the slide following the cytocentrifuge centrifugation if the cell suspension is too diluted. The cells are likely to clump up and be poorly distributed after the cytocentrifuge, if the cell suspension is very concentrated. - Permeabilize the cells for 10 min using drops of 0.1% Triton-X-100 in PBS (enough to cover the area where the cells have adhered) and wash the cells twice by putting drop-wise PBS and wiping off the PBS with tissue by tilting the slide.
- Incubate the cells with 10 µL of 5 µM Thioflavin T for 30 min.
NOTE: Do not wash after incubation with ThT. - Mount the slides using 5 µL of mounting media (80% glycerol v/v, 20% PBS v/v, and 8 mg/mL 1,4-diazabicyclo[2.2.2]octane [DABCO]), put coverslip and seal the coverslip using nail polish. Leave the slides to dry.
NOTE: At all these steps, make sure the cells do not dry up. - Take the confocal images of fixed cells with a 63x glycerol immersion lens on a confocal microscope (see Table of Materials). Adjust the following excitation and emission settings: GFP (Ex. 494 nm, Em. 519 nm) and ThT (Ex. 458 nm, Em. 480-520 nm).
NOTE: Each fluorescent channel should be imaged sequentially, as opposed to simultaneously, to avoid channel overlap. GFP was taken as the indication of HIV-1 infection as CEM-GFP cells have GFP under the regulation of LTR promoter, which fires upon HIV-1 infection25. - Convert the fluorescent images to 8-bit before quantifying by threshold analysis. Quantify the intensity of each cell manually using software like Image J (~50 cells)27. Plot the graph with the intensity of each cell as points on the Y-axis against uninfected and infected criteria.
- To demonstrate the effectiveness of this protocol, take a positive control, for example, Thapsigargin treatment (known ER stress inducer) in this case28. Treat 1 million CEM-GFP cells, each with 1 µL of DMSO (vehicle control) and 100 nM of Thapsigargin for 12 h.
- Harvest the cells and process for ThT staining as mentioned for infected samples (steps 3.1-3.8).
NOTE: For these samples, GFP fluorescence is not required. Hence, only ThT fluorescence is captured in confocal microscopy.
4. Determining the activation and expression of various UPR markers
NOTE: To determine the expression of UPR markers two methods are used: Immunoblotting and RT-PCR. For immunoblotting, harvest the 0.5 MOI HIV-1 infected CEM-GFP cells at various time points post-infection (24 h, 48 h, 72 h, and 96 h post-infection) and resuspend the cell pellet in lysis buffer (as mentioned in step 2.2). Alternately, for RT-PCR, the cell pellets are lysed in Trizol reagent (1 mL for 1-3 million cells) (See Table of Materials). The cells resuspended in lysis buffer and Trizol reagent can be stored at -80 °C until further use.
- Immunoblotting for analysis of UPR markers.
- Keep the resuspended cells in the lysis buffer on ice for 45 min with intermittent mixing using a vortex.
- Pellet down the cells at 18000 x g for 15 min using a benchtop high-speed centrifuge (see Table of Materials). Collect the supernatant in a fresh tube.
- Quantify the protein concentration in each sample using Bradford or a similar reagent.
- Take an equal concentration of protein for each sample and prepare the protein samples in Laemmli buffer (6x buffer: 250 mM Tris-Cl pH 6.8, 10% SDS, 30% Glycerol, and 0.02% Bromophenol blue; 5% β-Mercaptoethanol).
NOTE: For immunoblotting for each UPR marker, a minimum of 60-80 µg of protein was used. - Boil the protein samples at 96 °C for 5 min and give a short spin.
- Resolve the protein samples on a 10%-12% SDS-PAGE gel and transfer the proteins to a polyvinylidene difluoride (PVDF) membrane (see Table of Materials).
- Block with 5% non-fat dry milk or bovine serum albumin (BSA) for 1-2 h, wash twice with TBST (20 mM Tris pH7.4 and 0.137 M NaCl; 0.1% Tween 20), and probe with protein-specific primary antibodies against UPR markers (see Table of Materials) in a rocker, overnight at 4 °C. Next day after washing the blots twice with TBST, probe with respective secondary antibodies for 1.5 h.
- Wash the blots again with TBST and visualize the protein bands using a chemiluminescence-detecting substrate (see Table of Materials) in a western blot imaging instrument.
- RT PCR
- Isolate the total RNA from the cells using Trizol reagent (see Table of Materials).
- Prepare the cDNA from equal concentration of RNA using Moloney Murine Leukemia Virus reverse transcriptase (MMLV-RT) (see Table of Materials).
- Analyze the modulation of the mRNA expression of HSPA5, spliced XBP1, ATF4, CHOP and GADD34 using qRT-PCR with gene-specific primers (Table 2). Briefly, prepare 10 µL reaction mixtures containing cDNA template (100 ng), 5 µL of SYBR Green dye (see Table of Materials), and 10 pmol of each gene-specific oligonucleotide primer pair. Adjust the volume using sterile H2O.
- Run the mixtures on a real-time PCR machine using the following program: initial denaturation at 95 °C for 3 min and 40 cycles of 95 °C for 30 s, 55 °C for 30 s, and 72 °C for 30 s followed by the melt curve analysis. Calculate the fold change in the target gene expression relative to the housekeeping gene (for example β-Actin) as:
Fold change = 2-Δ(ΔCT)
Where ΔCT = CT (target) − CT (house-keeping gene)
and Δ(ΔCT) = ΔCT (treated) -ΔCT (control) - To further confirm the splicing of XBP1, perform a semi-quantitative RT-PCR with uninfected and 72 h infected samples.
NOTE: Splicing of the XBP-1 mRNA is studied by using RT-PCR across the splice site. - Amplify the cDNA with XBP1 primers (Table 2) using a high-fidelity PCR master mix (see Table of Materials) under the following conditions: 1 cycle of 98 °C for 30 s, followed by 5 cycles of 98 °C for 15 s, 65*Δ-5 °C for 30 s and 72 °C for 30 s, followed by 30 cycles of 98 °C for 15 s, 55 °C for 30 s and 72 °C for 30 s, followed by a final extension of 72 °C for 10 min and hold at 4 °C.
- Separate the amplicons on a 2.5% agarose gel containing 50 ng of ethidium bromide/mL and visualize in a gel doc instrument. The spliced XBP1 band is smaller by 26 nucleotides.
5. Knockdown of UPR markers and analysis of HIV-1 LTR-driven gene expression and virus production
- Preparation of shRNA constructs for knockdown of UPR markers
- Create shRNA constructs using the pLKO.1-TRC vector backbone (lentiviral cloning vector)29.
- Construct two shRNA constructs for each gene (IRE1, PERK, ATF6 and HSPA5). Sense and anti-sense oligonucleotides targeting the respective gene's mRNA are designed by RNAi Consortium (https://www.broadinstitute.org/rnai-consortium/rnai-consortium-shrna-library) (Table 3).
NOTE: In a similar way, shRNA constructs can be made for other UPR markers. - Anneal the primers (100 nM each of forward and reverse) at 95 °C followed by gradual cooling to RT.
- Then, ligate it into the Age1 and EcoRI sites of the pLKO.1 vector using a T4 DNA ligase (see Table of Materials). Confirm the sequence by DNA sequencing.
NOTE: A shRNA construct targeting the LacZ gene is used as a non-targeting control.
- Knockdown of PERK, ATF6, IRE1 and HSPA5 in HEK-293T cells, Luciferase assay and p24 ELISA
- Prepare a mix of shRNA construct (0.9 µg) and a transfection reagent like polyethylenimine (PEI) (3 µL of PEI for 1 µg of DNA) (see Table of Materials) in 50 µL of serum-free media by vortexing and incubate for 20 min.
- From a confluent HEK-293T cells containing flask, trypsinize and seed ~0.25 x 10⁶ cells along with the transfection mix in a 24 well plate, making the total volume of 125 µL and incubate for 6 h at 37 °C in a CO2 incubator. This method is called reverse transfection where the cells are seeded along with the transfection mixture.
- After 6 h, add 125 µL of complete media to the wells and resuspend the cells for even seeding.
NOTE: For knockdown experiments, reverse transfection (steps 5.2.1-5.2.3) gives better efficiency with both shRNAs and siRNAs. - After 24 h, perform a second transfection. Prepare a mix of pNL4-3 (100 ng), pLTR-Luc (100 ng), and pEGFP-N1 (50 ng) (pNL4-3:pLTR-Luc:pEGFPN1-1:1:0.5) constructs with PEI (3 µL of PEI for 1 µg of DNA) in 50 µL of incomplete media by vortexing. Incubate the mix for 20 min at RT. Change the existing media with 250 µL of fresh incomplete media and add the mix to the cells.
NOTE: A reporter vector for the HIV-1 LTR was developed by sub-cloning LTR from pU3RIII30,31 into pGL3basic in the laboratory earlier32. GFP expression using pEGFP-N1 was utilized to normalize transfection efficiency32. - Change the media after 6 h post-transfection with 500 µL of complete DMEM. Harvest the cells after 36 h for immunoblotting and luciferase assay.
- For luciferase assay, pellet the cells and resuspend in a commercially procured luciferase substrate (50 µL) (see Table of Materials). Add the resuspended cell lysate to an opaque 96 well plate and incubate for 10-15 min. Obtain the luciferase reading in a luminometer. Also measure GFP fluorescence in the same samples to normalize the luciferase reading in a microplate micromode plate reader (Ex: 494 nm, Em:519 nm).
- Plot the graph as the Luciferase unit/GFP on the Y-axis.
NOTE: The knockdown of the respective UPR markers should be checked, and it can be done by either immunoblotting or qRT-PCR using gene-specific antibodies or primers, respectively. - Collect the supernatants to process for p24 ELISA as mentioned above.
- Creation of stable cells with knockdown of UPR markers and HIV-1 infection.
- Prepare the Lentivirus particles by transfecting HEK-293T cells seeded in a 6 well plate, with the respective shRNA (1 µg) constructs along with pMD2.G (VSV-G envelope vector) (0.75 µg), and psPAX2 (Lentiviral packaging plasmid) (0.25 µg) (see Table of Materials) using PEI in the ratio 1 µg of DNA: 3 µL of PEI. Prepare the mixture in 100 µL of incomplete DMEM and incubate for 20 min at RT. Add the mixture to 1.8 mL of complete media in the seeded HEK-293T cells.
NOTE: Seed HEK-293T cells in a 6 well plate at least 12 h before transfection until they gain morphology and are approximately 60-70% confluent. - After 24 h of transfection, add 1 mL of complete DMEM to each well.
- Collect the supernatants after 48 h, store at -80 °C freezer, and perform p24 ELISA to confirm the presence of the virus in these supernatants. Use this crude lentiviral supernatant for transducing J6 cells.
- Incubate 2 million cells in a 6 well plate with an equal volume of lentiviral supernatant (500 µL) for each control and gene-specific knockdown lentivirus and add fresh complete RPMI 1640 medium in the presence of polybrene (5 µg/mL) to make up the volume to 2 mL.
- After 24 h, add Puromycin (1 µg/mL) to each well to select stable cells. After adding Puromycin, pellet the cells every 24 h and add 2 mL of fresh media with Puromycin.
- Do this till there is no cell death (~1 week). The surviving cells are the stable cells with the desired gene knockdown.
NOTE: The knockdown of respective genes can be checked at regular intervals and, finally, when only surviving cells are visible in Puromycin-containing media by using immunoblotting or qRT-PCR. - Infect the LacZ and gene-specific knockdown cells with 0.5 MOI of HIV-1 as described in section 2 and harvest the cells 48 h post-infection.
- Collect the supernatant from each sample and process for p24-ELISA as described earlier and process the cells to check the knockdown level by immunoblotting.
- Prepare the Lentivirus particles by transfecting HEK-293T cells seeded in a 6 well plate, with the respective shRNA (1 µg) constructs along with pMD2.G (VSV-G envelope vector) (0.75 µg), and psPAX2 (Lentiviral packaging plasmid) (0.25 µg) (see Table of Materials) using PEI in the ratio 1 µg of DNA: 3 µL of PEI. Prepare the mixture in 100 µL of incomplete DMEM and incubate for 20 min at RT. Add the mixture to 1.8 mL of complete media in the seeded HEK-293T cells.
6. Treatment with ER stress inducer and analyzing its effect on HIV-1 replication
NOTE: To determine the effect of overstimulation of UPR during HIV-1 replication, the pharmacological inducer molecule, Thapsigargin, can be used.
- Determining the percent cell viability upon Thapsigargin treatment.
NOTE: The cytotoxicity of Thapsigargin is determined by the MTT reagent (see Table of Materials).- Seed 25,000-30,000 CEM-GFP cells per well in 96 well plate containing 100 µL of complete RPMI 1640. Add 100 nM Thapsigargin to the media and incubate at 37 °C in an incubator.
NOTE: Cells treated with 1 µL of DMSO were taken as vehicle control. - After 48 h, add 10 µL of MTT (5 mg/mL) in each well and incubate in the dark for 4 h for the formation of formazan crystals at 37 °C with 5% CO2.
- After 4 h, dissolve the crystals using 100 µL of isopropanol to form a purple color and measure the absorbance at 570 nm using a spectrophotometer.
- Calculate the percent cell viability based on the equation given below
% cell viability = (ControlOD570 - TreatmentOD570)/ ControlOD570 x 100
- Seed 25,000-30,000 CEM-GFP cells per well in 96 well plate containing 100 µL of complete RPMI 1640. Add 100 nM Thapsigargin to the media and incubate at 37 °C in an incubator.
- Pre-treatment of Thapsigargin and analysis of HIV-1 infection progression by p24 ELISA.
- Seed 1 million CEM-GFP cells in a 12 well plate containing 1 mL of complete RPMI 1640 and treat the cells with 100 nM of Thapsigargin or 1 µL of DMSO (vehicle control) for 12 h in a CO2 incubator maintained at 37 °C. After 12 h, wash the cells with complete RPMI 1640 and infect with 0.5 MOI of HIV-1 as described earlier.
- Harvest the cells at different time points, such as 24 h, 48 h, and 72 h post-infection, for immunoblotting.
- Collect the supernatants from each sample and perform p24 ELISA as described earlier.
- Plot the graph with the p24 concentration in the sample as the Y-axis and the respective time points as the X-axis.
- Using immunoblotting, analyze the ER stress induction due to Thapsigargin treatment by measuring the level of any UPR markers. This study used HSPA5 as the marker.
7. TZM-bl β-gal infectivity assay to determine the effect of UPR on virion infectivity
NOTE: To understand the role of UPR in the virion infectivity, the supernatant from the knockdown as well as treatment with Thapsigargin, can be used for TZM-bl β-gal infectivity assay as described in section 1.2, based on the p24 concentration determined by p24 ELISA.
- Infect TZM-bl cells with an equal concentration of p24 from each sample and perform β-gal staining. Count the blue infected cells under the microscope in 10x magnification for 5 random fields.
- Take an average of the count of the 5 fields for each sample from the above steps.
- Calculate the fold change as mentioned below:
Fold change = Average number of blue cells in the test samples/Average number of blue cells in the control sample.
Results
Loading...
$$\rightleftharpoonup{xx}$$
$$\longleftharp{xx}$$,
$$\longrightharp{xx}$$,
In this work, we have described a detailed protocol to study in vitro ER stress and UPR activation upon HIV-1 infection in T-cells (Figure 2). This study also describes methods to analyze the functional relevance of UPR in HIV-1 replication and virion infectivity (Figure 3).
To this purpose, we analyzed the ER stress caused by HIV-1 infection by observing the protein aggregates inside the cell by staining with Thioflavin T. As shown in Figure 4A, the intensity of ThT represents the protein aggregates in the uninfected and infected cells. Similarly, as a positive control, Figure 4B represents the ThT staining in Thapsigargin-treated cells. The enhanced ThT intensity suggests the presence of more protein aggregates, which is correlated with enhanced ER stress.
Further, to validate this observation, a more conventional method was used, which involved the analysis of UPR markers. The UPR activation was initially analyzed by the activation of primary effectors -IRE1, ATF6 and PERK. The activation of IRE1 was measured by analyzing the phospho-IRE1 levels by immunoblotting the lysates of uninfected and infected cells harvested at different time points post-infection, as represented in Figure 5A. The increase in pIRE1/Total IRE1 levels suggests the activation of IRE1. Similarly, activation of PERK was measured by the levels of phospho-PERK in uninfected and infected cells (Figure 5B). The activation of ATF6 was quantified by the expression level of ATF6 P50 form by immunoblotting (Figure 5C). Another important marker of UPR is the master regulator and an ER chaperone, HSPA5. The level of HSPA5 was also analyzed by immunoblotting, as shown in Figure 5D. A similar protocol was followed for other UPR markers, such as sXBP1, peIF2α, ATF4, CHOP, and GADD34, using their specific antibodies (Supplementary Figure 1). The splicing of XBP1 mRNA can be analyzed by both quantitative RT-PCR (Fig 5E) and semi-quantitative RT-PCR. Since quantitative RT-PCR could not identify splicing specifically, it was paired with the splicing assay, where semi-quantitative RT-PCR was used (Figure 5F). With the above-mentioned protocol, we observed that the qRT-PCR data matches the semi-qRT-PCR data. Similar to the qRT-PCR performed for sXBP1, the protocol was used for the analysis of other markers of UPR, such as HSPA5, ATF4, CHOP, and GADD34 at the mRNA level (Supplementary Figure 2)
Next, to investigate the role of UPR in HIV-1 replication and virion infectivity, we performed a knockdown of certain UPR markers: PERK and HSPA5. Using the mentioned protocols, we achieved the knockdown of these markers to a significant level in both HEK-293T cells (Figure 6A) as well as J6 cells (Figure 6B). Using these knockdown cells, we investigated the effect of knockdown of HIV-1 LTR-driven gene activity (Figure 6A), which is represented as Luc/GFP expression ratio in respective samples. The virus production was measured by p24 ELISA of the supernatant, as represented in Figure 6B. The infectivity of the virions produced can also be analyzed using the β-gal staining protocol in the same way as shown in Figure 1A.
Further, using a chemical inducer of ER stress, Thapsigargin, the effect of overstimulation of UPR on HIV-1 replication, virus production, and virion infectivity can be studied. The cytotoxicity of Thapsigargin at the given concentration was analyzed using an MTT assay (Figure 7A), which shows that the cytotoxicity at the desired concentration is non-significant. The immunoblotting for HSPA5 was performed to analyze the effect of the drug on ER stress (Figure 7B). The results show that 12 h pre-treatment of 100 nM Thapsigargin induced the expression of HSPA5 at all-time points. The p24 ELISA shows the effect on virus production and the infectivity of the virions produced, which can be analyzed as described earlier.
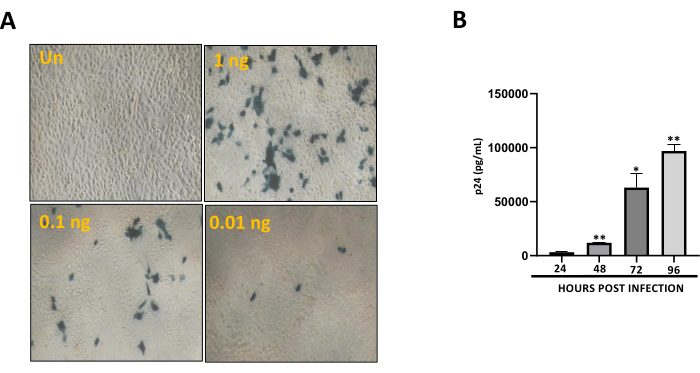
Figure 1: Quantification of virion infectivity and analysis of infection progression. (A) Quantitation of virion infectivity by TZM-bl based β-gal assay. The infectivity of the virus was determined by adding 1 ng, 0.1 ng, and 0.01 ng of the virus to the TZM-bl cells, followed by β-gal staining and counting the number of blue cells. Magnification: 10x. (B) Analysis of infection progression in 0.5 MOI HIV-1 infected CEM-GFP cells based on p24 antigen capture ELISA of the culture supernatants. CEM-GFP cells were infected with 0.5 MOI of HIV-1, and the supernatants were processed for p24 ELISA. The error bars are displayed as mean ± S.E values. Asterisks indicate the significance level, which is indicated in the figures as ns = p ≥ 0.05, * = p ≤ 0.05, ** = p ≤ 0.01, *** = p ≤ 0.001 and ****=p ≤ 0.0001 as analyzed by Student's t-test. Please click here to view a larger version of this figure.
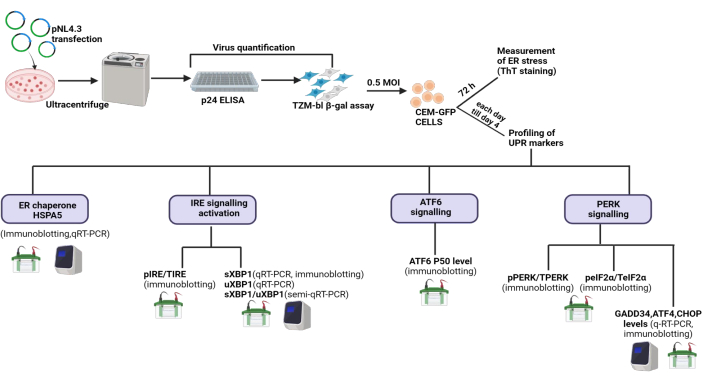
Figure 2: Schematic presentation of steps to be followed to analyze the effect of HIV-1 infection on ER stress and UPR. Please click here to view a larger version of this figure.
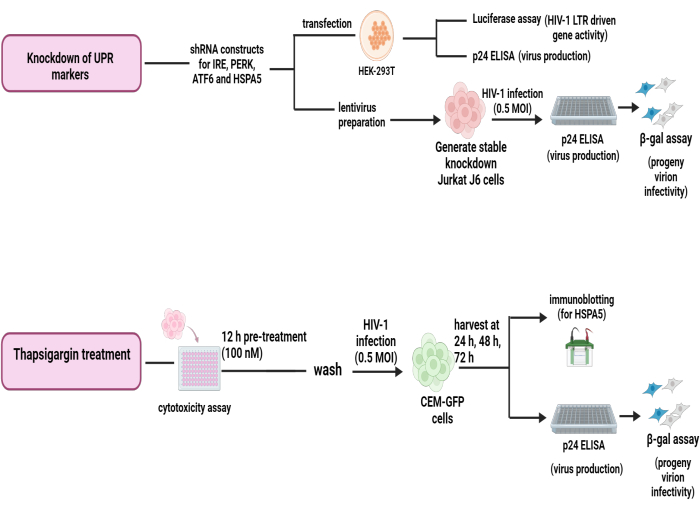
Figure 3: Flow chart of steps to be followed to analyze the effect of UPR on HIV-1 replication, virus production, and virion infectivity. Please click here to view a larger version of this figure.
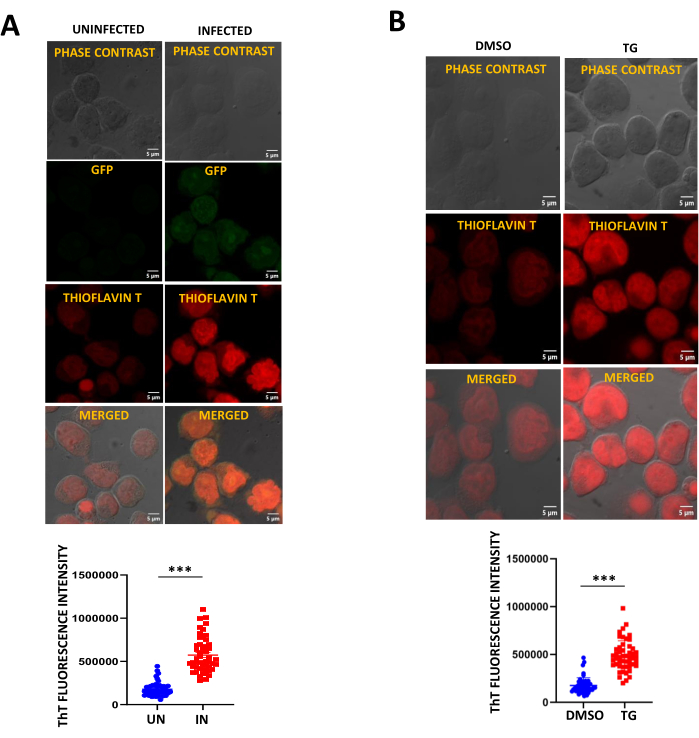
Figure 4: Analyzing the ER stress level in T-cells due to HIV-1 infection using ThT staining. (A) CEM-GFP cells were infected with 0.5 MOI of HIV-1 and harvested 72 h post-infection. Cells were fixed and stained with Thioflavin T. GFP expression indicates infected CEM-GFP cells. The graph shows the intensity of Thioflavin T in the case of uninfected and HIV-1 infected cells. Data from ~50 cells from n = 3 biological replicates are presented in the graph. (B) CEM-GFP cells were treated with DMSO and TG for 12 h. Cells were fixed and stained with Thioflavin T. The graph shows the intensity of Thioflavin T in the case of DMSO and TG-treated cells. Data from ~50 cells from n = 3 biological replicates are presented in the graph. The error bars are displayed as mean ± S.E values. Asterisks indicate the significance level, which is indicated in the figures as ns = p ≥ 0.05, * = p ≤ 0.05, ** = p ≤ 0.01, *** = p ≤ 0.001 and **** = p ≤ 0.0001 as analyzed by Student's t-test. UN: Uninfected; IN: Infected; TG: Thapsigargin. Please click here to view a larger version of this figure.
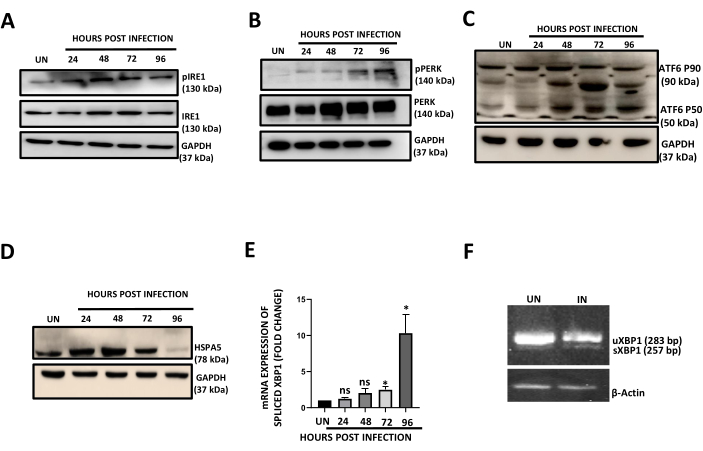
Figure 5: Analysis of the expression of different UPR markers in HIV-1 infected T cells. (A-E) HIV-1 (0.5 MOI) infected CEM-GFP cells were harvested till day 4 every 24 h and were processed for various analyses as described hereafter. (A) Activation of IRE1 was analyzed by immunoblotting of pIRE1. (B) Activation of PERK was analyzed by immunoblotting of pPERK. (C) The activation of ATF6 was analyzed by immunoblotting the ATF6 P50 form. (D) The expression of ER chaperone HSPA5 was analyzed by immunoblotting HSPA5. (E) Splicing of XBP1 was analyzed by qRT-PCR of sXBP1 using specific real-time primers. (F) To analyze the splicing of XBP1 by semi-qRT-PCR, XBP-1 mRNA was amplified using RT-PCR across the splice site, and the bands were visualized. The error bars are displayed as mean ± S.E values. UN: Uninfected. IN: Infected. Please click here to view a larger version of this figure.
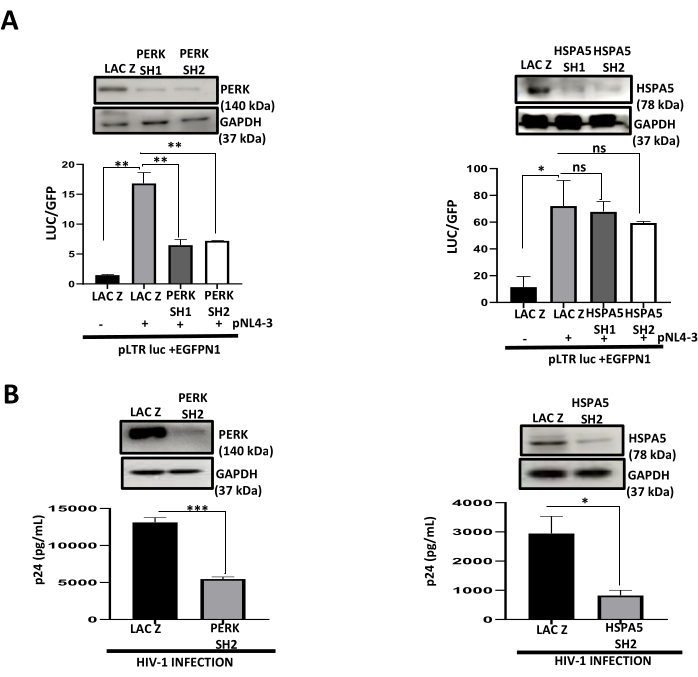
Figure 6: Analysis of the role of UPR on HIV-1 replication and virus production. (A) PERK (Left panel) and HSPA5 (Right panel) were knocked down in HEK-293T cells, and a luciferase assay was performed to analyze the HIV-1 LTR-driven gene activity. The immunoblots show the knockdown levels of the respective proteins. (B) PERK (Left panel) and HSPA5 (Right panel) were knocked down in J6 cells, and p24 ELISA was performed with the supernatant collected to analyze the virus production. The immunoblots show the knockdown levels of the respective proteins. The error bars are displayed as mean ± S.E values. Asterisks indicate the significance level, which is indicated in the figures as ns = p ≥ 0.05, * = p ≤ 0.05, ** = p ≤ 0.01, *** = p ≤ 0.001 and ****=p ≤ 0.0001 as analyzed by Student's t-test. Please click here to view a larger version of this figure.
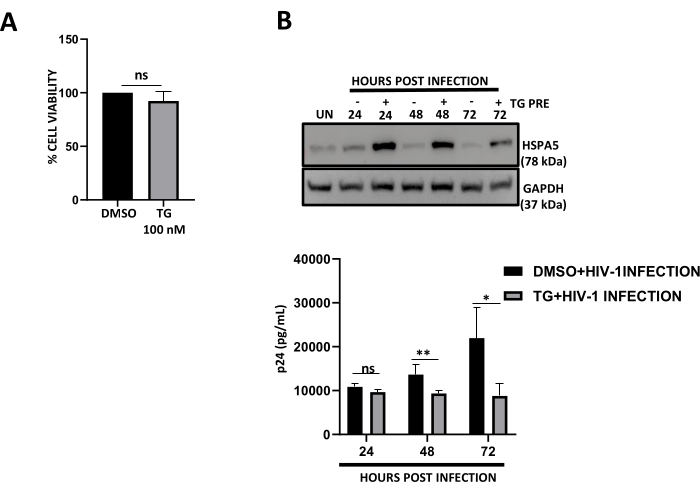
Figure 7: Analysis of the effect of chemical ER stress inducer, Thapsigargin, on HIV-1 infection progression. (A) Cell viability of CEM-GFP cells upon treatment with 100 nM Thapsigargin. Cell viability is analyzed by MTT assay. (B) CEM-GFP cells pre-treated with 100 nM of TG for 12 h were infected with 0.5 MOI of HIV-1 and were harvested at 24 h, 48 h, and 72 h time points post-infection. The immunoblot shows the effect of TG on the expression of HSPA5, whereas the graph shows the virus production as analyzed by p24 ELISA. The error bars are displayed as mean ± S.E values. Asterisks indicate the significance level, which is indicated in the figures as ns = p ≥ 0.05, * = p ≤ 0.05, ** = p ≤ 0.01, *** = p ≤ 0.001 and ****= p ≤ 0.0001 as analyzed by Student's t-test. TG: Thapsigargin. Please click here to view a larger version of this figure.
Supplementary Figure 1: Analysis of the expression of various downstream markers of UPR. Expression of (A) sXBP1, (B) phosphorylation of eIF2α, (C) ATF4, (D) CHOP, and (E) GADD34 as analyzed by immunoblotting. (A-E) CEM-GFP cells infected with 0.5 MOI of HIV-1 were harvested at 24 h, 48 h, 72 h, and 96 h post-infection and were used for immunoblotting. Please click here to download this File.
Supplementary Figure 2: Analysis of different UPR markers at mRNA level by qRT-PCR. (A-D) CEM-GFP cells infected with 0.5 MOI of HIV-1 were harvested every 24 h till day 4 and were used for qRT-PCR of (A) HSPA5, (B) ATF4, (C) CHOP, and (D) GADD34. The error bars are displayed as mean ± S.E values. Asterisks indicate the significance level, which is indicated in the figures as ns = p ≥ 0.05, * = p ≤ 0.05, ** = p ≤ 0.01, *** = p ≤ 0.001 and **** = p ≤ 0.0001 as analyzed by Student's t-test. Please click here to download this File.
| Construct | Primer sequence 5’ to 3’ | |
| XBP1 SPLICING ASSAY F | TTACGAGAGAAAACTCATGGCC | |
| XBP1 SPLICING ASSAY R | GGGTCCAAGTTGTCCAGAATGC | |
| SPLICED XBP1 F | CTGAGTCCGAATCAGGTGCAG | |
| SPLICED XBP1 R | ATCCATGGGGAGATGTTCTGG | |
| HSPA5 F | CACAGTGGTGCCTACCAAGA | |
| HSPA5 R | TGATTGTCTTTTGTCAGGGGT | |
| ATF4 F | AGTCCCTCCAACAACAGCAA | |
| ATF4 R | GAAGGTCATCTGGCATGGTT | |
| CHOP F | CAGTGTCCCGAAGGAGAAAG | |
| CHOP R | CAGAGCTGGAACCTGAGGAG | |
| GADD34 F | ATGGACAGTGACCTTCTCGG | |
| GADD34 R | CTGGGCTCCTCCTAGGCT | |
| ACTIN F | AGAAAATCTGGCACCACACC | |
| ACTIN R | GGGGTGTTGAAGGTCTCAAA | |
Table 2: List of primers used for RT-PCR analysis. F: Forward; R: Reverse
| shRNA Construct | Primer sequence 5’ to 3’ | |||
| PERK SH1 F | CCGGCGGCAGGTCATTAGTAATTATCTCGAGATAATTACTAATGACCTGCCGTTTTTG | |||
| PERK SH1 R | AATTCAAAAACGGCAGGTCATTAGTAATTATCTCGAGATAATTACTAATGACCTGCCG | |||
| PERK SH2 F | CCGGGCCACTTTGAACTTCGGTATACTCGAGTATACCGAAGTTCAAAGTGGCTTTTTG | |||
| PERK SH2 R | AATTCAAAAAGCCACTTTGAACTTCGGTATACTCGAGTATACCGAAGTTCAAAGTGGC | |||
| ATF6 SH1 F | CCGGCCCAGAAGTTATCAAGACTTTCTCGAGAAAGTCTTGATAACTTCTGGGTTTTTG | |||
| ATF6 SH1 R | AATTCAAAAACCCAGAAGTTATCAAGACTTTCTCGAGAAAGTCTTGATAACTTCTGGG | |||
| ATF6 SH2 F | CCGGCCTAGTCCAAAGCGAAGAGTTCTCGAGAACTCTTCGCTTTGGACTAGGTTTTTG | |||
| ATF6 SH2 R | AATTCAAAAACCTAGTCCAAAGCGAAGAGTTCTCGAGAACTCTTCGCTTTGGACTAGG | |||
| IRE1 SH1 F | CCGGCCTGCTTAATGTCAGTCTACACTCGAGTGTAGACTGACATTAAGCAGGTTTTTG | |||
| IRE1 SH1 R | AATTCAAAAACCTGCTTAATGTCAGTCTACACTCGAGTGTAGACTGACATTAAGCAGG | |||
| IRE1 SH2 F | CCGGCCCATCAACCTCTCTTCTGTACTCGAGTACAGAAGAGAGGTTGATGGGTTTTTG | |||
| IRE1 SH2 R | AATTCAAAAACCCATCAACCTCTCTTCTGTACTCGAGTACAGAAGAGAGGTTGATGGG | |||
| HSPA5 SH1 F | CCGGGAGCGCATTGATACTAGAAATCTCGAGATTTCTAGTATCAATGCGCTCTTTTTG | |||
| HSPA5 SH1 R | AATTCAAAAAGAGCGCATTGATACTAGAAATCTCGAGATTTCTAGTATCAATGCGCTC | |||
| HSPA5 SH2 F | CCGGGTGAGTGATCACTGGTATTAACTCGAGTTAATACCAGTGATCACTCACTTTTTG | |||
| HSPA5 SH2 R | AATTCAAAAAGTGAGTGATCACTGGTATTAACTCGAGTTAATACCAGTGATCACTCAC | |||
| LacZ F | CCGGTCGTATTACAACGTCGTGACTCTCGAGAGTCACGACGTTGTAATACGATTTTTG | |||
| LacZ R | AATTCAAAAATCGTATTACAACGTCGTGACTCTCGAGAGTCACGACGTTGTAATACGA | |||
Table 3: List of primers used for generating shRNA constructs. F: Forward; R: Reverse
Discussion
Loading...
$$\rightleftharpoonup{xx}$$
$$\longleftharp{xx}$$,
$$\longrightharp{xx}$$,
The scope of the present protocol includes (i) the handling of HIV-1 virus stocks and the measurement of the virus concentration and virion infectivity, (ii) Infection of T-cells with HIV-1 and assessing its effect on ER stress and different markers of UPR, (iii) Effect of knockdown of UPR markers and their effect on HIV-1 LTR driven gene activity, virus production and virion infectivity and (iv) Overstimulating the UPR using pharmacological molecule and analyzing its effect on HIV-1 replication. Using the present set of protocols, comprehensive information on the interplay of HIV-1 and UPR can be obtained. The protocols listed in this study are easy to perform, cost-effective, and highly reliable.
Since UPR is a stress-sensitive signaling pathway, working on this involves rather delicate steps. For all the experiments, we recommend avoiding long passaged cells in order to obtain consistency in results. It is also important to maintain sterile conditions in all cell culture techniques to avoid bacterial and yeast contaminations, as they can hamper the experiments and the corresponding results. Furthermore, when handling cells during experiments, including their subsequent cultivation, prevent harsh or prolonged temperature alterations and make sure the cells are healthy and unstressed to begin with. Otherwise, the changes might cause additional stress to the cells, which can alter the results. Try to keep the time points as fixed as possible since UPR is a sensitive signaling pathway, and a slight change in the time points can vary the results.
The ThT staining method which detects protein aggregates and is used for determining ER stress22, shows the ER stress levels in the HIV-1 infected cells very clearly. ThT staining is based on the detection of protein aggregates, which is correlated to ER stress. However, it should be noted that the UPR activation cannot always be correlated with protein aggregates as the individual UPR signaling pathways can be activated directly without the involvement of protein aggregates. So, even though this ThT staining method gives an idea of the ER stress levels, for in-depth analysis of UPR activation, it should always be validated with further analysis of UPR markers. Also, to further define the sub-cellular localization of ThT staining, markers such as KDEL in the case of marking the ER can be used. Furthermore, in many cases, ER stress results in a change in cell size and shape, so one can also take the area of cells into consideration while quantitating the ThT intensity. The availability of highly sensitive, reliable, and cost-effective commercial gene-specific antibodies has revolutionized many aspects of the field of life sciences, allowing the easier analysis of protein levels in the cells. Also, nowadays, highly sensitive types of equipment are available to visualize the protein bands on the blots and make the quantification rapid and easier. Thus, the activation of UPR markers can be easily analyzed by immunoblotting. However, as the expression of UPR marker proteins is relatively low, so one needs to use a significant concentration of protein to analyze their expression. Moreover, the dilution of the primary antibodies should be optimized properly based on the protein expression in the cells used in order to avoid nonspecific binding and the background noise in the blots. Also, as shown in Figure 4C, the ATF6 antibody is polyclonal and gives a number of nonspecific bands. The proper optimization of washing and antibody concentration is needed to reduce these nonspecific bands to an extent. The blots should be washed properly after incubation in blocking solution, primary antibody, and secondary antibody to reduce the background and nonspecific bands. While developing the blots, oversaturation of the bands should be avoided to obtain proper visualization of the pattern in the results obtained. Looking at the broad focus of this method article, we have not focused on detailed methods and troubleshooting for general immunoblotting techniques; however, one can refer to method articles by Mahmood and Yang33 as well as Ghosh et al.34 for the same. Since, nowadays RT-PCR is a very commonly used method, the easily available primers and RT-PCR machines provide data to analyze certain UPR markers. However, precautions should be taken while preparing the RNA and cDNA for RT-PCR as it is a very sensitive method, and slight variations in the quality of samples and pipetting can lead to huge variations in the readout. Any DNA or protein contamination should be removed from the RNA samples. Also, always take the samples in triplicates for qRT-PCR so that the pipetting error can be reduced. The concentration of the DNA used for qRT-PCR should be optimized such that the CT value for each sample is below 30, as anything beyond 30 is considered not ideal. A negative control should always be kept for qRT-PCR to avoid any false positive readout. The splicing of XBP1 can be analyzed by both qRT-PCR as well as semi-qRT-PCR. Since, qRT-PCR would not accurately show the splicing, semi-qRT-PCR should always be performed apart from qRT-PCR to validate the data and to determine the relative spliced XBP1 to unspliced XBP1 ratio. Since the difference between the size of spliced and unspliced XBP1 is just 26 nt, a higher percentage of agarose gel should be used to resolve the gel. Also, the bands should be resolved in low voltage and longer duration for better separation. Another method which is more popular nowadays to observe the splicing of XBP1, is the splicing assay which utilizes the Pst1 restriction enzyme digestion of the cDNA and provides better visualization of XBP1 splicing35. This method can also be used in order to visualize the splicing of XBP1 in HIV-1 infected samples. The results obtained from immunoblotting and RT-PCR can be used to validate the ThT staining results.
The representative results shown in Figure 5 suggest that the UPR activation upon HIV-1 infection correlates with the enhanced ThT staining shown in Figure 4. However, the limitations of the use of immunoblotting and RT-PCR to analyze UPR are that they are rigorous, and one has to monitor multiple gene products as the individual UPR genes can be modified independently by non-ER stress factors. Also, these methods indirectly measure the ER stress by looking at the different UPR markers. That is why the ThT staining and the analysis of UPR markers by immunoblotting and RT-PCR can be used together to analyze the effect of HIV-1 infection on ER stress and UPR activation in T-cells.
The second part of this article deals with the protocols involved in understanding the impact of UPR on HIV-1 replication. The reverse transfection method used for the knockdown of UPR markers described in this article was found to give a significant reduction in the expression of UPR markers. As mentioned in the protocol, GFP fluorescence was used to normalize the luciferase reading for luciferase assay. However, in many cases, GFP reading can also be affected due to the specific gene transfection36, so in that case, one can use other fluorescent markers such as RFP, YFP, or the total protein concentration to normalize the luciferase reading. Also, in some cases where the cells are difficult to lyze, such as TZM-bl cells, additional lysis reagent can be added before adding the luciferase substrate. As represented in the results, the luciferase results (Figure 6A Left panel) match with the p24 ELISA results in the case of PERK (Figure 6B Left panel), where PERK knockdown significantly reduces the HIV-1 gene activity and virus production. Whereas in the case of HSPA5, the knockdown of HSPA5 does not affect the LTR-driven gene activity (Figure 6A Right panel) as per the luciferase assay results, while it affects the virus production according to p24 ELISA (Figure 6B Right panel). In this way, these results suggest that different UPR markers can have different effects on HIV-1 LTR-driven gene activity and virus production. The p24 antigen measured in the supernatant by ELISA is primarily indicative of the concentration of virus particles released in the culture supernatant. Thus, routinely, researchers have used p24 antigen capture ELISA results as an indirect indication of virus production in the cell supernatant37. Thus, the luciferase assay in cells and p24 ELISA of the supernatant can be used together to determine the effect on HIV-1 LTR-driven gene activity and the virus production. Also, this protocol can be used to analyze the effect of other UPR markers on HIV-1 LTR-driven gene activity and virus production by using gene-specific shRNAs. For all those experiments involving readouts of p24 ELISA and luciferase assay, it is important to make sure that proper dilutions and incubation time are maintained and values coming under the outlier's category should not be considered. For example, while doing p24 ELISA, an OD450 value between 0.1-2 is considered ideal. The second approach to investigate the role of UPR in HIV-1 replication is the use of pharmacological molecules such as Thapsigargin, an ER stress inducer or TUDCA, an ER stress inhibitor. These drugs are very commonly used to study UPR in various contexts38,39,40,41. In this article, we have demonstrated the protocol for Thapsigargin treatment and analyzed its effect on HIV-1 infection progression in T-cells. Prior to using the drug for any experiment, it is strongly recommended to test the cell viability for a range of doses for the drug in the cell line to be used. The concentration that gives less than ~80% cell viability in the given cell line should be avoided. Furthermore, for cell viability assays, healthy cells should always be taken, as cells that are already stressed will not show the proper readout, and cell debris can create turbidity and give false readouts. The protocol mentioned in this study shows the effect of Thapsigargin on viral replication over 72 h post-infection, which provides a better understanding of the effect of the drug on viral replication over a time course. One can also take shorter time intervals such as 12 h, 24 h, 36 h, 48 h, 60 h, and 72 h post infection to further analyze the earliest time point at which the drug starts showing its effect on the viral replication.
Since UPR is also involved with protein degradation and membrane dynamics42,43, it is possible that UPR can have a role in the infectivity of virions. The infectivity of the virions produced by the cells can also be analyzed using the given protocol. The above-mentioned protocols can also be used to determine the effect of HIV-1 infection on ER stress and UPR and its functional relevance in human PBMCs for more biologically relevant studies. Understanding the function of ER-UPR in HIV-1 infection is essential due to the increasing awareness of its involvement in the development of numerous serious illnesses. The information obtained using this set of methods will add to this unexplored field by offering an important understanding of the interaction between HIV-1 and UPR.
Disclosures
Loading...
$$\rightleftharpoonup{xx}$$
$$\longleftharp{xx}$$,
$$\longrightharp{xx}$$,
The authors have no conflicts of interest to declare.
Acknowledgements
Loading...
$$\rightleftharpoonup{xx}$$
$$\longleftharp{xx}$$,
$$\longrightharp{xx}$$,
We thank the National Centre for Cell Science, Department of Biotechnology, Government of India, for intramural support. AT and AD are grateful for the Ph.D. research support received from the National Centre for Cell Science, Department of Biotechnology, Government of India. DM is thankful for the JC Bose National Fellowship from SERB, Government of India.
Materials
| Name | Company | Catalog Number | Comments |
|---|---|---|---|
| Acrylamamide | Biorad, USA | 1610107 | |
| Agarose | G-Biosciences, USA | RC1013 | |
| Ammonium persulphate | Sigma-Aldrich, USA | A3678 | |
| anti-ATF4 antibody | Cell Signaling Technology, USA | 11815 | Western blot detection Dilution-1:1000 |
| anti-ATF6 antibody | Abcam, UK | ab122897 | Western blot detection Dilution-1:1000 |
| anti-CHOP antibody | Cell Signaling Technology, USA | 2897 | Western blot detection Dilution-1:1000 |
| anti-eIF2α antibody | Santa Cruz Biotechnology, USA | sc-11386 | Western blot detection Dilution-1:2000 |
| anti-GADD34 antibody | Abcam, UK | ab236516 | Western blot detection Dilution-1:1000 |
| anti-GAPDH antibody | Santa Cruz Biotechnology, USA | sc-32233 | Western blot detection Dilution-1:3000 |
| anti-HSPA5 antibody | Cell Signaling Technology, USA | 3177 | Western blot detection Dilution-1:1000 |
| anti-IRE1 antibody | Cell Signaling Technology, USA | 3294 | Western blot detection Dilution-1:2000 |
| Anti-mouse HRP conjugate antibody | Biorad, USA | 1706516 | Western blot detection Dilution- 1:4000 |
| anti-peIF2α antibody | Invitrogen, USA | 44-728G | Western blot detection Dilution-1:1000 |
| anti-PERK antibody | Cell Signaling Technology, USA | 5683 | Western blot detection Dilution-1:2000 |
| anti-pIRE1 antibody | Abcam, UK | ab243665 | Western blot detection Dilution-1:1000 |
| anti-pPERK antibody | Invitrogen, USA | PA5-40294 | Western blot detection Dilution-1:2000 |
| Anti-rabbit HRP conjugate antibody | Biorad, USA | 1706515 | Western blot detection Dilution- 1:4000 |
| anti-XBP1 antibody | Abcam, UK | ab37152 | Western blot detection Dilution-1:1000 |
| Bench top high speed centrifuge | Eppendorf, USA | 5804R | Rotor- F-45-30-11 |
| Bench top low speed centrifuge | Eppendorf, USA | 5702R | Rotor- A-4-38 |
| Bis-Acrylamide | Biorad, USA | 1610201 | |
| Bovine Serum Albumin (BSA) | MP biomedicals, USA | 160069 | |
| Bradford reagent | Biorad, USA | 5000006 | |
| CalPhos mammalian Transfection kit | Clontech, Takara Bio, USA | 631312 | Virus stock preparation |
| CEM-GFP | NIH, AIDS Repository, USA | 3655 | |
| Clarity ECL substrate | Biorad, USA | 1705061 | chemiluminescence detecting substrate |
| Clarity max ECL substrate | Biorad, USA | 1705062 | chemiluminescence detecting substrate |
| Confocal laser scanning microscope | Olympus, Japan | Model:FV3000 | |
| Cytospin centrifuge | Thermo Fisher Scientific, USA | ASHA78300003 | |
| DMEM | Invitrogen, USA | 11995073 | |
| DMSO | Sigma-Aldrich, USA | D2650 | |
| dNTPs | Promega, USA | U1515 | |
| DTT | Invitrogen, USA | R0861 | |
| EDTA | Invitrogen, USA | 12635 | |
| EtBr | Invitrogen, USA | `15585011 | |
| Fetal Bovine Serum | Invitrogen, USA | 16000044 | |
| G418 | Invitrogen, USA | 11811023 | |
| Glutaraldehyde 25% | Sigma-Aldrich, USA | G6257 | Infectivity assay |
| Glycine | Thermo Fisher Scientific, USA | Q24755 | |
| HEK-293T | NCCS, India | ||
| HIV-1 infectious Molecular Clone pNL4-3 | NIH, AIDS Repository, USA | 114 | |
| Inverted microscope | Nikon, Japan | Model: Eclipse Ti2 | |
| iTaq Universal SYBR Green Supermix | Biorad, USA | 1715124 | |
| Jurkat J6 | NCCS, India | ||
| Magnesium chloride | Sigma-Aldrich, USA | M8266 | Infectivity assay |
| MMLV-RT | Invitrogen, USA | 28025013 | |
| MTT reagent | Sigma-Aldrich, USA | M5655 | Cell viability assay |
| N,N-dimethyl formamide | Fluka Chemika | 40255 | Infectivity assay |
| NaCl | Thermo Fisher Scientific, USA | Q27605 | |
| NaF | Sigma-Aldrich, USA | 201154 | |
| NP40 | Invitrogen, USA | 85124 | |
| P24 antigen capture ELISA kit | ABL, USA | 5421 | |
| PageRuler prestained protein ladder | Sci-fi Biologicals, India | PGPMT078 | |
| Paraformaldehyde | Sigma-Aldrich, USA | P6148 | |
| pEGFP-N1 | Clontech, USA | 632515 | |
| Penicillin/Streptomycin | Invitrogen, USA | 151140122 | |
| Phosphatase Inhibitor | Sigma-Aldrich, USA | 4906837001 | |
| Phusion High-fidelity PCR mastermix with GC buffer | NEB,USA | M05532 | |
| pLKO.1-TRC | Addgene, USA | 10878 | Lentiviral cloning vector |
| pMD2.G | Addgene, USA | 12259 | VSV-G envelope vector |
| PMSF | Sigma-Aldrich, USA | P7626 | |
| Polyethylenimine (PEI) | Polysciences, Inc., USA | 23966 | |
| Potassium ferricyanide | Sigma-Aldrich, USA | 244023 | Infectivity assay |
| Potassium ferrocyanide | Sigma-Aldrich, USA | P3289 | Infectivity assay |
| Protease Inhibitor | Sigma-Aldrich, USA | 5056489001 | |
| psPAX2 | Addgene, USA | 12260 | Lentiviral packaging plasmid |
| Puromycin | Sigma-Aldrich, USA | P8833 | Selection of stable cells |
| PVDF membrane | Biorad, USA | 1620177 | |
| Random primers | Invitrogen, USA | 48190011 | |
| RPMI 1640 | Invitrogen, USA | 22400105 | |
| SDS | Sigma-Aldrich, USA | L3771 | |
| Steady-Glo substrate | Promega, USA | E2510 | Luciferase assay |
| T4 DNA ligase | Invitrogen, USA | 15224017 | |
| TEMED | Invitrogen, USA | 17919 | |
| Thapsigargin | Sigma-Aldrich, USA | T9033 | |
| Thioflavin T | Sigma-Aldrich, USA | 596200 | |
| Tris | Thermo Fisher Scientific, USA | Q15965 | |
| Triton-X-100 | Sigma-Aldrich, USA | T8787 | |
| Trizol | Invitrogen, USA | 15596018 | |
| Tween 20 | Sigma-Aldrich, USA | P1379 | |
| TZM-bl | NIH, AIDS Repository, USA | 8129 | |
| Ultracentrifuge | Beckman Optima L90K, USA | 330049 | Rotor-SW28Ti |
| UltraPure X-gal | Invitrogen, USA | 15520-018 | Infectivity assay |
References
Loading...
$$\rightleftharpoonup{xx}$$
$$\longleftharp{xx}$$,
$$\longrightharp{xx}$$,
- Levy, J. A. HIV and the Pathogenesis of AIDS. 3rd. , ASM Press. (2007).
- Hebert, D. N., Molinari, M. In and out of the ER: Protein folding, quality control, degradation, and related human diseases. Physiol Rev. 87 (4), 1377-1408 (2007).
- Mori, K. The unfolded protein response: The dawn of a new field. Proc Jpn Acad Ser B Phys Biol Sci. 91 (9), 469-480 (2015).
- Balch, W. E., Morimoto, R. I., Dillin, A., Kelly, J. W. Adapting proteostasis for disease intervention. Science. 319 (5865), 916-919 (2008).
- Kaufman, R. J. Orchestrating the unfolded protein response in health and disease. J Clin Invest. 110 (10), 1389-1398 (2002).
- Ron, D., Walter, P. Signal integration in the endoplasmic reticulum unfolded protein response. Nat Rev Mol Cell Biol. 8 (7), 519-529 (2007).
- Marciniak, S. J., Garcia-Bonilla, L., Hu, J., Harding, H. P., Ron, D. Activation-dependent substrate recruitment by the eukaryotic translation initiation factor 2 kinase PERK. J Cell Biol. 172 (2), 201-209 (2006).
- Harding, H. P., Zhang, Y., Ron, D. Protein translation and folding are coupled by an endoplasmic-reticulum-resident kinase. Nature. 397 (6716), 271-274 (1999).
- Vattem, K. M., Wek, R. C. Reinitiation involving upstream ORFs regulates ATF4 mRNA translation in mammalian cells. Proc Natl Acad Sci U S A. 101 (31), 11269-11274 (2004).
- Harding, H. P., et al. An integrated stress response regulates amino acid metabolism and resistance to oxidative stress. Mol Cell. 11 (3), 619-633 (2003).
- Novoa, I., Zeng, H., Harding, H. P., Ron, D. Feedback inhibition of the unfolded protein response by GADD34-mediated dephosphorylation of eIF2α. J Cell Biol. 153 (5), 1011-1021 (2001).
- Haze, K., Yoshida, H., Yanagi, H., Yura, T., Mori, K. Mammalian transcription factor ATF6 is synthesized as a transmembrane protein and activated by proteolysis in response to endoplasmic reticulum stress. Mol Biol Cell. 10 (11), 3787-3799 (1999).
- Ye, J., et al. ER stress induces cleavage of membrane-bound ATF6 by the same proteases that process SREBPs. Mol Cell. 6 (6), 1355-1364 (2000).
- Tirasophon, W., Welihinda, A. A., Kaufman, R. J. A stress response pathway from the endoplasmic reticulum to the nucleus requires a novel bifunctional protein kinase/endoribonuclease (Ire1p) in mammalian cells. Genes Dev. 12 (12), 1812-1824 (1998).
- Yoshida, H., Matsui, T., Yamamoto, A., Okada, T., Mori, K. XBP1 mRNA is induced by ATF6 and spliced by IRE1 in response to ER stress to produce a highly active transcription factor. Cell. 107 (7), 881-891 (2001).
- Calfon, M., et al. IRE1 couples endoplasmic reticulum load to secretory capacity by processing the XBP-1 mRNA. Nature. 415 (6867), 92-96 (2002).
- Wu, J., et al. ATF6α optimizes long-term endoplasmic reticulum function to protect cells from chronic stress. Dev Cell. 13 (3), 351-364 (2007).
- Shoulders, M. D., et al. Stress-independent activation of XBP1s and/or ATF6 reveals three functionally diverse ER proteostasis environments. Cell Rep. 3 (4), 1279-1292 (2013).
- Oslowski, C. M., Urano, F. Measuring ER stress and the unfolded protein response using mammalian tissue culture system. Methods Enzymol. 490, 71-92 (2011).
- Gupta, S., Samali, A., Fitzgerald, U., Deegan, S. Methods for monitoring endoplasmic reticulum stress and the unfolded protein response. Int J Cell Biol. 2010, 830307(2010).
- Wang, M., Kaufman, R. J. Protein misfolding in the endoplasmic reticulum as a conduit to human disease. Nature. 529 (7586), 326-335 (2016).
- Beriault, D. R., Werstuck, G. H. Detection and quantification of endoplasmic reticulum stress in living cells using the fluorescent compound, Thioflavin T. Biochim Biophys Acta. 1833 (10), 2293-2301 (2013).
- Tripathi, A., Iyer, K., Mitra, D. HIV-1 replication requires optimal activation of the unfolded protein response. FEBS Lett. 597 (23), 2908-2930 (2023).
- Platt, E. J., Wehrly, K., Kuhmann, S. E., Chesebro, B., Kabat, D. Effects of CCR5 and CD4 cell surface concentrations on infections by macrophagetropic isolates of human immunodeficiency virus type 1. J Virol. 72 (4), 2855(1998).
- Gervaix, A., West, D., Leoni, L. M., Richman, D. D., Wong-Staal, F., Corbeil, J. A new reporter cell line to monitor HIV infection and drug susceptibility in vitro. Proc Natl Acad Sci U S A. 94 (9), 4653-4658 (1997).
- Augustine, T., et al. Cyclin F/FBXO1 interacts with HIV-1 viral infectivity factor (Vif) and restricts progeny virion infectivity by ubiquitination and proteasomal degradation of vif protein through SCFcyclin F E3 ligase machinery. J Biol Chem. 292 (13), 5349-5363 (2017).
- Shihan, M. H., Novo, S. G., Le Marchand, S. J., Wang, Y., Duncan, M. K. A simple method for quantitating confocal fluorescent images. Biochem Biophys Rep. 25, 100916(2021).
- Treiman, M., Caspersen, C., Christensen, S. B. A tool coming of age: Thapsigargin as an inhibitor of sarco-endoplasmic reticulum Ca2+-ATPases. Trends Pharmacol Sci. 19 (4), 131-135 (1998).
- Moffat, J., et al. A lentiviral RNAi library for human and mouse genes applied to an arrayed viral high-content screen. Cell. 124 (6), 1283-1298 (2006).
- Sodroski, J., Rosen, C., Goh, W. C., Haseltine, W. A Transcriptional activator protein encoded by the x-lor region of the human T-cell leukemia virus. Science. 228 (4706), 1430-1434 (1985).
- Rosen, C. A., Sodroski, J. G., Kettman, R., Haseltine, W. A. Activation of enhancer sequences in type II human T-cell leukemia virus and bovine leukemia virus long terminal repeats by virus-associated trans-acting regulatory factors. J Virol. 57 (3), 738-744 (1986).
- Dandekar, D. H., Kumar, M., Ladha, J. S., Ganesh, K. N., Mitra, D. A quantitative method for normalization of transfection efficiency using enhanced green fluorescent protein. Anal Biochem. 342 (2), 341-344 (2005).
- Mahmood, T., Yang, P. C. Western blot: Technique, theory, and trouble shooting. N Am J Med Sci. 4 (9), 429-434 (2012).
- Ghosh, R., Gilda, J. E., Gomes, A. V. The necessity of and strategies for improving confidence in the accuracy of western blots. Expert Rev Proteomics. 11 (5), 549-560 (2014).
- Peña, J., Harris, E. Dengue virus modulates the unfolded protein response in a time-dependent manner. J Biol Chem. 286 (16), 14226-14236 (2011).
- Soboleski, M. R., Oaks, J., Halford, W. P. Green fluorescent protein is a quantitative reporter of gene expression in individual eukaryotic cells. FASEB J. 19 (3), 440-442 (2005).
- Martinez, Z. S., Castro, E., Seong, C. S., Cerón, M. R., Echegoyen, L., Llano, M. Fullerene derivatives strongly inhibit HIV-1 replication by affecting virus maturation without impairing protease activity. Antimicrob Agents Chemother. 60 (10), 5731-5741 (2016).
- Askari, S., Javadpour, P., Rashidi, F. S., Dargahi, L., Kashfi, K., Ghasemi, R. Behavioral and molecular effects of Thapsigargin-induced brain ER- stress: Encompassing inflammation, MAPK, and insulin signaling pathway. Life. 12 (9), 1374(2022).
- Jaskulska, A., Janecka, A. E., Gach-Janczak, K. Thapsigargin-from traditional medicine to anticancer drug. Int J Mol Sci. 22 (1), 4(2021).
- Shaban, M. S., et al. Multi-level inhibition of coronavirus replication by chemical ER stress. Nat Commun. 12 (1), 5536(2021).
- Marciniak, S. J., Chambers, J. E., Ron, D. Pharmacological targeting of endoplasmic reticulum stress in disease. Nat Rev Drug Discov. 21 (2), 115-140 (2022).
- Sriburi, R., Jackowski, S., Mori, K., Brewer, J. W. XBP1: A link between the unfolded protein response, lipid biosynthesis, and biogenesis of the endoplasmic reticulum. J Cell Biol. 167 (1), 35-41 (2004).
- Siwecka, N., Rozpędek-Kamińska, W., Wawrzynkiewicz, A., Pytel, D., Diehl, J. A., Majsterek, I. The structure, activation and signaling of IRE1 and its role in determining cell fate. Biomedicines. 9 (2), 156(2021).
Reprints and Permissions
Request permission to reuse the text or figures of this JoVE article
Request Permission