This protocol describes a method to simultaneously measure cytosolic, free calcium [Ca2+]i and vessel diameter in contracting lymph vessels in real time and then calculate absolute Ca2+ concentrations as well as contractility/rhythmicity parameters. This protocol can be used to study Ca2+ and contractile dynamics across a variety of experimental conditions.
Method Article
Real-time Evaluation of Absolute, Cytosolic, Free Ca2+ and Corresponding Contractility in Isolated, Pressurized Lymph Vessels
In This Article
Summary
Abstract
The lymphatic vasculature, now often referred to as "the third circulation," is located in many vital organ systems. A principal mechanical function of the lymphatic vasculature is to return fluid from extracellular spaces back to the central venous ducts. Lymph transport is mediated by spontaneous rhythmic contractions of lymph vessels (LVs). LV contractions are largely regulated by the cyclic rise and fall of cytosolic, free calcium ([Ca2+]i).
This paper presents a method to concurrently calculate changes in absolute concentrations of [Ca2+]i and vessel contractility/rhythmicity in real time in isolated, pressurized LVs. Using isolated rat mesenteric LVs, we studied changes in [Ca2+]i and contractility/rhythmicity in response to drug addition. Isolated LVs were loaded with the ratiometric Ca2+-sensing indicator Fura-2AM, and video microscopy coupled with edge-detection software was used to capture [Ca2+]i and diameter measurements continuously in real time.
The Fura-2AM signal from each LV was calibrated to the minimum and maximum signal for each vessel and used to calculate absolute [Ca2+]i. Diameter measurements were used to calculate contractile parameters (amplitude, end diastolic diameter, end systolic diameter, calculated flow) and rhythmicity (frequency, contraction time, relaxation time) and correlated with absolute [Ca2+]i measurements.
Introduction
The lymphatic vasculature is found in many organ systems including the brain, heart, lungs, kidney, and mesentery1,2,3,4,5,6, and operates by propelling fluid (lymph) from the interstitial spaces to the central venous ducts to maintain fluid homeostasis7,8,9,10. It starts with blind-ended lymphatic capillaries within the vascular capillary beds that drain into collecting lymph vessels (LVs). Collecting LVs are made of two layers of cells: a layer of endothelial cells encompassed by a layer of lymphatic muscle cells (LMCs)10,11. Lymph fluid transport is achieved through both extrinsic forces (e.g. new lymph formation, arterial pulsations, central venous pressure fluctuations) and intrinsic forces12.
The intrinsic force for lymph transport is the spontaneous rhythmic contraction of collecting LVs, which is the focus of the majority of studies investigating lymphatic function. This intrinsic lymphatic pump is principally regulated by the cyclic rise and fall of cytosolic, free Ca2+ ([Ca2+]i). Spontaneous depolarization of the plasma membrane in LMCs activates voltage-gated "L-type" Ca2+ (Cav1.x) channels triggering Ca2+ influx and subsequent LV rhythmic contraction8,9,10. This role was demonstrated by blocking Cav1.x with specific agents, like nifedipine, which inhibited LV contractions and caused vessel dilation13,14. The transient rise in [Ca2+]i or "Ca2+ spike" in the LMCs mediated by Cav1.x channels also may mobilize intracellular Ca2+ stores by activating inositol triphosphate (IP3) receptors and ryanodine receptors (RyRs) on the sarcoplasmic reticulum (SR)15,16,17,18. Current evidence suggests IP3 receptors contribute more Ca2+ required for normal LV contractions compared to RyRs15,16,19,20,21; however, RyRs may play a role during pathology or in response to pharmaceutical intervention17,18. Additionally, the activation of Ca2+-activated K+ channels22 and ATP-sensitive potassium (KATP) channels23,24 can hyperpolarize the LMC membrane and inhibit spontaneous contractile activity.
There are many other ion channels and proteins that may regulate Ca2+ dynamics in collecting LVs. Utilizing methods to study changes in Ca2+ and vessel contractility in response to pharmacological agents in real time is important to understand these potential regulators. An earlier method using Fura-2 to measure relative changes in LV [Ca2+]i has been described25. Because the dissociation constant for Fura-2 and Ca2+ is known26, it is possible to calculate actual concentrations of Ca2+, which broadens the application of this method and provides additional insight into Ca2+ signaling, membrane excitability, and contractility mechanisms27, as well as allowing for baseline comparisons between experimental groups. This latter approach has been used in cardiomyocytes28, and therefore, can be adapted to LVs. This paper presents an improved method that combines these two approaches to measure and calculate changes in absolute [Ca2+]i as well as vessel contractility/rhythmicity continuously in real time in isolated, pressurized LVs. We also provide representative results for LVs treated with nifedipine.
Protocol
Nine to 13-week-old male Sprague-Dawley rats were purchased from a commercial vendor. After arrival, all rats were housed and maintained at the University of Arkansas for Medical Sciences (UAMS) Division of Lab Animal Medicine (DLAM) facility on a standard laboratory diet and exposed to 12 h of light:dark cycle at 25 oC. All procedures were carried out as per the approved animal use protocol #4127 by the Institutional Animal Care and Use Committee (IACUC) of UAMS.
1. Dissection and cannulation of mesenteric LVs
NOTE: It is important to set up the perfusion chamber prior to the isolation of the mesenteric LVs to make sure there is no interruption of flow or leak that would disrupt the experiment.
- Perfusion bath preparation
- Purchase borosilicate glass micropipettes (1.2 mm outer diameter, 0.68 mm inner diameter, and pulled to an outer tip diameter of 75-100 µm) from a commercial vendor. Cut and polish micropipettes (aka cannula) to approximately 1-2 cm in length for mounting into the isolated vessel perfusion chamber.
- Connect each mounted glass cannula in the vessel perfusion chamber to independent pressure transducers situated in line with independent gravity-fed pressure regulators using polyethylene tubing.
NOTE: This allows for independent manipulation of inflow and outflow pressures depending on the study design. Figure 1 shows this setup in detail. - Backfill the perfusion chamber (5 mL), glass micropipettes, and independent gravity-fed pressure regulator along with polyethylene tubing with physiological salt solution (PSS; 119 mM NaCl; 24 mM NaHCO3; 1.17mM NaH2PO4; 4.7 mM KCl; 1.17 mM MgSO4; 5.5 mM C6H12O6 (glucose); 0.026 mM C10H16N2O8 (EDTA); and 1.6 mM CaCl2) devoid of any air bubbles. Then, clamp the pressure so that the cannulas are not pressurized.
NOTE: The pH of this solution is ~7.5. A pH of 7.4 is maintained in the perfusion bath utilizing CO2 bubbling to act on the bicarbonate buffering system within the PSS as described in step 1.3.7. EDTA is used here to chelate excess Ca2+ ions.
- Preparation of knots
- Tie double overhand knots under the microscope using braided silk suture thread (size 8-0). Key steps are illustrated in Figure 2.
- Separate a single filament.
- Use two Dumont #5 forceps with microblunted tips and using one forceps make a double loop around the tip of the other forceps.
- With the looped forceps, grab the loose end of the suture and pull it through both loops making sure not to pull the knot completely closed and leaving a small opening.
- Use Vanna spring scissors to cut excess suture from either side. Use these knots later to secure the LV onto the cannulas.
NOTE: Do not use the same forceps you will dissect or cannulate with because there is more danger of damaging forceps tips during knot tying.
- Tie double overhand knots under the microscope using braided silk suture thread (size 8-0). Key steps are illustrated in Figure 2.
- Isolation and cannulation of mesenteric LVs
- Deeply anesthetize animals by administering a 5% isoflurane with 1.5 L/min O2 overdose and exsanguinate by decapitation.
- Isolate whole mesenteries for dissection of mesenteric LVs by first making a lengthwise cut along the midline of the abdominal wall, exteriorizing the mesentery, and then snipping the connection just below the pyloric sphincter and ~2-3 cm above the cecum as well as the connection to the rectum.
- Wash the dissected whole mesenteries in 200 mL of ice-cold PSS and then transfer to and pin down in a silicone-lined (8-10 mm) Petri-dish (100 mm) containing ice-cold PSS.
- Dissect second-order mesenteric LVs from surrounding fat and connective tissue using a stereomicroscope, dissection Dumont #5 Inox fine forceps, and Vanna spring scissors. To help identify the ends of the LVs once removed from the tissue, leave a small piece of fat on the proximal end of the LV.
- Transfer the dissected LVs to the vessel perfusion chamber for cannulation on glass cannulas.
- Use two presharpened Dumont #5 Inox Fine Forceps, straight tip (0.05 x 0.01 mm) to cannulate LVs with the distal end of the LV on the P1 cannula (inflow) and the proximal end of the vessel on the P2 cannula (outflow) to mimic the direction of lymph flow.
NOTE: P1 and P2 cannulas are identical and only differ by which end of the LV is connected. It is important to use forceps that meet perfectly at the tip and without damage to facilitate grabbing the thin vessel wall.- Slide a single pretied knot onto each glass cannula to later secure the vessel onto the cannulas.
- Using the small piece of fat to help orient LV direction, first cannulate the distal end onto P1.
- Slide the knot down the cannula and tighten to secure the LV. Make sure not to overtighten and break the cannula tip.
- Pressurize the LV to 4-5 mm Hg in the perfusion chamber.
NOTE: For our purposes, we set P1 and P2 pressure to be equal; however, depending on the experimental conditions, the pressure may be adjusted at each cannula to induce shear stress or backflow. - Repeat steps 1.3.6.1-1.3.6.4 to cannulate the proximal end of the LV onto P2.
- Place the bubbling stone with 7% carbon dioxide (CO2)/93% oxygen (O2) in the bath chamber to maintain physiological pH.
- Connect the chamber to the temperature regulator and set it at 37 oC for LVs to equilibrate and develop stable, spontaneous contractions (approximately 30 min).
NOTE: Figure 1 shows this setup in detail.
2. Measurement of absolute concentrations of [Ca2+]i in LVs
- Fura-2AM staining of cannulated LVs
- After spontaneous contractions develop (from step 1.3.8), incubate LVs with Fura-2-acetoxymethyl ester (Fura-2AM; 2 µM or 10 µL/5 mL) and pluronic acid (PA; 0.02% W/V or 5 µL/5 mL of 20% PA) for 30 min in the dark.
NOTE: After the addition of Fura-2AM, all remaining steps must be performed in the dark. - After 30 min, exchange the solution in the perfusion chamber 3x by emptying the complete bath volume with a negative pressure vacuum, replacing it with temperature-matched (37 oC) reagent-free PSS.
NOTE: This should be done quickly to minimize the time the LV is suspended in the air. Use both hands, for example, the right hand for vacuum and the left hand for replacing new reagent-free PSS. - After washing, incubate LVs for 15 min in the dark to remove excess indicator and allow for de-esterification.
- After spontaneous contractions develop (from step 1.3.8), incubate LVs with Fura-2-acetoxymethyl ester (Fura-2AM; 2 µM or 10 µL/5 mL) and pluronic acid (PA; 0.02% W/V or 5 µL/5 mL of 20% PA) for 30 min in the dark.
- Capturing Ca2+ fluorescence and vessel diameter
- Transfer the chamber onto the inverted fluorescent microscope stage equipped with an LED light source, a 20x S Fluor objective, a cell framing adaptor, and a fast CMOS video camera system, which enables frame-by-frame fluorescence capture at 15 Hz.
NOTE: A schematic of this workflow setup is presented in Figure 3. Ca2+ signal may be captured using a CCD camera with at least 15 fps. - Connect the microscope to the computer equipped with imaging software to record fluorescence and edge detection.
NOTE: The referenced software also enables simultaneous pressure recording; however, that is not included here. - Turn on the LED light source and Fluorescent System interface.
NOTE: The software instructions described here are for the referenced software, but other software can be used to obtain this data. - Open software (IonWizard).
- Under File tab, select New.
- Under Collect tab, select Experiment.
- Load the desired experimental template and click OK.
NOTE: You will need to set up an experimental template with the parameters to be measured. Instructions for template setup can be found in the software manual29. - Adjust the on-screen traces to see Vessel Diameter, Numerator (340 signal), Denominator (380 signal), and Ratio in descending order.
- Adjust the y-axis scale as needed to help visualize the traces.
- Under Traces, select Edit User Limits. Ensure that Automatic Limits is unchecked.
- Select the parameter you wish to adjust, enter the minimum and maximum values for the axis, and then select OK.
- To begin the experiment click START (at the bottom of the screen).
- To measure LV diameter simultaneously, use the edge-detection software incorporated into the imaging system, which generates contractile traces of LVs at 3 Hz. Use these measurements to analyze contractile and rhythmicity parameters described in section 3 and shown in Figure 4.
- Be sure to adjust the lighting so that the LV wall appears as dark lines.
- Select a region of interest (ROI) that is devoid of fat and debris. Once the experiment has started, do not move this ROI.
- Ensure the threshold is set so that the vessel wall edge is detected throughout the entire contraction cycle.
- For fluorescence measurements, turn on the Photomultiplier Tube (PMT).
- Excite Fura-2, a ratiometric indicator, by alternating 340 and 380 nm wavelengths in 50 ms exposures using LED illuminators, and capture the emission spectra at 510 nm at 15 Hz across the whole imaging field.
NOTE: It is important to keep all optical parameters (excitation settings, emission filters, objective lens, and dichroic mirrors) the same for an entire series of experiments to obtain reproducible Ca2+ measurements. - Measure the signal-to-background ratio by first obtaining the 340 and 380 fluorescence with the LV in the middle of the field of view (signal) and then, using the stage manipulators to move the field of view to the edge of the bath with no vessel (taking care to avoid the silicone- lined edge and/or by removing any debris from the bath) to capture the background.
NOTE: It is important to navigate back to the original section of the vessel each time for Ca2+ measurements. - Exchange the bath solution with temperature-matched reagent-free PSS to remove the excess indicator in the bath. It may take several bath exchanges to remove excess Fura-2, so repeat this exchange until the signal to background ratio is approximately 10:1.
- Record baseline Fura-2 fluorescence signal and spontaneous contractions for approximately 30 min followed by a cumulative concentration response of nifedipine (NIF; 0.1-100 nM), a voltage-dependent Cav1.x antagonist. Obtain background measurements for each drug concentration.
- At the end of each experiment, wash LVs with temperature-matched Ca2+-free PSS to obtain the minimum Fura-2 fluorescence signal (Rmin) and maximum diameter of the LVs in the absence of Ca2+. Be sure to measure the background.
NOTE: The Ca2+-free PSS has the same composition as PSS but without CaCl2, and EDTA is replaced with 1 mM EGTA (C14H24N2O10) (pH ~7.5). - Exchange the bath solution with temperature-matched PSS containing 10 mM Ca2+ and ionomycin (10 µM IONO), a Ca2+ ionophore, to obtain the maximum Fura-2 fluorescence signal (Rmax) and minimum diameter of the LVs in conditions of saturating Ca2+. Be sure to measure the background.
- Transfer the chamber onto the inverted fluorescent microscope stage equipped with an LED light source, a 20x S Fluor objective, a cell framing adaptor, and a fast CMOS video camera system, which enables frame-by-frame fluorescence capture at 15 Hz.
- The formula for measuring absolute [Ca2+]i
- Use Rmin and Rmax to calibrate the ratio of 340 and 380 nm wavelengths and calculate absolute cytosolic free Ca2+ concentration ([Ca2+]i).
- Calculate absolute cytosolic free Ca2+ concentration ([Ca2+]i) using equation (1)26:
 (1)
(1)
Where Kd = 225 nM (dissociation constant for Fura-2)26, R = 340/380 ratio, Rmin = 340/380 ratio in the absence of Ca2+, Rmax = 340/380 ratio with saturating Ca2+ conditions, Sfree = 380 signal in the absence of Ca2+, Sbound = 380 signal with saturating Ca2+ conditions
NOTE: All fluorescent signals were corrected for background fluorescence. - Figure 5 is an example Ca2+ trace detailing which parameters are recorded. Define baseline Ca2+ as the lowest resting Ca2+ prior to the Ca2+ spike and peak Ca2+ as the highest Ca2+ achieved during the Ca2+ spike. Amplitude is the difference between Peak and Baseline Ca2+. Export all parameters directly from the imaging software, except the frequency of Ca2+ spike which is to be calculated offline as the number of Ca2+ spikes/s. Below are key steps within the referenced software to obtain these parameters.
NOTE: Entire traces can be exported into a .txt file and all parameters can be analyzed or calculated in your software of choice. - For Rmin, highlight the section of the Numerator trace that corresponds to the background during Ca2+-free PSS. A dialog box will open and provide the values for this portion of the trace.
- Under Operations, select Constants.
- Select Calcium-Numeric background and input the background numbers for the Numerator and Denominator from the previous step. Click OK.
- Highlight the section of the Ratio trace that corresponds to the lowest ratio during Ca2+-free PSS. This is Rmin. Also make note of the Denominator value for this section; this is Sfree.
- Repeat steps 2.3.4 through 2.3.7 for Rmax and Sbound with the section of the trace that corresponds to high Ca2+ free PSS and highest ratio.
- Under Operations, select Constants.
- Select Calcium-Calcium Calibration and input the values listed in Equation 1. Click OK.
- Adjust one of the on-screen traces as described in Step 2.2.8 so that you can see Calcium-Numeric subtracted Calcium.
- Perform a Monotonic Transient Analysis to acquire the remaining parameters. Instructions for this can be found in the software manual30.
- Alternatively, Under Export, select Current Trace.
- Select the location you would like to export the .txt file to and click OK.
NOTE: Make sure to click on the individual trace you want to export. You can export the entire trace or selected sections of the trace.
3. Measurement of LV contractility and rhythmicity
- The edge-detection software incorporated into the imaging system generates contractile traces for LV diameter measurements as described above. Use these measurements to analyze contractile and rhythmicity parameters. Figure 4 is an example contractile trace detailing which contractile parameters are to be recorded. Export all parameters directly from the imaging software using the Monotonic Transient Analysis function on the Diameter trace30, except frequency of contractions, calculated flow, and interval, which are to be calculated offline.
NOTE: Entire traces can be exported into a .txt file and all parameters can be analyzed or calculated in your software of choice using the equations below. - EDD, ESD, amplitude, frequency, and calculated flow measurements
- Measure the maximum and minimum diameters (end diastolic diameter [EDD] and end systolic diameter [ESD], respectively) that the LVs can attain during their rhythmic and spontaneous contractions.
- Calculate the amplitude of contractions (AMP) as the difference between EDD and ESD.
- Calculate the frequency as the number of contractions per measurement period (in s).
- Calculate the calculated flow per µm using equation (2):
Calculated flow = π/4(EDD2- ESD2)F (2)
Where EDD2 = vessel cross-sectional area during relaxed state, ESD2 = measure of the vessel cross-sectional area during constriction, F = frequency of contractions/s
- Rhythmicity: contraction and relaxation time:
- Other measures of LV rhythmicity are contraction time and relaxation time.
- Define contraction time as the time taken by the LV to reach ESD with each contraction.
- Define relaxation time as the time taken by the LV to reach the EDD for each relaxation, which will give an overall indication of rhythmicity correlated with absolute [Ca2+]i within a specific time frame.
- Calculate the interval time (ΔT) from equation (3).
Δt = t2 (ESD2)-t1 (ESD1) (3)
Results
Contractility of LVs and corresponding alterations in cytosolic, free Ca2+ ([Ca2+]i) were assessed in isolated rat mesenteric LVs upon exposure to varying concentrations of nifedipine (NIF; 0.1-100 nM) (Figure 6). The parameters, including Ca2+ spike amplitude, baseline Ca2+, and peak Ca2+, exhibited a concentration-dependent reduction with the incremental addition of NIF to the perfusion chamber (Figure 7A). Concurrently, contractile parameters such as contraction amplitude and calculated flow also demonstrated a stepwise decrease (Figure 7B). There was a small increase in EDD diameter with NIF (Figure 7B). Ca2+ spike frequency and contraction frequency appear to be an all-or-none response. However, this effect occurred at 10 nM for one LV, while all LVs had ceased contractions by 100 nM. Thus, the combined data generate graphs that resemble a graded concentration response. This effect is consistent with earlier publications that used NIF on LVs in other preparations (wire and pressure myography13,14). Manhattan plots show the individual LV responses for measures of rhythmicity, including interval, contraction time, and relaxation time (Figure 7C). This type of data representation allows the researcher to tease out these all-or-none responses or variability in contraction rhythms to provide additional insight into underlying mechanisms. Ultimately, the decreases in contraction amplitude and frequency resulted in a reduction in calculated flow through these isolated LVs, which serves as a surrogate indicator for in vivo function. Overall, the decline in LV contractility correlated with the reduction in [Ca2+]i. Our findings provide direct evidence that within the 100 nM range, NIF effectively halted contractions and [Ca2+]i oscillations in LVs by antagonizing Cav1.x channels present in lymph muscle cells (LMCs).
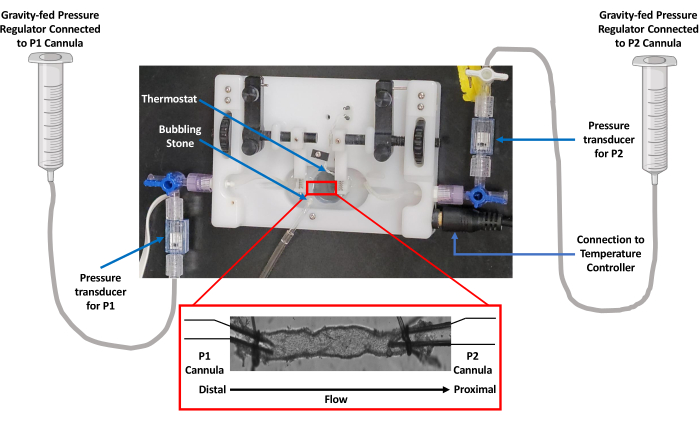
Figure 1: Image of the isolated vessel chamber setup. Vessel perfusion studies used an isolated vessel chamber equipped with a thermoregulator. Gravity was used to control pressure via a PSS reservoir. Pressure was monitored by transducers connected to both inflow (P1) and outflow (P2) cannulas. Abbreviation: PSS = physiological salt solution. Please click here to view a larger version of this figure.
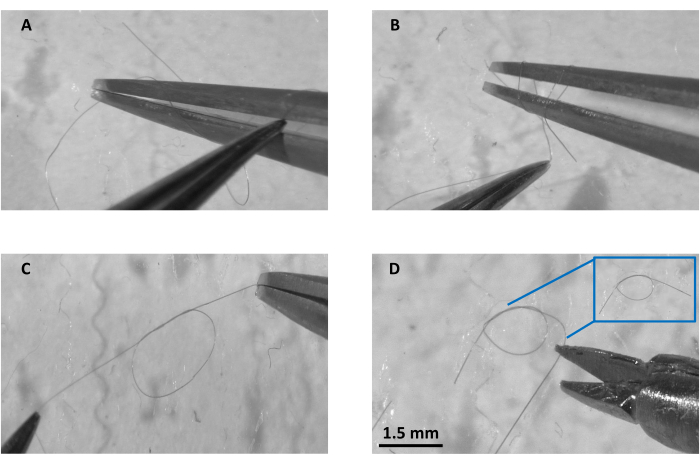
Figure 2: Preparation of knot at-a-glance. (A) Double loop preparation under the dissection microscope using a single filament of 3-ply silk suture thread, (B) grabbing the loose end and pulling it through both loops, (C) pulling the knot from both ends to keep a small opening, and (D) cutting the excess filament from either side and the blue box showing a ready to use complete double overhand knot. Scale bar = 1.5 mm. Please click here to view a larger version of this figure.
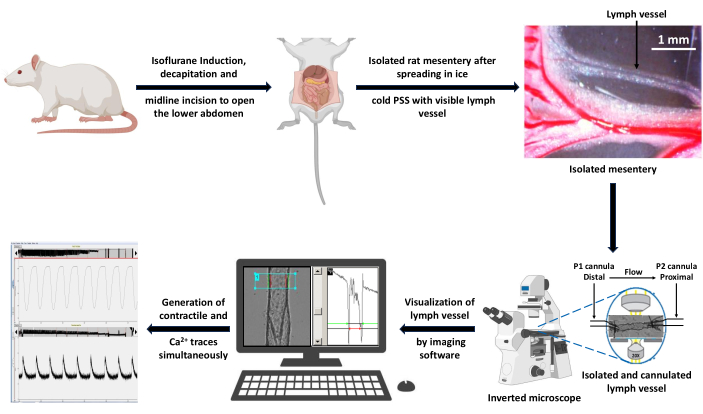
Figure 3: Schematic of experimental workflow for data acquisition. A healthy rat was anesthetized with 5% isoflurane induction and decapitation was performed to remove trunk blood. A midline incision was performed to expose and isolate the mesentery. The isolated mesentery was spread out in ice-cold PSS solution and a LV was dissected free from fat for cannulation in an isolated vessel perfusion chamber. The bath was placed on the stage of the inverted microscope using a 20x objective lens. The vessel was excited alternatively with 340 and 380 nm wavelength light and the emission fluorescent spectra were collected using a CCD camera at 510 nm. The computer connected to the microscope generated the contractile and Ca2+ traces using fluorescence capture and edge detection imaging software. Scale bar = 1 mm. Abbreviations: PSS = physiological salt solution; LV = lymph vessel; CCD = charge-coupled device. Please click here to view a larger version of this figure.
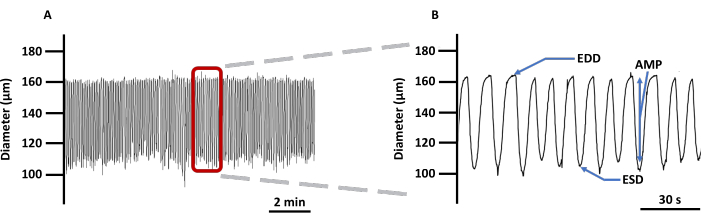
Figure 4: Representative LV contractile trace. (A) Example recording of changes in diameter of cannulated LVs loaded with Ca2+ imaging indicator Fura 2 AM in PSS and (B) a zoomed-in trace to show all the parameters related to vessel contractility: EDD, ESD, AMP, and frequency. These values were used to calculate rhythmicity and flow. Abbreviations: PSS = physiological salt solution; LV = lymph vessel; EDD = end-diastolic diameter; ESD = end-systolic diameter; AMP = amplitude. Please click here to view a larger version of this figure.
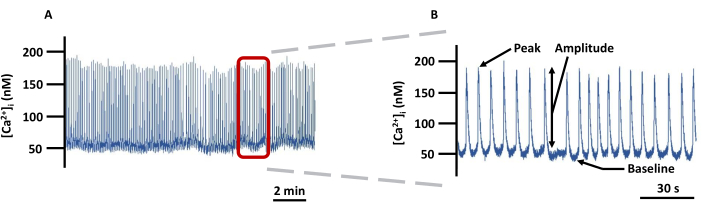
Figure 5: Representative LV Ca2+ imaging trace. (A) Example recording of changes in absolute [Ca2+]i in cannulated LVs loaded with Fura-2 in PSS and (B) a zoomed-in trace to show all the parameters (Peak, Amplitude, and Baseline) related to [Ca2+]i (not background-corrected). Abbreviation: PSS = physiological salt solution. Please click here to view a larger version of this figure.
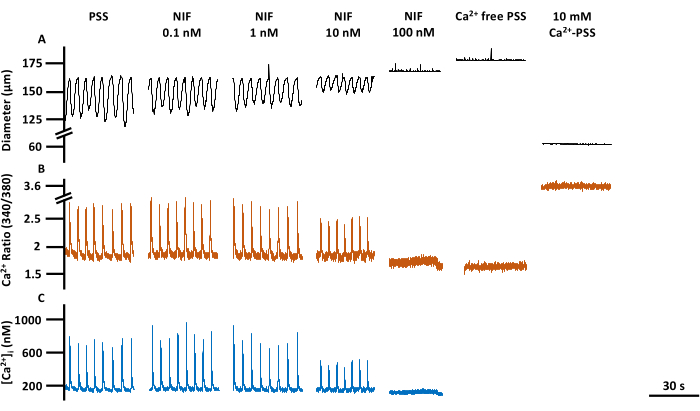
Figure 6: LV contractility and Ca2+ imaging at a glance. Representative traces corresponding to (A) diameter, (B) 340/380 ratio, and (C) absolute [Ca2+]i of PSS baseline, nifedipine, a Cav1.x (Ca2+) channel antagonist, concentration response, including Rmin and Rmax. Abbreviations: PSS = physiological salt solution; LV = lymph vessel; NIF = nifedipine; Rmin = minimum Fura-2 fluorescence signal; Rmax = maximum Fura-2 fluorescence signal. Please click here to view a larger version of this figure.
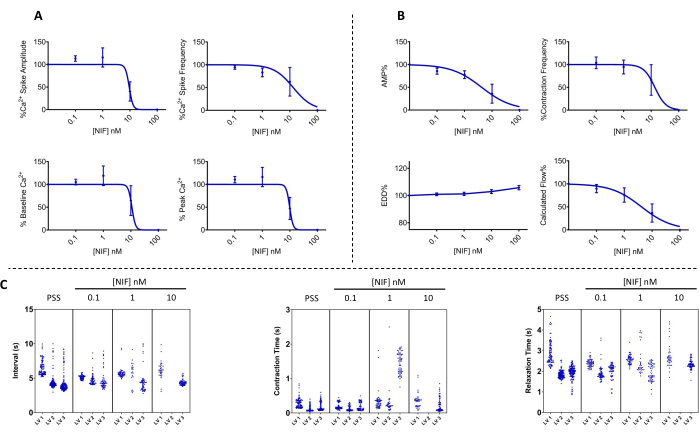
Figure 7: Ca2+ oscillation and corresponding contractility blocked by nifedipine in LVs. (A) Ca2+ (n = 3) and (B) contractile (n = 3) parameters decreased in a concentration-dependent manner with the addition of nifedipine, a voltage-dependent Cav1.x (Ca2+) channel antagonist. (C) Representative Manhattan plots show mean time Interval (Δt) between contractions and contraction and relaxation times. Data presented as mean ± SEM. Abbreviations: PSS = physiological salt solution; LV = lymph vessel; NIF = nifedipine; EDD = end-diastolic diameter; AMP = amplitude. Please click here to view a larger version of this figure.
Discussion
Due to the fragile and diminutive nature of LVs, it is imperative to exercise the utmost care during both dissection and cannulation processes. Even minor damage to the vessel could lead to the development of a non-viable LV or give rise to abnormalities in [Ca2+]i transients. Consistency in excitation settings is equally crucial throughout the entire experimental series to ensure comparability in [Ca2+]i measurements between control and treated groups. Failing to maintain uniform settings poses a substantial risk of over- or underestimating [Ca2+]i across vessels within an experimental series. Similarly, it is equally important to accurately identify and monitor the same vessel region throughout each experiment.
The use of the ratiometric indicator Fura-2AM normalizes fluorescence variations caused by uneven tissue thickness, fluorophore distribution/leakage, or photobleaching, issues common with single wavelength dyes.31 This enables the continuous monitoring described in this protocol. However, since Fura-2 works by chelating Ca2+, it is possible to overload the LVs and reduce the [Ca2+]i available for contraction or drug response. In these cases, Ca2+ spikes may still be observed while rhythmic contractions are absent. Varying LV length also may contribute to this phenomenon. While these Ca2+ measurements likely may still be valid, it may be necessary to reduce the concentration of Fura-2AM in replicated setups to successfully achieve both Ca2+ and diameter measurements. Our results only include LVs for which both Ca2+ spikes and rhythmic contractions were present at baseline.
Measuring Rmin and Rmax are critical steps in calculating absolute [Ca2+]i. Because Rmin should be the Fura-2 ratio in the absence of Ca2+, a high concentration of EGTA has been added to the Ca2+-free PSS to ensure the chelation of any residual Ca2+. Initial studies were conducted with EDTA in the Ca2+-free PSS, and this resulted in sporadic vessel contractions with corresponding Ca2+ spikes. For Rmax, a high concentration of Ca2+ has been added to the PSS along with an ionophore, ionomycin, to maximize the [Ca2+]i signal. The high Ca2+ solution may precipitate, which may require the removal of the EDTA from the PSS. Importantly, these additional measurements of Rmin and Rmax provide the opportunity to evaluate physiologically relevant changes in [Ca2+]i, which can provide information on membrane excitability and contractility mechanisms27 as well as allow for baseline comparisons between experimental groups compared to protocols that only report 340/380 ratio for Fura-2. Failure to achieve adequate Rmin and Rmax values preclude the ability to calculate absolute [Ca2+]i.
Due to the contractile nature of the LVs, this method can only provide a measure of global Ca2+ levels rather than local Ca2+ release events that can be measured in paralyzed vessels32. However, this method is advantageous to correlate changes in absolute [Ca2+]i dynamics with contractility compared to methods using paralyzed vessels or individual cells28,32. For this approach, it is assumed that the majority of the Ca2+ measured originates from the lymph muscle cells. However, endothelial cells, which are also present in these isolated LVs, may contribute to the total Ca2+ signal observed33. This contribution could be estimated using LVs that have been denuded of endothelium34. LV contractions also may result in the vessel wall shifting slightly in and out of focus during the contraction cycle. Therefore, it is important to use short vessel segments that can be pulled taut but without stretching the vessel.
Beyond its application in LVs, this method could be used to study isolated vessels from other vascular beds, including arterioles and veins, and holds promise for potential utilization in neurobiology and other branches of vascular biology. Exploring the effects of various agonists or antagonists targeting different signal transduction pathways is another avenue for investigating underlying Ca2+ dynamics. Furthermore, this technique also can be used for comparative research involving control and treated samples from respective animals. Moreover, this approach is adaptable for implementation at the cellular level, such as in isolated lymphatic muscle cells, requiring minimal adjustments to the perfusion chamber and microscope objectives. In summary, this method provides physiologically relevant insight into global Ca2+ dynamics as it correlates to contractility and rhythmicity in LVs and provides a robust assessment of potential regulators of Ca2+ dynamics in collecting LVs.
Disclosures
The authors have no conflicts of interest to disclose.
Acknowledgements
This work was supported by the National Institutes of Health, including the National Institute of General Medical Sciences, the Centers of Biomedical Research Excellence (COBRE), the Center for Studies of Host Response to Cancer Therapy [P20-GM109005], the National Cancer Institute [1R37CA282349-01], and the American Heart Association Predoctoral Fellowship [Award Number: 23PRE1020738; https://doi.org/10.58275/AHA.23PRE1020738.pc.gr.161089]. The content is solely the responsibility of the authors and does not necessarily represent the official views of the NIH or AHA. Figure 1 and Figure 3 were created with BioRender.com.
Materials
| Name | Company | Catalog Number | Comments |
|---|---|---|---|
| 20x S Fluor objective | Olympus Corporation of the Americas (Center Valley, PA, United States) | UPlanSApo | |
| Borosilicate glass micropipettes | Living Systems Instrumentation (Burlington, VT, United States) | GCP-75-100 | |
| Calcium chloride (CaCl2) | Fisher Bioreagents (Waltham, MA, United States) | BP510-500 | |
| Carbon dioxide (CO2) | nexAir (Memphis, TN, United States) | UN3156 | |
| Dissection forceps | Fine Science Tools (Foster City, CA, United States) | 11254-20 | |
| EDTA (C10H16N2O8) | Fisher Bioreagents (Waltham, MA, United States) | BP118-500 | |
| EGTA (C14H24N2O10) | Fisher Bioreagents (Waltham, MA, United States) | O2783-100 | |
| Fura-2AM | Invitrogen (Waltham, MA, United States) | F1221 | |
| Glucose (C6H12O6) | Fisher Bioreagents (Waltham, MA, United States) | D16-500 | |
| Gravity-Fed Pressure regulator | custom-made in the lab | ||
| Heating unit | Living Systems Instrumentation (Burlington, VT, United States) | TC-09S | |
| Imaging software | IonOptix (Westwood, MA, United States) | ||
| Inverted fluorescent microscope | Olympus Corporation of the Americas (Center Valley, PA, United States) | IX73 | |
| Ionomycin | Invitrogen (Waltham, MA, United States) | I24222 | |
| IonOptix Cell Framing Adaptor | IonOptix (Westwood, MA, United States) | 665 DXR | |
| Isoflurane | Piramal Critical Care (Telangana, India) | NDC 66794-017-10 | |
| Isolated vessel perfusion chamber | Living Systems Instrumentation (Burlington, VT, United States) | CH-1 | |
| Knot preparation forceps | Fine Science Tools (Foster City, CA, United States) | 11253-20 | |
| LED light source | Olympus Corporation of the Americas (Center Valley, PA, United States) | TL4 | |
| Magnesium sulfate (MgSO4) | Acros Organics (New Jersey, NJ, Unites States) | 213115000 | |
| MyoCam-S3 Fast CMOS video system | IonOptix (Westwood, MA, United States) | MCS300 | |
| Nifedipine | Sigma (St. Louis, MO, United States) | N7634 | |
| Ophthalmic sutures | |||
| Oxygen (O2) | nexAir (Memphis, TN, United States) | UN1072 | |
| Pluronic acid | Sigma (St. Louis, MO, United States) | P2443 | |
| Potassium chloride (KCl) | Fisher Bioreagents (Waltham, MA, United States | BP366-500 | |
| Pressure monitor system | Living Systems Instrumentation (Burlington, VT, United States) | PM-4 | |
| Pressure Transducer | Living Systems Instrumentation (Burlington, VT, United States) | PT-F | |
| Silicone-lined petri-dish | custom-made in the lab | ||
| Sodium bicarbonate (NaHCO3) | Fisher Bioreagents (Waltham, MA, United States | BP328-500 | |
| Sodium chloride (NaCl) | Fisher Bioreagents (Waltham, MA, United States | BP358-212 | |
| Sodium phosphate (NaH2PO4) | Fisher Bioreagents (Waltham, MA, United States | BP329-500 | |
| Sprague-Dawley rats | Envigo RMS (Indianapolis, IN, USA) | Male | 9-13 weeks old |
| Stereomicroscope | Leica Microsystems (Wetzlar, Germany) | S9D | |
| Vannas spring scissors | Fine Science Tools (Foster City, CA, United States) | 15000-03 |
References
- Takahashi, T., Shibata, M., Kamiya, A. Mechanism of macromolecule concentration in collecting lymphatics in rat mesentery. Microvasc Res. 54 (3), 193-205 (1997).
- Ishikawa, Y., et al. The human renal lymphatics under normal and pathological conditions. Histopathology. 49 (3), 265-273 (2006).
- Fanous, M. Y. Z., Phillips, A. J., Windsor, J. A. Mesenteric lymph: the bridge to future management of critical illness. JOP. 8 (4), 374-399 (2007).
- El-Chemaly, S., Levine, S. J., Moss, J. Lymphatics in lung disease. Ann N Y Acad Sci. 1131 (1), 195-202 (2008).
- Klotz, L., et al. Cardiac lymphatics are heterogeneous in origin and respond to injury. Nature. 522 (7554), 62-67 (2015).
- Louveau, A., et al. Structural and functional features of central nervous system lymphatic vessels. Nature. 523 (7560), 337-341 (2015).
- Aukland, K., Reed, R. K. Interstitial-lymphatic mechanisms in the control of extracellular fluid volume. Physiol Rev. 73 (1), 1-78 (1993).
- Zawieja, D. C. Contractile physiology of lymphatics. Lymphat Res Biol. 7 (2), 87-96 (2009).
- Nipper, M. E., Dixon, J. B. Engineering the Lymphatic System. Cardiovasc Eng Technol. 2 (4), 296-308 (2011).
- Choi, I., Lee, S., Hong, Y. K. The new era of the lymphatic system: No longer secondary to the blood vascular system. Cold Spring Harb Perspect Med. 2 (4), 006445(2012).
- Ji, R. C. Lymphatic endothelial cells, lymphedematous lymphangiogenesis, and molecular control of edema formation. Lymphat Res Biol. 6 (3-4), 123-137 (2008).
- Scallan, J. P., Zawieja, S. D., Castorena-Gonzalez, J. A., Davis, M. J. Lymphatic pumping: mechanics, mechanisms and malfunction. J Physiol. 594 (20), 5749-5768 (2016).
- Lee, S., Roizes, S., vonder Weid, P. Y. Distinct roles of L- and T-type voltage-dependent Ca2+ channels in regulation of lymphatic vessel contractile activity. J Physiol. 592 (24), 5409-5427 (2014).
- Telinius, N., et al. Human lymphatic vessel contractile activity is inhibited in vitro but not in vivo by the calcium channel blocker nifedipine. J Physiol. 592 (21), 4697-4714 (2014).
- Imtiaz, M. S., Zhao, J., Hosaka, K., vonder Weid, P. Y., Crowe, M., van Helden, D. F. Pacemaking through Ca2+ stores interacting as coupled oscillators via membrane depolarization. Biophys J. 92 (11), 3843-3861 (2007).
- Jo, M., Trujillo, A. N., Yang, Y., Breslin, J. W. Evidence of functional ryanodine receptors in rat mesenteric collecting lymphatic vessels. Am J Physiol Heart Circ Physiol. 317 (3), H561-H574 (2019).
- Stolarz, A. J., et al. Doxorubicin Activates Ryanodine Receptors in Rat Lymphatic Muscle Cells to Attenuate Rhythmic Contractions and Lymph Flow. J Pharmacol Exp Ther. 371 (2), 278-289 (2019).
- Van, S., et al. Dantrolene Prevents the Lymphostasis Caused by Doxorubicin in the Rat Mesenteric Circulation. Front Pharmacol. 12, 727526(2021).
- Atchison, D. J., Johnston, M. G. Role of extra- and intracellular Ca2+ in the lymphatic myogenic response. Am J Physiol Regul Integr Comp Physiol. 272 (1), R326-R333 (1997).
- Atchison, D. J., Rodela, H., Johnston, M. G. Intracellular calcium stores modulation in lymph vessels depends on wall stretch. Can J Physiol Pharmacol. 76 (4), 367-372 (1998).
- Zhao, J., van Helden, D. F. ET-1-associated vasomotion and vasospasm in lymphatic vessels of the guinea-pig mesentery. Br J Pharmacol. 140 (8), 1399-1413 (2003).
- Cotton, K. D., Hollywood, M. A., McHale, N. G., Thornbury, K. D. Outward currents in smooth muscle cells isolated from sheep mesenteric lymphatics. J Physiol. 503 (1), 1-11 (1997).
- Mathias, R., vonder Weid, P. Y. Involvement of the NO-cGMP-KATP channel pathway in the mesenteric lymphatic pump dysfunction observed in the guinea pig model of TNBS-induced ileitis. Am J Physiol Gastrointest Liver Physiol. 304 (6), G623-G634 (2013).
- Garner, B. R., et al. KATP channel openers inhibit lymphatic contractions and lymph flow as a possible mechanism of peripheral edema. J Pharmacol Exp Ther. 376 (1), 40-50 (2021).
- Souza-Smith, F. M., Kurtz, K. M., Breslin, J. W. Measurement of cytosolic Ca2+ in isolated contractile lymphatics. J Vis Exp. (58), e3438(2011).
- Grynkiewicz, G., Poenie, M., Tsien, R. Y. A new generation of Ca2+ indicators with greatly improved fluorescence properties. J Biol Chem. 260 (6), 3440-3450 (1985).
- Hill-Eubanks, D. C., Werner, M. E., Heppner, T. J., Nelson, M. T. Calcium signaling in smooth muscle. Cold Spring Harb Perspect Biol. 3 (9), 1-20 (2011).
- Harmer, A. R., Abi-Gerges, N., Morton, M. J., Pullen, G. F., Valentin, J. P., Pollard, C. E. Validation of an in vitro contractility assay using canine ventricular myocytes. Toxicol Appl Pharmacol. 260 (2), 162-172 (2012).
- IonOptix LLC. IonWizard 7.2 Acquisition. , IonOptix LLC. Westwood, PA. (2017).
- IonOptix LLC. IonWizard 7.2 Core & Analysis Functions. IonOptix LLC. , IonOptix LLC. Westwood, PA. (2017).
- Roe, M. W., Lemasters, J. J., Herman, B. Assessment of Fura-2 for measurements of cytosolic free calcium. Cell Calcium. 11 (2-3), 63-73 (1990).
- Zawieja, S. D., et al. Ano1 mediates pressure-sensitive contraction frequency changes in mouse lymphatic collecting vessels. J Gen Physiol. 151 (4), 532-554 (2019).
- Behringer, E. J., et al. Calcium and electrical dynamics in lymphatic endothelium. J Physiol. 595 (24), 7347-7368 (2017).
- Ferrusi, I., Zhao, J., van Helden, D., vonder Weid, P. Y. Cyclopiazonic acid decreases spontaneous transient depolarizations in guinea pig mesenteric lymphatic vessels in endothelium-dependent and -independent manners. Am J Physiol Heart Circ Physiol. 286 (6), H2287-H2295 (2004).
Reprints and Permissions
