Here we present a protocol for the measurement of relative telomere length (TL) using the monochrome multiplex quantitative polymerase chain reaction (MMqPCR) assay. The MMqPCR assay is a repeatable, efficient, and cost-effective method for measuring TL from human DNA in population-based studies.
Method Article
Monochrome Multiplex Quantitative PCR Telomere Length Measurement
* These authors contributed equally
In This Article
Summary
Abstract
Telomeres are ribonucleoprotein structures at the end of all eukaryotic chromosomes that protect DNA from damage and preserve chromosome stability. Telomere length (TL) has been associated with various exposures, biological processes, and health outcomes. This article describes the monochrome multiplex quantitative polymerase chain reaction (MMqPCR) assay protocol routinely conducted in our laboratory for measuring relative mean TL from human DNA. There are several different PCR-based TL measurement methods, but the specific protocol for the MMqPCR method presented in this publication is repeatable, efficient, cost-effective, and suitable for population-based studies. This detailed protocol outlines all information necessary for investigators to establish this assay in their laboratory. In addition, this protocol provides specific steps to increase the reproducibility of TL measurement by this assay, defined by the intraclass correlation coefficient (ICC) across repeated measurements of the same sample. The ICC is a critical factor in evaluating expected power for a specific study population; as such, reporting cohort-specific ICCs for any TL assay is a necessary step to enhance the overall rigor of population-based studies of TL. Example results utilizing DNA samples extracted from peripheral blood mononuclear cells demonstrate the feasibility of generating highly repeatable TL data using this MMqPCR protocol.
Introduction
Telomeres are protective complexes found at the end of all eukaryotic chromosomes, composed of highly conserved, repetitive DNA sequences and associated proteins. The telomere protects the integrity of DNA, preserving chromosome stability. Progressive shortening of telomeres occurs in dividing cells as a result of incomplete lagging-strand DNA synthesis, DNA damage, and other factors1,2. Increased evidence supporting telomere length (TL) as a biomarker of aging and age-related diseases across the human lifespan has been accompanied by an increase in the types of TL measurement assays utilized to evaluate the role of TL in studies of human exposure, disease, and health3,4,5. Meta-analyses have reported associations of TL with overall mortality, environmental exposures, and health outcomes, including cancer, cardiovascular disease, and diabetes6,7,8,9,10,11,12,13. These meta-associations derive from studies utilizing one of over two dozen different TL measurement methodologies where the strengths of associations tend to vary between different methodologies14,15,16. Selecting the optimal TL measurement method for a research study is a crucial step to ensuring accurate results, as each method possesses its own advantages and disadvantages5,17.
Due to the relatively low cost of reagents, rapid assay turnaround, scalability, and lower initial DNA requirement, PCR-based TL measurement techniques are often preferentially utilized when conducting studies with large sample populations, studies with limited access to samples with high DNA concentrations, or studies prioritizing high throughput. The first PCR-based method of TL measurement, the singleplex quantitative polymerase chain reaction (qPCR) originally developed by Richard Cawthon, utilizes the ratio of the fluorescence signals of telomere (T) and single copy gene (S) amplification, run on separate PCR plates18. In this approach, primers complementary to the repeated telomere DNA sequences (T) are used to amplify total telomeric DNA content in the sample and quantified by detection of the fluorescent reporter SYBR green. Similarly, primers complementary to an intergenic region of a conserved single copy (S) gene are used to quantify genome copy number. These two estimates are quantified relative to a genomic DNA standard curve utilized across all assays in a project to control plate-to-plate variation. Dividing total telomeric DNA (T) by single genome copy number (S) produces the T/S ratio, a unitless, relative measurement representing average telomeric content per cell for an individual DNA sample18,19. Thus, the T/S ratio is not a specific measurement of functional length; however, consistent with literature norms, we utilize the term average TL per sample throughout this protocol.
This method was advanced in 2009 when Richard Cawthon described the monochrome multiplex qPCR (MMqPCR) assay as an approach to potentially reduce the variability in the T/S ratio relative to the original singleplex qPCR method19. The MMqPCR assay possesses the benefits of the qPCR assay with the additional advantage of measuring T and S signals within the same reaction well using one reporting fluorophore, thereby decreasing error relative to singleplex qPCR and resulting in higher precision and reproducibility19. Furthermore, this multiplex method potentially lowers costs and enhances throughput since half as many reactions are required compared to the singleplex assay19.
Given the advantages of MMqPCR TL measurement, this method is well-suited for population-based studies of TL associations with exposures, health outcomes, and biological processes. However, initiating the method can be challenging. To address these challenges, we describe, in detail, the MMqPCR TL measurement protocol utilized in our laboratory, highlighting key steps implemented to increase assay precision, decrease risk of contamination, and enhance repeatability.
Furthermore, this protocol outlines steps for cleaning data and calculating the intraclass correlation coefficient (ICC), an important statistical measure of the reproducibility of TL measurements2. With our representative results, we demonstrate the capability of generating high ICCs using this protocol. Additionally, we identify quality control (QC) and troubleshooting steps expected to decrease the variation in the TL measurements and increase the resulting ICC. Due to this method's high repeatability, efficiency, and cost-effectiveness, the MMqPCR TL measurement is ideal for epidemiological TL research. Figure 1 provides a visual overview of the MMqPCR method as described in this protocol.

Figure 1: Method overview. A broad overview of the monochrome multiplex quantitative polymerase chain reaction method for measuring telomere length. Please click here to view a larger version of this figure.
Protocol
This research was performed in compliance with institutional guidelines. This protocol describes the MMqPCR assay conducted at a measurement depth of duplicate triplicates, i.e., triplicate measurements of each sample repeated across duplicate plates, implemented using two thermocyclers simultaneously to enhance throughput. The use of duplicate plates is a foremost consideration made in the implementation of this protocol to achieve high reproducibility as indicated by high ICCs. Although it is possible to use less replicates, the impact on ICC, and subsequently power and needed sample size, needs to be carefully considered and measured with each and every cohort by each laboratory20,21. If only one thermocycler is available, we suggest maintaining measurement depth (i.e., duplicate triplicates), and running 2 plates sequentially.
1. Stock preparation and storage conditions
- For all materials and equipment used for this protocol, see Table of Materials. In addition, for the specific master mix reagents and amounts used for the MMqPCR assay, see Table 1. If running two plates sequentially, half the master mix volume while maintaining concentration, ensuring that the same reagent aliquots are used across sequential plates of the same assay.
NOTE: All stock reagents should be prepared in advance and aliquoted reagents should be completely thawed before use. - Aliquot and store 1x Tris-EDTA, pH 7.6 (TE) in 5 mL tubes in 3 mL volumes at room temperature for up to 2 years.
- Aliquot and store 5 M Betaine in 5 mL tubes in 1,280 µL volumes at -20 °C for up to 1 year.
- Aliquot and store SYBR Green in 3 µL volumes in individual PCR strip tubes at -20 °C for up to 2 years, covered in foil and minimally exposed to light.
- Store DNA polymerase in original tubes at -20 °C for up to 1 year.
- Aliquot and store 10x polymerase buffer in 1.5 mL tubes in 660 µL volumes at -20 °C for up to 1 year.
- For 1x buffer dilutions of 10x polymerase buffer, add 9.9 µL of 10x buffer to 89.1 µL of PCR grade H2O in 0.5 mL tubes; store at -20 °C for up to 1 year.
- Aliquot and store 1 M MgCl2 in 0.5 mL tubes in 70 µL volumes at 4 °C away from light for up to 1 year.
- Store the forward and reverse telomere (T) and single (S) copy gene oligonucleotide lyophilized primers at room temperature away from light. The four specific oligonucleotide primer sequences are presented in Table 2.
NOTE: The single copy gene in this protocol is albumin; if choosing a different single copy gene, the primer concentrations may need to be adjusted to ensure acceptable PCR efficiency.- Primer reconstitution: Vortex each lyophilized primer tube for 10 s and then place tubes in a mini centrifuge for 5 s to ensure the lyophilized pellet is at the bottom of the tube before adding 1x TE buffer.
- Check each individual primer tube for nM concentration ([nM]= alpha) and rehydrate each primer tube by adding 1x TE equal to 10x of the alpha value in µL (e.g., if the nM concentration on the tube reads 24.6 nM, then add 246 µL of 1x TE to the primer tube) to create a 100 µM solution of each primer.
- Aliquot forward and reverse telomere primers separately in 16 µL volumes and forward and reverse albumin primers separately in 11 µL volumes. Store all four types of primer aliquots at -20 °C for up to 6 months.
- dNTP mixture: Vortex 4-8 tubes of each of the four dNTPS types of 25 mM stock solutions (i.e., 16-32 tubes total) for 10 s followed by a quick spin down at room temperature using a mini centrifuge. Place the tubes in an even distribution in the tube positions in the mini centrifuge, and then close the lid to allow the machine to reach full speed, spinning for about 5 s.
- In a 5 mL tube, add 200-250 µL from each tube, ensuring that equal parts of each of the four dNTP types are added, and vortex the dNTP mixture.
- Aliquot 210 µL of mixture in 0.5 mL tubes and store at -20 °C for up to 1 year.
- Store stock DTT at -20 °C and stock 3 M sodium acetate at room temperature.
- DTT solution: Measure 0.1545 g DTT in a tared weigh boat on a scale using a stainless-steel spatula.
CAUTION: Dithiothreitol (DTT) is a hazardous reagent. DTT is harmful if swallowed, causes skin irritation, and can cause serious eye damage. Individuals should wear protective gloves, eye protection, and face protection when handling DTT. Additionally, individuals should avoid breathing DTT vapors, work in PCR hood when handling DTT, and avoid prolonged or repeated exposure. - Make 10 mL of 0.01 M sodium acetate by adding 33.33 µL of 3 M sodium acetate and 9,967 µL of PCR grade H2O in a 15 mL tube and vortex well. Add measured DTT into the 15 mL tube of 0.01 M sodium acetate. Transfer approximately 100 µL of the 0.01 M sodium acetate solution into the weigh boat to collect the residual DTT. Pipette the 100 µL back into the 15 mL tube. Once all the DTT is in the solution, vortex the tube until it dissolves fully.
- Pour the contents of the 15 mL tube into a loading trough, aspirate the entire solution into a 10 mL plastic syringe from one end of the loading trough. Attach a sterile 0.2 µm cellulose acetate syringe filter 25 mm to the end of the filled syringe, allow to saturate fully for 1 min, and slowly drip the solution into a new 15 mL tube by lightly pushing the syringe plunger down, ensuring that the entire solution drips through the filter into the new 15 mL tube.
- Aliquot DTT solution in 200 µL volumes into 0.5 mL tubes and store at -20 °C for up to 6 weeks.
- DTT solution: Measure 0.1545 g DTT in a tared weigh boat on a scale using a stainless-steel spatula.
Table 1: Final volumes and concentrations of reagents. Volumes and concentrations of reagents in individual aliquots, master mix, and in PCR wells. Please click here to download this Table.
Table 2: Telomere and single copy gene oligonucleotide primer sequences. List of the telomere and albumin single copy gene primer sequences used in the methodology. Please click here to download this Table.
2. Genomic DNA extraction and sample preparation
- Extraction of analytical samples: Perform a genomic DNA extraction for samples in accordance with manufacturer's guidelines using kits or established methods within the laboratory.
- Check the DNA sample quality with a spectrophotometer and double stranded DNA (dsDNA) using a fluorometer. Samples with unacceptable average 260/280 and 260/230 ratios or a concentration of dsDNA below detection (<0.20 ng/µL) should not be analyzed for TL22,23. Additionally, if dsDNA concentration is too high to generate a reading using the fluorometer (>1000 ng/µL), dilute the sample, and repeat the assay.
NOTE: For the results presented here, the acceptable values for purity of nucleic acids were a 260/280 ratio between 1.6 to 2.0 and a 260/230 ratio between 2.0 and 2.2.
- Check the DNA sample quality with a spectrophotometer and double stranded DNA (dsDNA) using a fluorometer. Samples with unacceptable average 260/280 and 260/230 ratios or a concentration of dsDNA below detection (<0.20 ng/µL) should not be analyzed for TL22,23. Additionally, if dsDNA concentration is too high to generate a reading using the fluorometer (>1000 ng/µL), dilute the sample, and repeat the assay.
- Extraction of control samples: Perform a genomic DNA extraction on a control sample derived from the same biological material as the subject samples being assayed for a given project. Ensure to extract sufficient control DNA for all plates expected to be run for the entire cohort, so that a single DNA standard is utilized for all assays.
- Check the control DNA sample quality by spectrophotometer and fluorometer. The control sample should have acceptable average 260/280 and 260/230 ratios and detectable concentrations of dsDNA22,23.
- Aliquot control DNA at a concentration of 2 ng/µL in 150 µL amounts in 0.5 mL tubes labeled with the sample type and date. Store control DNA aliquots at -20 °C for up to 5 years. Use one control DNA sample for all plates of all samples from the same cohort or research project. Prepare these stock aliquots in advance.
- Preparation of analytical samples: For samples that have a starting concentration of >5 ng/µL, create dilution aliquots using a whole number dilution factor, adding the appropriate amount of extracted DNA sample (Supplementary File 1 MMqPCR Set Up Sheet, Column F) and PCR grade H2O (Supplementary File 1 MMqPCR Set Up Sheet, Column G) to dilute the concentration to be between 2.5 - 5.0 ng/µL (Supplementary File 1 MMqPCR Set Up Sheet, Column K). Do not dilute samples with a concentration <5 ng/µL, however, aliquot enough volume to assay the sample 3x using this protocol.
NOTE: Dilution aliquots must be made during sample preparation so that 15 ng of DNA can be added to each sample's corresponding PCR strip tube. The sample aliquots allow technicians to avoid unnecessary freeze-thaw cycles from impacting the stock sample DNA integrity if the sample fails to pass the quality criteria and needs to be rerun. The sample MMqPCR Template found in the Supplementary File 1 can help identify the correct dilution factor and volumes to prepare dilution aliquots (Supplementary File 1, MMqPCR Set Up Sheet, Columns E-I).- Fill PCR strips with samples A1-8 in PCR strip A, samples B1-8 in PCR strip B, and samples C1-8 in PRC strip C, as detailed in the Supplementary File 1 MMqPCR Set Up Sheet and listed in Table 3 with appropriately diluted sample amounts (Supplementary File 1 MMqPCR Set Up Sheet, Column L) and PCR grade H2O amounts (Supplementary File 1 MMqPCR Set Up Sheet, Column M) for a total amount of 15 ng of DNA per PCR tube and a total volume of 75 µL. Set it aside.
NOTE: Samples in PCR strips can be stored overnight at 4 °C to be plated the next day.
- Fill PCR strips with samples A1-8 in PCR strip A, samples B1-8 in PCR strip B, and samples C1-8 in PRC strip C, as detailed in the Supplementary File 1 MMqPCR Set Up Sheet and listed in Table 3 with appropriately diluted sample amounts (Supplementary File 1 MMqPCR Set Up Sheet, Column L) and PCR grade H2O amounts (Supplementary File 1 MMqPCR Set Up Sheet, Column M) for a total amount of 15 ng of DNA per PCR tube and a total volume of 75 µL. Set it aside.
- Preparation of standard curve: Thaw a control DNA aliquot, vortex for 30 s, centrifuge for 5 s, and aspirate the full volume (150 µL) into the first tube in the standard curve (SC) PCR tube strip.
- Pipette 70 µL of PCR grade H2O into the second through eighth tubes of the SC PCR strip. Thoroughly resuspend control DNA in first tube before aspirating 70 µL and dispensing it into the second PCR tube. Wait 30 s, then thoroughly resuspend the solution in the second PCR tube before aspirating 70 µL and dispensing it into the third PCR tube. Repeat this for tubes three through seven to create a 2-fold serial dilution of seven standards. The final tube should only contain PCR grade H2O to function as a non-template control (NTC). Set SC PCR strip aside.
Table 3: Organization of samples and control standard in plate. Location of all samples and standards on a 96-well PCR plate. Please click here to download this Table.
3. MMqPCR master mix preparation
- Gather the master mix reagent aliquots listed in Table 1, except DNA polymerase, and allow them to come to room temperature inside the PCR hood. Add 1 µL of the SYBR Green aliquot to the 1x buffer aliquot.
NOTE: This exact amount is needed to generate the correct concentration of SYBR due to the limitations of pipette accuracy during the assay, so even if only one plate is run at a time this amount should remain unchanged. - Vortex all aliquots for 10 s, centrifuge for 5 s, then add the following amounts of reagents to the 5 mL tube holding the 5 M betaine (now the master mix tube): 1,235.2 µL of PCR grade H2O, 640 µL of the 10x buffer, 204.8 µL of the dNTPs, 192 µL of the DTT, 64 µL of the MgCl2, 48 µL of SYBR Green / 1x buffer (from step 3.1), 14.4 µL of both telomere primers, and 9.6 µL of both albumin primers, as listed in Table 1.
- Take DNA polymerase out of -20 °C storage, vortex for 10 s, centrifuge for 5 s, then slowly add 128 µL to the master mix; immediately move DNA polymerase back to -20 °C storage.
- Vortex the 5 mL master mix tube for 30 s.
4. Preparation of 96-well plate
- Place two 96-well plates, loading trough, and multichannel pipette tips inside PCR hood. Label each plate with plate number (1 or 2). Turn plate one (the P1 plate) 180° so the numbers of the columns are upside down. Leave plate two (P2) facing the technician.
- Pour the contents of the 5 mL master mix tube into the loading trough. Use a pipette tip to collect and dispense any solution remaining in the tube.
- Load tips onto the multichannel pipette, pushing at the base of each pipette tip to ensure a tight seal. Check that the tips do not have any filter within the output region where the master mix will be aspirated; if there is a piece of filter, then replace the tip.
- Use reverse pipetting to fill plates with the viscous master mix, swirl the loading trough then depress pipette plunger past the first stop, aspirating greater than 15 µL into the pipette tips, making sure the tips fill at the same time with the same volume. When expelling master mix into a column, depress plunger to the first stop, leaving the extra master mix in pipette tips. Leaving the plunger depressed, submerge tips back into the loading trough and release the plunger to fill tips with another 15 µL. Use the same tips to fill both plates.
- Fill plates by expelling the master mix into either all even or all odd columns first, alternating between plates (i.e., if the technician choses to start with odd column numbers, column 1 on P2 will be filled first, followed by column 11 on P1, then column 3 on P2, etc.). After the technician has filled all wells of the series (odd or even) working left to right, do the other series (even or odd) of columns in the same fashion. See Figure 2 for a chart of this process.
NOTE: This manner of plate filling functions to control for position effects across the plates.
- Fill plates by expelling the master mix into either all even or all odd columns first, alternating between plates (i.e., if the technician choses to start with odd column numbers, column 1 on P2 will be filled first, followed by column 11 on P1, then column 3 on P2, etc.). After the technician has filled all wells of the series (odd or even) working left to right, do the other series (even or odd) of columns in the same fashion. See Figure 2 for a chart of this process.
- Vortex the four closed PCR strips containing the samples and standard curve then spin each in a mini centrifuge for 5 s.
- Line up the PCR strips in the PCR tube rack in the order of how they will be placed on the plate. For P1 the first 3 columns are samples (PCR strip A), columns 4-6 are the standard (PCR strip S), columns 7-9 are samples (PCR strip B), and columns 10-12 are samples (PCR strip C; see Figure 3 and Table 3). Since P2 is filled while turned 180° with respect to the technician, the columns will be the opposite.
- Turn both plates 180° so the numbers of the columns are flipped in relation to the technician for each plate (i.e., if the technician faced the label for P2 previously, now they will face the label for P1 on the plate edge).
- Set the multichannel pipette to 10 µL and load the pipette tips onto the multichannel pipette as described in step 4.3.
- Use the multichannel pipette to resuspend the solutions, then perform reverse pipetting as described in step 4.4 to aspirate and dispense 10 µL of the samples and standard solutions, starting with the PCR strip A.
- Fill the first 3 columns of each plate using PCR strip A by alternating the columns in a similar fashion as the master mix was placed in the plate (i.e., even, or odd).
- Fill the next three columns using the standard curve PCR strip. For this strip, resuspend the 7th standard dilution tube (second to last), using a 200 µL pipette set to ~90 µL, thoroughly before resuspending the entire strip using the multichannel pipette.
NOTE: The larger volume and smaller DNA concentration in this tube frequently results in varied measurements across the PCR plate wells due to poor mixing. Using a larger volume to mix this tube better homogenizes the DNA solution. - Fill the next three columns with PCR strip B and the last three with PCR strip C. Replace pipette tips between each PCR strip, filling all 96-wells on both plates with the corresponding samples and control standard as outlined in Figure 3.
- Once plates are filled, gently tap the plate on the bench top to ensure liquid on the sides of the wells run down to the bottom, and then cover the plate tops using sealing films. Use fingertips to press down on all edges of the film to ensure a tight seal.
- Mix the plates by swirling on the hood top for 30 s, then place the sealed plates into the plate spinner for 2 min with the well openings facing the center.
- Place the plates in a thermocycler, with the numbers of the columns of the plates in legible order. Use a clean tissue to clean the top of each plate before closing the thermocycler top.
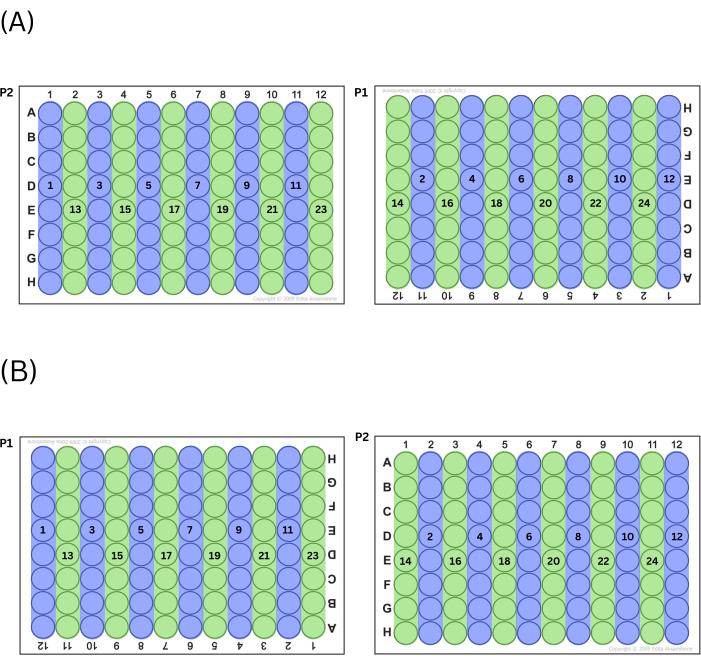
Figure 2: Process for filling plates. (A) If choosing to fill odd columns first, this is the order in which wells are filled. (B) If choosing to fill even columns first, this is the order in which wells are filled. Please click here to view a larger version of this figure.

Figure 3: Plate layout. PCR strip A, strip B, strip C, and the standard curve (SC) strip should all be used to fill three columns on each plate to produce duplicate triplicates of each sample and standard dilution. This diagram shows which of the columns should be filled with each strip. Plate two is flipped 180° (note that column and row headers are upside-down) prior to loading, but the plate is filled identically to plate one, eliminating potential pipetting errors while still controlling for position effects across the plates. Please click here to view a larger version of this figure.
5. MMqPCR thermocylcing
- While the plates are spinning in step 4.8.1, turn ON the computer and the thermocyclers. Open the thermocycler software. This protocol describes the use of CFX Maestro software.
- Create the TL thermocycling protocol in accordance with MMqPCR thermocycling protocol19(Figure 4).
- Add an incubation step to activate the DNA polymerase at 95 °C for 15 min.
- To avoid primer-dimer binding, run two cycles of 94 °C for 15 s, 49 °C for 1 min, then 3 cycles of 94 °C for 15 s, 59 °C for 15 s.
- For telomere amplification, add 27 cycles of 85 °C for 15 s, 74 °C for 30 s, then signal acquisition.
- For albumin amplification, add 31 cycles of 94 °C for 15 s, 84 °C for 30 s, then signal acquisition.
- Include a melt curve from 59 °C to 95 °C at 5 s intervals for each increasing degree in the thermal cycling protocol.
- Click Start Run for both thermocyclers. When prompted, provide a title for the analysis files.
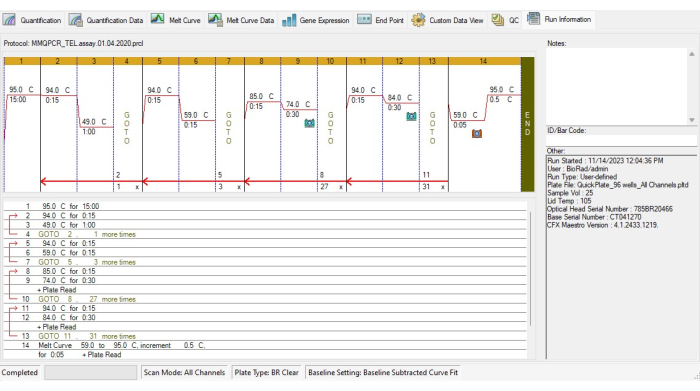
Figure 4: Thermocycling profile of the MMqPCR assay. MMqPCR protocol created in the software in accordance with the original thermocycling protocol19. Please click here to view a larger version of this figure.
6. MMqPCR data analysis
- When the thermocycling is complete, analyze the data in the following manner to produce TL values for the samples that have been processed.
- In the software, select the Plate Setup feature. In the drop-down menu, click View/Edit Plate.
- Highlight all wells and click Select Fluorophores, then check the box labeled SYBR and uncheck all other boxes. Click OK.
- While all wells are still highlighted, next to the word Load, check the box next to SYBR. Now all the wells should have SYBR written on them.
- Next highlight the three NTC wells at the top or bottom of the standard control serial dilution and select NTC from the sample type menu on the right. The three wells should now be yellow and be called NTC. Figure 5A shows which wells should be selected for P1 and Figure 5B shows which wells should be selected for P2.
NOTE: P2 will be inverted from P1, so the NTC will be in the bottom of columns 4-6 for P1 and the top of columns 7-9 for P2. - Highlight the 21 wells of the standard control serial dilution and select Standard from the sample type menu. These wells should be green. While these wells are still highlighted, click Technical Replicate. Select 3 from the Replicate Size menu, then select Horizontal > Apply. These wells should be labeled in sets of three from Std-1 through Std-7.
- While the standard is still highlighted, scroll down, and select Dilution Series. In the Dilution Factor field, enter 2 then type the dilution starting concentration and directionality according to the plate number as described in the following steps.
- For the P1 plate, enter 2.00E-03 in the starting concentration field, and check the box for Decreasing then select Apply. The values in the 21 wells should have the concentration values written in each well ranging from 2.00E-03 to 3.13E-05 top to bottom.
- For the P2 plate, enter 3.13E-5 in the starting concentration field, and check the box for Increasing then select Apply. The values in the 21 wells should have the concentration values written in each well ranging from 3.13E-05 to 2.00E-03 top to bottom.
- For the samples, highlight the columns for PCR strip A (1-3 for P1 and P2), select Unknown from the sample type menu, then select Technical Replicate. Select 3 from the Replicate Size menu, then select Horizontal > Apply. The wells for these columns should be blue and labeled in by row in sets of 3 from Unk-1 to Unk-8.
- Repeat step 6.3 for columns for PCR strip B (columns 7-9 for P1 and 4-6 for P2). They should be labeled Unk-9 through Unk-16.
- Repeat step 6.3 for columns for PCR strip C (columns 10-12 for P1 and P2). They should be labeled Unk-17 through Unk-24. When steps 6.2-6.3.2 are completed, the plate setup windows should resemble Figure 5A,B.
- Select OK at the bottom right of the plate editor window. Click Yes to apply changes when prompted.
- For assay-level QC, ensure that curves in the quantification tab are appropriate (e.g., no inverted amplification curves) for both Step 9 and Step 12 of the thermocycling profile, which correspond to to the telomere and albumin amplicons respectively. Curves are accessed by the drop-down menu on the middle right side of the software window. Figure 6A,B display appropriate curves.
- Ensure that the PCR efficiencies reported on both Step 9 and Step 12 are between 90% and 110% and these two efficiencies do not differ from each other more than 10% (i.e., 92.4% for Step 9 and 98% for Step 12 is appropriate but 92.4% for Step 9 and 108% for Step 12 is not appropriate). Additionally ensure the standard R2 curve is >0.995. Should either P1 or P2 fail to meet these criteria the plates need to be re-run.
- For P1, select Step 9 and highlight the 21 wells corresponding to the standard curve as seen in Figure 6A,B. Copy the Cq values in the lower right corner of the software window. Open the telomere data sheet template available as Supplementary File 1, and paste these values into the standard 1 sheet, column B. Select Step 12 then copy these Cq values. Paste these values into the standard 1 sheet, column I.
- Identify the slope value in Step 9 and type this into cell C4 in the standard 1 sheet. Identify the slope value in Step 12 and type this into cell J4 in the standard 1 sheet.
NOTE: The system calculates the percent efficiency of the primers using the slopes of the standard curve identified in step 6.6.1. The percent efficiency can be calculated manually using the following formula:

- Ensure that the coefficient of variation (CV) for each standard dilution triplicate is less than 0.1. If greater than or equal to 0.1, exclude up to three individual wells total from all concentrations of control samples included in the 7- point standard serial dilution curve on the plate. Only one well should be excluded from any triplicate set.
NOTE: Excluding standard points from the analysis on the software will change the reported slope, R, y-intercept, and efficiency for both primers. Thus, after any standard well is removed from analysis, steps 6.5.1-6.6.1 must be repeated. - Repeat steps 6.6.1 - 6.6.2 for the P2 analysis file and corresponding standard 2 sheet.
- Only when both standard 1 and standard 2 sheets are completed with acceptable CVs, collect individual sample data from the analysis files. Ensure QC adjustments are reported in the P1 v P2 sheet column L, e.g., how many wells were excluded in the P1 analysis file.
- Identify the slope value in Step 9 and type this into cell C4 in the standard 1 sheet. Identify the slope value in Step 12 and type this into cell J4 in the standard 1 sheet.
- Ensure that only the 72 sample wells in the P1 analysis file are highlighted in blue in the Quantification tab as seen in Figure 7A,B. Select Step 9. Copy the Cq and SQ values in the lower right corner of the software window. Paste these values into the samples P1 sheet, starting in cell D3. Select Step 12 then copy these Cq and SQ values, and paste in the samples P1 sheet, starting in cell F3.
- Repeat this step for the samples in the P2 analysis file and corresponding samples P2 sheet. Telomere to single copy (T/S) ratios (Column H) are calculated automatically, but can be calculated manually using the following formula:
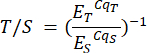
Where ET/S is the efficiency of exponential amplification for reactions targeting the telomere or single-copy gene respectively, and CqT/S is the cycle at which a given replicate targeting telomeric content or the single-copy gene reaches the critical threshold of fluorescence quantification. Average T/S ratios (Column I) are calculated across six measurements per sample.
NOTE: The sample ID numbers in CFX do not correspond to the same biological sample across the two plates. The telomere data sheet template accounts for this difference and will align the appropriate duplicate triplicates. - In CFX Maestro, check that the Cq values for all analytical samples fall between the lowest and highest Cq value of the standard curve as seen in Figure 7B. If a sample is outside of the range as seen in Figure 7A, it will need to be re-run after concentration adjustment. A sample with a Cq value lower than the highest concentration standard must be diluted by a factor approximate to the number of amplifications cycles it is out of range, and a sample with a Cq value higher than the lowest concentration standard would need to be concentrated by a factor approximate to the number of amplification cycles beyond the threshold.
NOTE: Wide variation in the concentration of analytical samples introduces an additional potential level of variation and should be done with caution. - Ensure that starting concentration in the NTC was less than 5% of the average amount of DNA present in the sample wells. This can be checked by viewing the % water contamination on the samples P1 and samples P2 sheets of the MMqPCR. If the NTC indicates contamination, then re-run the plates.
NOTE: Due to the sensitivity of the MMqPCR assay, minor uncontrollable contamination may occasionally cause the NTC wells to amplify. However, this amplification should be minor and occur several cycles after single copy gene amplification in Step 12 of the thermocycling protocol. - For sample-level QC, review standard deviations (SD) (Column J) and CVs (Column K) in samples P1 and samples P2 Sheets. Ensure that the intraplate CVs across sample triplicate T/S ratios are less than 0.10 (10%). To correct any intraplate CVs greater than 0.1, one T/S ratio from a set of triplicates may be excluded.
NOTE: Only one total replicate across the six measurements per sample may be excluded, i.e., a replicate for the same sample cannot be excluded on both P1 and P2. - Check that the individual sample interplate CVs in the P1 v P2 sheet, column G, are less than 0.05 (5%). To correct any CVs greater than 0.05, perform the exclusion of one T/S ratio from the six measurements per sample across both plates. Exclude samples after visual inspection across intraplate triplicates and all six measurements as necessary.
NOTE: Only samples passing these QC criteria, intraplate CV < 10% and interplate CV < 5%, may be included in final TL results. Otherwise, the sample should be excluded from P1 v P2 and ICC data sheets for this run, and the sample should be reassessed on a second MMqPCR assay. - For plate-level QC, check that the average intraplate variation across all samples on each plate, located at the bottom of samples P1 and samples P2 sheets, is less than 0.05 (5%). For additional plate-level QC, check that the overall interplate variation in P1 v P2 sheet, cell G29, is less than 0.06 (6%). Ensure that samples that did not pass QC are removed from the interplate CV calculation in cell G30.
NOTE: When working with related sample groups (e.g., family members, different timepoints, etc.), all samples in a group need to be run on the same plate. Therefore, if one sample of the group fails to pass QC criteria, all samples in the group must be re-run. - In a separate overall cohort or experiment data file, record final TL data for each sample that passed QC (P1 v P2 Sheet, Column I), ICC calculations for each sample that passed QC (ICC Data Sheet, Columns E-K), and final assay run QC data from P1 v P2 Sheet (Columns J-L)
- Repeat this step for the samples in the P2 analysis file and corresponding samples P2 sheet. Telomere to single copy (T/S) ratios (Column H) are calculated automatically, but can be calculated manually using the following formula:
- Use Supplementary File 2 created by the Telomere Research Network (TRN) to calculate the ICC for the project20.
- Lastly, to improve comparability between TL studies, transform the final TL data for each sample in the separate overall cohort or experiment data file into Z-scores using the following equation where the mean T/S ratio for all samples in the cohort is subtracted from the individual sample T/S ratio then divided by the SD across all samples in the cohort.
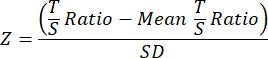
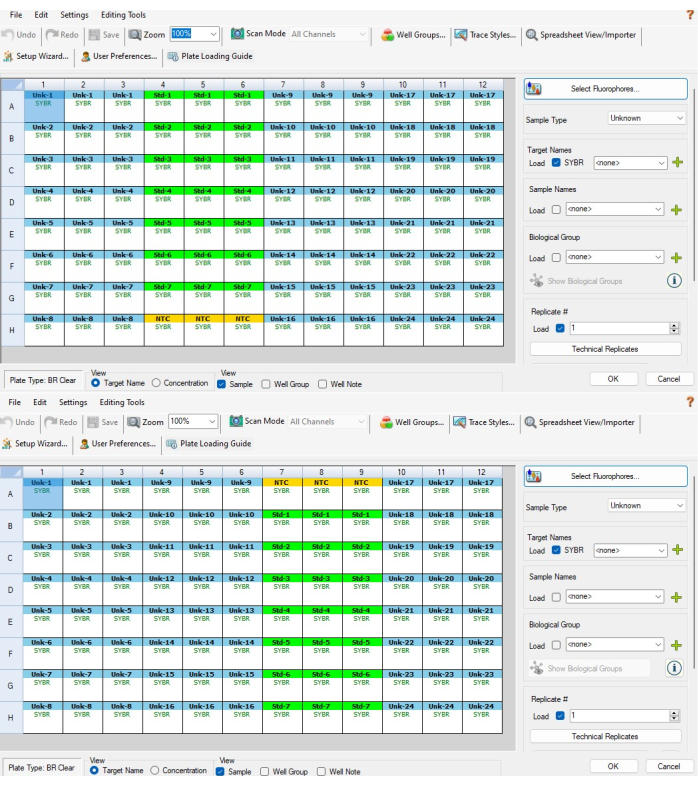
Figure 5: Software-based plate setup. (A) Software-based plate setup for a P1 plate after completing steps 6.2-6.4. (B) Software-based plate setup for a P2 plate after completing steps 6.2-6.4. Sample and standard IDs are not aligned between the two CFX plates because of the way the software assigns sample IDs based on well position (i.e. CFX sample 1 on P1 is CFX sample 24 on P2). The excel template provided in Supplemental File 1 accounts for this, ensuring interplate measurements made on the same biological sample are properly aligned to one another Please click here to view a larger version of this figure.

Figure 6: Standard curves for telomere and albumin amplicons. (A) This standard curve is from the P1 telomere amplicon of the representative results dataset. One standard was removed because it failed to meet the QC criteria. (B) This standard curve is from the P2 albumin amplicon of the representative results dataset. Please click here to view a larger version of this figure.
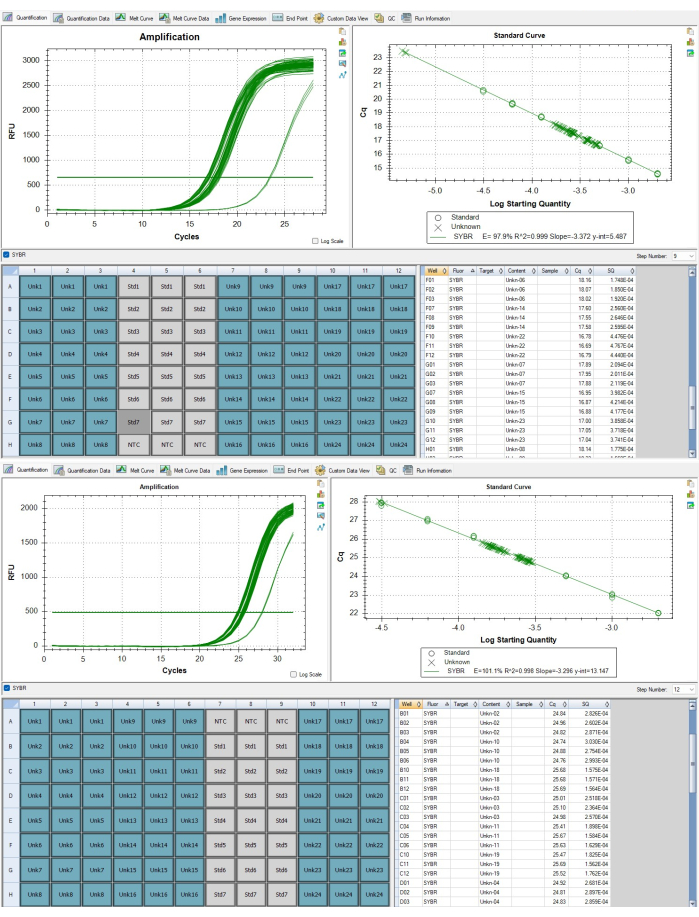
Figure 7: Telomere and single copy gene amplicons. (A) Telomere amplification and (B) albumin gene amplification of samples reported in representative results displayed in the software. Please click here to view a larger version of this figure.
7. MMqPCR data reporting
- When reporting the results of research using the TL data created from the MMqPCR ensure reporting of the items described in the TRN Minimum Reporting Guidelines. These guidelines can be found on the TRN website (https://trn.tulane.edu/resources/reporting-guidelines/) and a template for reporting this information is provided in Supplementary File 3. Cite this protocol and other TRN guidelines and resources where appropriate.
Results
The results presented in Table 4 and Table 5 offer an example of highly repeatable TL measurements obtained by following the protocol. For these results, DNA was extracted from 24 peripheral blood mononuclear cell (PBMC) samples using a commercial kit per manufacturers' guidelines. These 24 samples were run across two 96-well plates. All DNA samples were checked for quality via spectrophotometer and fluorometer, using the average 260/280 ratio, average 260/230 ratio, and dsDNA concentration to determine assay eligibility and sample dilution factor (Table 6). Table 6 also highlights the importance of quantifying dsDNA concentration, which can differ from DNA concentration measured using a spectrophotometer. This variability is a result of different approaches to quantification. Specifically, the spectrophotometer derives DNA concentration based on absorption at 280 nm and is susceptible to fluctuations due to contaminants (e.g., protein, salt, etc.) impacting the absorbance readings. By contrast, dsDNA concentrations measured using a fluorometer are determined by the fluorescence of a dye that specifically binds to dsDNA and, as such, are presumed to be a more accurate reflection of DNA content. The DNA samples experienced up to three freeze-thaw cycles prior to MMqPCR TL analysis. The control DNA was created from pooled DNA extractions of PBMCs from one individual, which was used to create a seven-point serial dilution from 2 ng/μL to 0.0313 ng/μL of DNA. The independent standard curves created for PCR Step 9 (telomere amplicon) and Step 12 (single copy gene amplicon, albumin in this protocol) are presented in Figure 6A,B. The assays were run on a commercial Real-Time PCR Detection System which generated a melt curve that shows the individual amplicon products being produced at distinct temperatures as seen in Figure 8.
Table 4: Output data from MMqPCR measurement for optimal representative results. Mean T/S ratios, SDs, CVs, and Z-scored TL for 24 samples. Please click here to download this Table.
Table 5: Telomere length data output. Raw data from the MMqPCR assay is analyzed in the software then added to the spreadsheet template attached as Supplementary File 1 for further analysis and QC. This TL template output sheet presents a summary of the data, displaying sample IDs, average TLs, SDs, and CVs for each sample across both plates. Please click here to download this Table.
Table 6: Spectrophotometer and Fluorometer DNA quality metrics for sample results. QC data from duplicate spectrophotometer analysis and singular fluorometer measurement of dsDNA and any contaminates per sample. Please click here to download this Table.
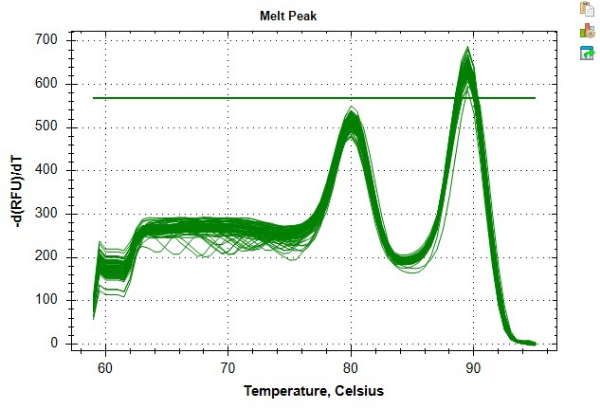
Figure 8: Example melt curve. Melt curve for sample data as generated in the software. The earlier peak ~80 °C represents the telomere amplicon and the secondary peak at ~89 °C represents the albumin amplicon. Please click here to view a larger version of this figure.
For this project, the average telomere efficiency was 98.6% with a range of 90.7 to 102.1 and the average albumin efficiency was 102.3% with a range of 93.6 to 108.2 across all runs. There was an average of 0.97 replicates removed from the standard curves, which meets the QC criteria of this protocol. The average interplate CV was 1.83% with a SD of 0.00616 and the average intraplate CV was 3.78% with a SD of 0.00658. The average TLs for these representative samples are presented in Table 4 and Table 5. The mean TL was 1.37 with an SD of 0.24 and a range of 0.84 to 2.32. T/S ratio, SD, CV, and Z-scored TL per sample are listed in Table 4. Since the T/S ratio output of the MMqPCR assay is a relative measurement of TL, the ratios were transformed into this Z-score to allow for cross-study comparison. ICC for this project was calculated using R script as described by TRN guidelines found in Supplementary File 2, accounting for batch and run effects20. In order to calculate the intra-project ICC, we re-ran 10% of the passing samples, making sure to populate the ICC plates with at least one sample from each plate of the cohort. The overall project ICC of 0.801 [CI: 0.703, 0.86] indicates the high reproducibility of TL results.
Not all results will be optimal. The results in Figure 9 and Table 7 show suboptimal results from the MMqPCR assay. Figure 9 displays a standard curve with a telomere efficiency below 90%, which is below QC standards, requiring the entire plate to be repeated. Problems with primer efficiencies are usually due to an issue with reagents, so it is important to track the dates reagents are aliquoted and when they expire as a first step in determining which reagent is responsible for low efficiency. Expired reagents should be replaced before the plate is run again. Table 7 displays a plate that passed initial sample-level QC criteria but has a high level of variability between the plates, leading to plate-level QC failure. Variation between plates is usually due to errors in pipetting and plate-filling techniques. In this case, the technician should evaluate any issues that occurred during plate set up and ensure pipettes are calibrated.
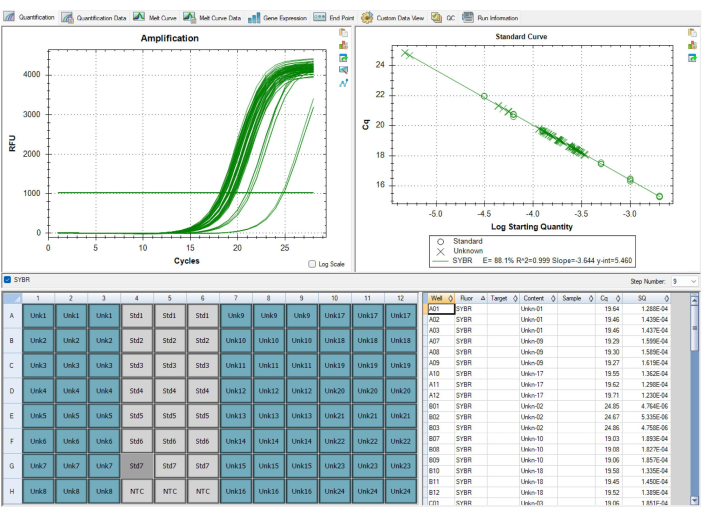
Figure 9: Suboptimal results. This standard curve displayed in the software failed to pass QC, since the efficiency of amplification for the telomere primer was less than 90%. The image is from P1, but P2 had similarly low efficiencies. The data from this run could not be used and all samples needed to be run again after replacing the causal reagent that was expired. Please click here to view a larger version of this figure.
Table 7: Suboptimal Results. The table displays the telomere data template for a run where many of the samples failed to meet QC standards. Samples that needed to be re-run were determined based on CV values then the sample name was changed to a red font for easy identification. Please click here to download this Table.
Supplementary File 1: Telomere data spreadsheet template. Please click here to download this File.
Supplementary File 2: ICC calculation. This protocol has been created by the Telomere Research Network (TRN). This file has been modified from20. Please click here to download this File.
Supplementary File 3: TRN reporting guidelines. Please click here to download this File.
Discussion
The method most commonly used TL measurement in larger population-based studies, prior to 2002, was the Southern blot analysis of terminal restriction fragment lengths (TRF)24,25. TRF, despite providing excellent precision and reproducibility in specialized laboratories, is limited in applicability due to the amount and quality of required DNA and limited throughput, thereby providing the backdrop for the increased utilization of qPCR-based TL assays, and subsequently the MMqPCR assay. The MMqPCR TL method provides repeatable TL measurement when set up, optimized, and maintained with careful attention to each QC criteria. The calculation and reporting of the specific ICC for each cohort analyzed is required to ensure assay reliability. While subject to DNA quality and technical expertise, the MMqPCR method is well-suited for large population-based studies investigating TL because it requires small amounts of DNA, is more reliable than singleplex PCR, and is more efficient in reagent costs and technician time than other methods. The ability to generate high ICCs provides additional data in support of the use of MMqPCR for large population-based studies of TL. MMqPCR TL measurement can be applied to a broad range of studies seeking to define the role of TL as a biomarker of all-cause mortality, aging, life-time stress, environmental exposures, and physical health outcomes such as cardiovascular disease and cancer4,7,8,10,11,12,13,26,27,28,29,30,31.
One limitation of the MMqPCR method is that it reports TL as a T/S ratio, a relative estimate of length that varies depending upon the selection of single-copy gene, master mix composition, and PCR cycling parameters32. The T/S ratio is unitless. Thus, without combining with other TL measurement methodologies, this method is incapable of reporting estimates in base pair values18,33,34. As a result, the T/S ratio must be transformed to a Z-score to have relevance across studies35. Substantial caution should be taken when doing this across laboratories, methods, and assays. Further, this method, as with gel-based hybridization assays, can include quantification of interstitial telomeres. However, these sequences comprise a very small proportion of total telomere DNA content per genome. In addition, interstitial telomeric sequences are more likely to contain mismatched base pair sequences which deviate from canonical telomere repeats, decreasing the likelihood of primer binding and amplification. Additionally, while the minimal amount of DNA needed for the MMqPCR assay is advantageous, it is important to note that qPCR-based measurements of TL are influenced by pre-analytical factors impacting DNA quality and integrity, including sample storage conditions, DNA extraction methodology, and biological tissue36,37. It has been shown that analytical control for these factors can enhance the external validity of TL measurements generated using qPCR38. Even so, the impact of differences in DNA quality on TL generated by MMqPCR assay specifically needs to be systematically evaluated, as no current data-informed guidance exists for determining if a sample is of sufficient quality to generate an accurate estimate of TL using this approach. Despite these limitations, the applications of this assay for studies on population level health outcomes are considerable.
When utilizing the MMqPCR assay, continual assessment of precision and throughput is needed. As currently designed, technicians run triplicates of samples simultaneously on duplicate plates using two thermocyclers. In the absence of multiple thermocyclers, we recommend retaining duplicate-triplicate measurements and running plates sequentially for enhanced precision even at the cost of diminished throughput. Any decision to prioritize throughput over precision, for example by employing single triplicate measurements, should be accompanied with thorough testing and evaluation of the resulting ICCs before proceeding with analysis of analytical samples. When making decisions regarding throughput and precision, one must take into consideration the sample size and the quality of the sample DNA. A smaller sample size or poor-quality DNA samples necessitates prioritizing higher precision23. This is of even greater importance when working with samples from related groups (e.g., family members, subjects with multiple timepoints). In these instances, careful planning, for example assigning related samples to the same plate prior to starting the experiment, is one way to prevent loss of statistical power through inadvertent group by plate confounding.
For this assay, a spectrophotometer was used to assess DNA sample quality: samples within the range of 1.6-2.0 for 260/280 ratios and 2.0-2.2 for 260/230 ratios were considered acceptable. This quality assessment and the accurate assessment of double-stranded DNA via fluorometer are critical steps in this protocol for obtaining repeatable TL data. Other, more descriptive measures of DNA integrity, such as fragment size and/or summary measures of DNA quality determined via agarose gel (e.g., DNA integrity number) may also be utilized in determining sample quality38. We also recommend that the dilution of samples only occur at the time of sample preparation for running the MMqPCR assay. This ensures that DNA aliquots undergo the least amount of manipulation after extraction as possible, decreasing the variability in pre-assay handling. Should DNA samples need to be transported, they should be shipped on dry ice at the highest possible concentration to mitigate the degradation that occurs in DNA samples at lower concentrations39,40. Due to the degradation of DNA that occurs with freeze-thaw cycles, the number of freeze-thaws to stock DNA should be minimized41. Aliquots of the pooled control DNA should be created before running the cohort and aliquots of individual analytical DNA samples should be created prior to running the assay.
Key metrics of assay performance and QC include NTC signal, interplate and intraplate CVs, and standard curve R2. Failure to meet QC criteria can be mitigated in several ways. Changing PCR grade H2O stocks regularly and aliquoting PCR grade H2O sub-stocks for each pair of plates run will minimize sources of contamination as well as NTC amplification. Additional steps to abate contamination include the following: designating a specific PCR hood dedicated to only MMqPCR assay; wiping down the PCR hood and equipment with a DNA decontaminating solution; irradiating the room with ultra-violet light; and practicing sterile technique when in the PCR hood. To enhance assay repeatability and decrease CVs, it is recommended to vortex samples, dilutions, and the PCR strips vigorously at their respective vortex steps and resuspend thoroughly when pipetting DNA samples. A below threshold standard R2 curve (<0.995) is most likely attributable to pipetting errors during plate loading. To avoid this, pay careful attention to precise pipetting and calibrate pipets annually, vigorously mix standard PCR strips before loading, and carefully organize supplies to promote an efficient workflow. If using two machines and one plate is observed to output consistently higher CVs, the machine should be serviced as a potential way to ameliorate the problem. QC plates from the manufacturer should be run on the plates regularly to assess thermocycler's performance.
If problems persist even after application of the steps recommended above, the following steps can be used to troubleshoot the protocol. Keeping a record of when all reagents were aliquoted and any pertinent expiration dates can help streamline the troubleshooting process when difficulties inevitably arise. An important part of any troubleshooting process is to only adjust one reagent at a time to determine the specific cause of plates not passing the QC criteria, starting with the least expensive reagent in question. For example, if both the telomere and single copy gene have low efficiencies, shared reagents such as the DTT, dNTPs, or SYBR aliquot are more likely the cause than amplicon specific primers. At the listed price, new aliquots should be tested in order of DTT, then dNTPs, and then finally, if the issue still persists, new SYBR aliquots. Conversely, if only one of amplicons (telomere or single copy gene) has a low efficiency, the cause of difficulty is more likely one of the primers. Interpretation of the melt curve peaks presented in Figure 8 can serve as a source of key information for troubleshooting. Visualization of the two melt curve peaks can be used to identify potential issues with a particular sample, as an individual problem sample will stand out from the general trend of peaks exhibited by standards or remaining analytical samples. The melt curve can also be used to diagnose problems with a particular primer if the peaks for a given amplicon are systematically less sharp than the other.
This manuscript details how to successfully set up the MMqPCR assay for measuring TL with broad applicability to public health research and introduces key recommendations for QC and troubleshooting with the goal of increasing accessibility and reliability of this efficient and cost-effective method.
Disclosures
The authors have nothing to disclose.
Acknowledgements
The authors would like to acknowledge the Telomere Research Network Advisory Committee and the National Institute on Aging / National Institute of Environmental Health Sciences funding (U24 AG066528 and U24 AG066528-S1) that have made this work possible.
Materials
| Name | Company | Catalog Number | Comments |
|---|---|---|---|
| 0.5mL Tubes | USA Scientific | 1605-0099 | Seal-Rite 0.5mL Microcentrifuge Tubes, Sterile Storage Temperature and Conditions: Room temperature |
| 1.5mL Tubes | USA Scientific | 1615-5599 | Seal-Rite 1.5mL Microcentrifuge Tubes, Sterile Storage Temperature and Conditions: Room temperature |
| 100mM DTT | In House | Not Applicable | Made with stock DTT, diluted sodium acetate, and PCR Grade H2O Storage Temperature and Conditions: minus 20 °C |
| 15mL Tubes | Thermo Fisher | 14-959-53A | Corning 352196 Falcon 15mL Conical Centrifuge Tubes Storage Temperature and Conditions: Room temperature |
| 1M MgCl2 | Thermo Fisher | 50152107 | Biotang Inc 1M MgCl2 1M Magnesium Chloride Solution, Prepared in 18.2 Megohms Water and Filtered through 0.22 Micron Filter Storage Temperature and Conditions: 4 °C |
| 1x Gold Buffer | In House | Not Applicable | 10X Gold Buffer diluted with PCR Grade H2O Storage Temperature and Conditions: minus 20 °C |
| 25mM dNTPs | New England BioLabs | N0446S | Deoxynucleotide Solution Set Storage Temperature and Conditions: minus 20 °C |
| 5mL Tubes | Thermo Fisher | 3391276 | Argos Technologies Microcentrifuge Tubes – 5mL Storage Temperature and Conditions: Room temperature |
| 96 Well Plate | Bio-Rad | HSP9601 | Hard-Shell 96-Well PCR Plates, Low Profile, Thin Wall, Skirted, White / Clear Storage Temperature and Conditions: Room temperature |
| Aluminum Foil | Office Depot | 3489072 | Reynolds Wrap Stanard Aluminum Foil Roll, 12" x 75', Silver Storage Temperature and Conditions: Room temperature |
| AmpliTaq Gold Kit – Polymerase and Buffer | Thermo Fisher | 4311806 | AmpliTaq Gold DNA Polymerase with Gold Buffer and MgCl2 (MgCl2 in this kit is not used), 10X Gold Buffer, 2.5U AmpliTaq Gold Polymerase Storage Temperature and Conditions: minus 20 °C |
| Betaine | Thermo Fisher | AAJ77507AB | Betaine, 5M Solution, Molecular Biology Grade, Ultrapure, 10mL Storage Temperature and Conditions: minus 20 °C |
| Big Tube Rack | Thermo Fisher | 344817 | Fisherbrand 4-Way Tube Rack Storage Temperature and Conditions: Room temperature |
| CFX Maestro Software | Bio-Rad | 12004110 | Software for real-time PCR plate setup, data collection, statistics, and graphiing of results Storage Temperature and Conditions: Room temperature |
| CFX96 Optical Reaction Module for Real-Time PCR Systems with Starter Package | Bio-Rad | 1845096 | 96-well optical module for real-time PCR Storage Temperature and Conditions: Room temperature |
| DTT | Fisher Scientific | AAJ1539706 | Dithiothreitol, >99.5+ Molecular Biology Grade, 5 g Storage Temperature and Conditions: minus 20 °C |
| ELIMINase | Fisher Scientific | 04-355-32 | ELIMINase Laboratory Decontaminant Storage Temperature and Conditions: Room temperature |
| HEPA Filter | USA Scientific | Replacement Filters | High-Efficiency Particulate Air Filter for AirClean Workstations Storage Temperature and Conditions: Room temperature |
| Kimwipes | Thermo Fisher | 06666A | Kimberly-Clark Professional Kimtech Science Kimwipes Delicate Task Wipers, 1-Ply Storage Temperature and Conditions: Room temperature |
| Loading Trough | Thermo Fisher | 14387069 | Thermo Scientific Matrix Reagent Reservoirs Storage Temperature and Conditions: Room temperature |
| Microsoft Excel | Microsoft | Not Applicable | Microsoft 365 package, Excel software application Storage Temperature and Conditions: Room temperature |
| Mini Centrifuge | Genesee Scientific | 31-500B | Poseidon 31-500B Mini Centrifuge, Blue Lid Storage Temperature and Conditions: Room temperature |
| PCR Grade H2O | Thermo Fisher | AM9937 | Nuclease-Free Water (not DEPC-Treated) Storage Temperature and Conditions: Room temperature |
| PCR Hood | USA Scientific | 4263-2588 | Nucleic Acid Workstation with HEPA Filtration, AirClean Systems Combination PCR Workstation Storage Temperature and Conditions: Room temperature |
| PCR Strips | Thermo Fisher | AB0776 | Low Profile Tubes and Flat Caps, Strips of 8 Storage Temperature and Conditions: Room temperature |
| PCR Tube Rack | Thermo Fisher | 344820 | Fisherbrand 96-Well PCR Tube Rack Storage Temperature and Conditions: Room temperature |
| Pipette Tips (Multichannel) | Ranin | 17005860 | Pipette Tips SR LTS 20µL F 960A/5, 20µL Maximum Storage Temperature and Conditions: Room temperature |
| Pipette Tips (Single Channel) | USA Scientific | 1181-3850 | 10µL Graduated TipOne RPT Filter Tips Storage Temperature and Conditions: Room temperature |
| Pipette Tips (Single Channel) | USA Scientific | 1180-1850 | 20µL Beveled TipOne RPT Filter Tips Storage Temperature and Conditions: Room temperature |
| Pipette Tips (Single Channel) | USA Scientific | 1111-0880 | 200µL Natural TipOne Pipette Tips in Racks Storage Temperature and Conditions: Room temperature |
| Pipette Tips (Single Channel) | USA Scientific | 1111-2890 | 1000µL Natural Graduated TipOne Pipette Tips in Racks Storage Temperature and Conditions: Room temperature |
| Pipettors (Multichannel) | Ranin | 17013802 | Pipet-Lite Multi Pipette L8-10XLS, 0.5 to 10µL Storage Temperature and Conditions: Room temperature |
| Pipettors (Multichannel) | Ranin | 17013803 | Pipet-Lite Multi Pipette L8-20LS+, 2 to 20µL Storage Temperature and Conditions: Room temperature |
| Pipettors (Single Channel) | Thermo Fisher | F144802G | Gilson Pipetman Classic Pipets, 1 to 10µL Storage Temperature and Conditions: Room temperature |
| Pipettors (Single Channel) | Thermo Fisher | F123600 | Gilson Pipetman Classic Pipets, 2 to 20µL Storage Temperature and Conditions: Room temperature |
| Pipettors (Single Channel) | Thermo Fisher | F123601 | Gilson Pipetman Classic Pipets, 20 to 200µL Storage Temperature and Conditions: Room temperature |
| Pipettors (Single Channel) | Thermo Fisher | F123602 | Gilson Pipetman Classic Pipets, 200 to 1000µL Storage Temperature and Conditions: Room temperature |
| Plate Sealing Film | Bio-Rad | MSB1001 | Microseal “B” PCR Plate Sealing Film, Adhesive, Optical Storage Temperature and Conditions: Room temperature |
| Plate Spinner | Thermo Fisher | 14-100-141 | Fisherbrand Mini Plate Spinner Centrifuge, 230 V Storage Temperature and Conditions: Room temperature |
| Pre-Hood Filter | USA Scientific | 4235-3724 | Prefilter for AirClean Systems Workstations Storage Temperature and Conditions: Room temperature |
| R Software | The R Project for Statistical Computing | Not Applicable | R version 4.2.2 Storage Temperature and Conditions: Room temperature |
| Scale | Thermo Fisher | 01-922-329 | OHAUS 30430060 PR Series Analytical Balance, 62g Capacity Storage Temperature and Conditions: Room temperature |
| Scissors | Office Depot | 458612 | Office Depot Brand Scissors, 8”, Straight, Black, Pack of 2 Storage Temperature and Conditions: Room temperature |
| Sharpies | Sharpie | 2151734 | Brush Twin Permanent Markers, Black Storage Temperature and Conditions: Room temperature |
| Single Copy Gene Forward Primer | Integrated DNA Technologies | Custom | See separate table Storage Temperature and Conditions: minus 20 °C when rehydrated |
| Single Copy Gene Reverse Primer | Integrated DNA Technologies | Custom | See separate table Storage Temperature and Conditions: minus 20 °C when rehydrated |
| Small Tube Rack | Thermo Fisher | 21-402-17 | Thermo Fisher 8601 Reversible Microtube Racks with Lid Storage Temperature and Conditions: Room temperature |
| Sodium Acetate | Thermo Fisher | J63560.EQE | 3M NaOAc pH 5.2 Storage Temperature and Conditions: Room temperature |
| Stainless Steel Spatula | Thermo Fisher | 3990240 | Bel-Art SP Scienceware Stainless-Steel Sampling Spoon and Spatula Storage Temperature and Conditions: Room temperature |
| SYBR Green | Thermo Fisher | S7563 | SYBR Green I Nucleic Acid Gel Stain – 10,000X Concentrate in DMSO Storage Temperature and Conditions: minus 20 °C when rehydrated |
| Syringe Filters | Fisher Scientific | 09-927-55A | GD/X 25 mm Sterile Syringe Filter, cellulose acetate filtration medium, 0.2 μm Storage Temperature and Conditions: Room temperature |
| Syringes | Thermo Fisher | 148232A | BD Luer-Lok Disposable Syringes without Needles, 10mL Storage Temperature and Conditions: Room temperature |
| TE Buffer | Fisher Scientific | BP2474100 | TE Buffer, Tris-EDTA, 1X Solution, pH 7.6, Molecular Biology, Fisher BioReagents Storage Temperature and Conditions: Room temperature |
| Telomere Forward Primer | Integrated DNA Technologies | Custom | See separate table Storage Temperature and Conditions: minus 20 °C when rehydrated |
| Telomere Reverse Primer | Integrated DNA Technologies | Custom | See separate table Storage Temperature and Conditions: minus 20 °C when rehydrated |
| UV Light | USA Scientific | 4288-2540 | UV Light Bulb for Workstations Storage Temperature and Conditions: Room temperature |
| Vortex | Thermo Fisher | 14-955-151 | Fisherbrand Mini Vortex Mixer, 115 V, 50/60 Hz Storage Temperature and Conditions: Room temperature |
| Weigh Boat | Thermo Fisher | 01-549-752 | Fisherbrand Sterile Hexagonal Weighing Boat, 10mL Storage Temperature and Conditions: Room temperature |
References
- Hemann, M., Strong, M., Hao, L., Greider, C. The shortest telomere, not average telomere length, is critical for cell viability and chromosome stability. Cell. 107 (1), 67-77 (2001).
- Xu, L., Li, S., Stohr, B. A. The role of telomere biology in cancer. Ann Rev Pathol: Mech Dis. 8, 49-78 (2013).
- Lindrose, A., Drury, S. Minimum reporting recommendations for pcr-based telomere length measurement. Telomere Research Network. , (2020).
- Verhulst, S., et al. Commentary: The reliability of telomere length measurements. Int J Epidemiol. 44 (5), 1683-1686 (2015).
- Aubert, G., Hills, M., Lansdorp, P. M. Telomere length measurement-caveats and a critical assessment of the available technologies and tools. Mutat Res. 730 (1-2), 59-67 (2012).
- Mundstock, E., et al. Effect of obesity on telomere length: Systematic review and meta-analysis. Obesity. 23 (11), 2165-2174 (2015).
- Haycock, P. C., et al. Leucocyte telomere length and risk of cardiovascular disease: Systematic review and meta-analysis. BMJ. 349, 4227(2014).
- Astuti, Y., Wardhana, A., Watkins, J., Wulaningsih, W. Cigarette smoking and telomere length: A systematic review of 84 studies and meta-analysis. Environ Res. 158, 480-489 (2017).
- Ridout, K. K., Ridout, S. J., Price, L. H., Sen, S., Tyrka, A. R. Depression and telomere length: A meta-analysis. J Affect Disord. 191, 237-247 (2016).
- Wang, Q., Zhan, Y., Pedersen, N. L., Fang, F., Hägg, S. Telomere length and all-cause mortality: A meta-analysis. Ageing Res Rev. 48, 11-20 (2018).
- Hu, R., Hua, X. G., Jiang, Q. C. Associations of telomere length in risk and recurrence of prostate cancer: A meta-analysis. Andrologia. 51 (7), e13304(2019).
- Schneider, C. V., et al. Association of telomere length with risk of disease and mortality. JAMA Inter Med. 182 (3), 291-300 (2022).
- Deng, Y., et al. Telomere length and the risk of cardiovascular diseases: A mendelian randomization study. Front Cardiovasc Med. 9, 1012615(2022).
- D'mello, M. J., et al. Association between shortened leukocyte telomere length and cardiometabolic outcomes: Systematic review and meta-analysis. Circulation: Cardiovasc Gene. 8 (1), 82-90 (2015).
- Wilbourn, R. V., et al. The relationship between telomere length and mortality risk in non-model vertebrate systems: A meta-analysis. Philos Trans R Soc Lond B Biol Sci. 373 (1741), 20160447(2018).
- Gardner, M., et al. Gender and telomere length: Systematic review and meta-analysis. Exp Gerontol. 51, 15-27 (2014).
- Lai, T. -P., Wright, W. E., Shay, J. W. Comparison of telomere length measurement methods. Philos Trans R Soc Lond B Biol Sci. 373 (1741), 20160451(2018).
- Cawthon, R. Telomere measurement by quatitative pcr. Nuc Acid Res. 30 (10), e47-e53 (2002).
- Cawthon, R. M. Telomere length measurement by a novel monochrome multiplex quantitative pcr method. Nuc Acid Res. 37 (3), e21-e21 (2009).
- Lindrose, A. R., et al. Method comparison studies of telomere length measurement using qpcr approaches: A critical appraisal of the literature. PLoS One. 16 (1), e0245582(2021).
- Lin, J., et al. Effects of DNA extraction, DNA integrity, and laboratory on the precision of qpcr-based telomere length measurement - a multi-lab impartial study. bioRxiv. , (2022).
- Wilfinger, W. W., Mackey, K., Chomczynski, P. Effect of ph and ionic strength on the spectrophotometric assessment of nucleic acid purity. Biotechniques. 22 (3), 474-481 (1997).
- Boesenberg-Smith, K. A., Pessarakli, M. M., Wolk, D. M. Assessment of DNA yield and purity: An overlooked detail of pcr troubleshooting. Clin Microbiol Newsletter. 34 (1), 1-6 (2012).
- Harley, C. B., Futcher, A. B., Greider, C. W. Telomeres shorten during ageing of human fibroblasts. Nature. 345 (6274), 458-460 (1990).
- Kimura, M., et al. Measurement of telomere length by the southern blot analysis of terminal restriction fragment lengths. Nat Protoc. 5 (9), 1596-1607 (2010).
- Ye, Q., et al. Telomere length and chronological age across the human lifespan: A systematic review and meta-analysis of 414 study samples including 743,019 individuals. Ageing Res Rev. 90, 102031(2023).
- Axelrad, M. D., Budagov, T., Atzmon, G. Telomere length and telomerase activity; a yin and yang of cell senescence. J Vis Exp. (75), e50246(2013).
- Liu, M., et al. Immune-mediated inflammatory diseases and leukocyte telomere length: A mendelian randomization study. Front Genetics. 14, 1129247(2023).
- Van Ockenburg, S., et al. Stressful life events and leukocyte telomere attrition in adulthood: A prospective population-based cohort study. Psychol Med. 45 (14), 2975-2984 (2015).
- Zong, Z. Q., et al. Ambient air pollution exposure and telomere length: A systematic review and meta-analysis. Public Health. 215, 42-55 (2023).
- Tang, L., Li, D., Wang, J., Su, B., Tian, Y. Ambient air pollution, genetic risk and telomere length in uk biobank. J Expo Sci Environ Epidemiol. , (2023).
- Aubert, G., Hills, M., Lansdorp, P. Telomere length measurement-caveats and a critical assessment of the available technologies and tools. Mutat Res. 730 (1), 59-67 (2012).
- Lin, J., et al. Systematic and cell type-specific telomere length changes in subsets of lymphocytes. J Immunol Res. 2016, 5371050(2016).
- Needham, B. L., et al. Socioeconomic status, health behavior, and leukocyte telomere length in the national health and nutrition examination survey, 1999-2002. Soc Sci Med. 85, 1-8 (2013).
- Verhulst, S. Improving comparability between qpcr-based telomere studies. Mol Ecol Res. 20 (1), 11-13 (2020).
- Dagnall, C. L., et al. Effect of pre-analytic variables on the reproducibility of qpcr relative telomere length measurement. PloS one. 12 (9), e0184098(2017).
- Lin, J., Smith, D. L., Esteves, K., Drury, S. Telomere length measurement by qpcr-summary of critical factors and recommendations for assay design. Psychoneuroendocrinology. 99, 271-278 (2019).
- Wolf, S. E., et al. Cross-tissue comparison of telomere length and quality metrics of DNA among individuals aged 8 to 70 years. PLOS One. 19 (2), e0290918(2024).
- RoDer, B., FruHwirth, K., Vogl, C., Wagner, M., Rossmanith, P. Impact of long-term storage on stability of standard DNA for nucleic acid-based methods. J Clin Microbiol. 48 (11), 4260-4262 (2010).
- Dagnall, C., et al. Effect of pre-analytic variables on the reproducibility of qpcr relative telomere length measurement. PLoS One. 12 (9), e0184098(2017).
- Shao, W., Khin, S., Kopp, W. C. Characterization of effect of repeated freeze and thaw cycles on stability of genomic DNA using pulsed field gel electrophoresis. Biopreserv Biobank. 10 (1), 4-11 (2012).
- Institute for Statistics and Mathematics of WU. The Comprehensive R Archive Network. , Available from: https://cran.r-project.org/ (2024).
- Nakagawa, S., Schielzeth, H. Repeatability for Gaussian and non-Gaussian data: a practical guide for biologists. Biol Rev. 85 (4), 935-956 (2010).
Reprints and Permissions
