A system for the automated and rapid analysis of glycans on proteins was previously developed. This article presents the protocol for "glyco-qualitative analysis," optimized for a broad spectrum of users, such as those engaged in analyzing glycan structures in biopharmaceuticals and other glycoconjugate materials.
Method Article
Rapid Glyco-Qualitative Assessment of Recombinant Proteins Using a Fully Automated System
In This Article
Summary
Abstract
Protein glycosylation, a critical post-translational modification, influences the stability, efficacy, and immunogenicity of recombinant proteins, including biopharmaceuticals. Glycan structures exhibit significant heterogeneity, varying with production cell types, culture conditions, and purification methods. Consequently, monitoring and evaluating the glycan structures of recombinant proteins is vital, particularly in biopharmaceutical production. The lectin microarray, a technique complementary to mass spectrometry, boasts high sensitivity and ease of use. However, it typically requires more than a day to yield results. To adapt it to non-glycoscience research or drug product process development, an automated, high-throughput alternative is needed. Therefore, the world's first fully automated lectin-based glycan profiling system was developed, utilizing the "bead array in a single tip (BIST)" technology concept. This system allows for the preparation and storage of lectin-immobilized beads in units of 1,000, with customizable parallel insertion orders for various purposes. This article presents a practical protocol for research involving "glyco-qualified" recombinant proteins. After testing their reactivity against 12 polyacrylamide-glycan conjugates, 15 lectins were selected to increase the system's versatility. In addition, the sample labeling process was optimized by switching from Cy3 to biotin, reducing the overall processing time by 30 min. For immediate data qualification, lectin-binding signals are displayed as a dotcode on the top monitor. The system's reliability was confirmed through day-to-day reproducibility tests, repeatability tests, and long-term storage tests, with a coefficient of variation of <10%. This user-friendly and rapid glyco-analyzer has potential applications in the quality monitoring of endogenous glycoproteins for biomarker evaluation and validation. This method facilitates analysis for those new to glycoscience, thereby broadening its practical utility.
Introduction
Protein glycosylation is a crucial post-translational modification that needs to be assessed in biopharmaceuticals. The glycan profiles of proteins can vary based on culture conditions, purification processes, and host cells1. Simple instruments are required to qualify glycosylation within the bioprocess pipeline. It is estimated that over 50% of secreted and membrane proteins in vivo are modified with multiple glycans, which change according to cell lineage, developmental stage, and disease status, such as the onset of malignancy2. Monitoring glycan profiles holds significant potential for identifying unique diagnostic markers and drug targets. Automated instruments capable of rapidly measuring large-scale sample sizes are in high demand to verify and validate such aberrant glycosylation from hundreds of patient samples in the discovery pipeline.
Microarray technology has been incorporated into glycomics for evaluating the glycan profiling of glycoproteins3. In this method, several lectins, which are glycan-binding proteins, are immobilized on a surface such as a glass slide. This interaction-based glyco-analysis technology does not necessitate releasing glycans from core proteins beforehand, simplifying the process for researchers new to glycotechnology. Despite its widespread use, for industrial applications such as bioproduction, an automated system capable of quickly and easily monitoring glycans for a larger number of analysis targets was required. To address this, an automated glycan profiling system based on a unique concept termed "bead array in a single tip" (BIST), initially developed for genotyping, was previously reported. This system simplifies the process with a one-box type high-throughput auto-instrument4. Using tips in which various lectin-fixed beads are arranged in parallel4,5, a method for analyzing glycan structures modified in glycoproteins was established and named GlycoBIST (hereafter referred to as "automatic glycan profiling system") (Figure 1A). Lectins can be fixed on 1,000 beads and dried to maintain activity for a year, both before and after packing in a tip. Once tips and cartridges containing reagents such as HRP-labeled anti-streptavidin antibody (SA-HRP) are set in the measuring prototype instrument (an automated reaction measurement device, see Table of Materials), the tip functions as an autopipette. A chemiluminescence detection scanner at the instrument's interior rear quantifies the signals of eight tips simultaneously. The quantitative data from these eight tips are compactly and concurrently displayed as dot codes on the instrument's touchscreen for quick confirmation of measurement results. Furthermore, the value represented as the maximum of the measured peak is transported from the instrument as raw data, and it allows for graphing by individual researchers (Figure 1A, bottom panel).
In this article, the authors describe an improved method of biotin-labeling proteins, reducing processing time to 30 min. Target proteins are biotinylated in advance and detected by SA-HRP (Figure 1B). A standard GlycoBIST tip (specialized tip for automatic glycan profiling) with 15 selected lectins was constructed to achieve the versatile glycoprotein glycan profiling for analytical comprehensiveness.
Protocol
The details of the reagents and the equipment used for this study are listed in the Table of Materials.
1. Preparation of the specialized tip for automatic glycan profiling
- Bring the dried lectin-fixed beads, stored at 4 °C in a sealed bag, to the bench and allow them to return to room temperature (~23 °C).
NOTE: This prevents condensation on the beads, which can diminish their quality. This method of preparing lectin-fixing beads has been previously reported5. - Place an antistatic cloth on the desk and place the portable static eliminator facing the workspace. This allows subsequent work to be performed on the bench with antistatic protection (Figure 2A).
- Insert beads into the empty tip using antistatic tweezers such that two spacer beads are placed between the lectin-fixing beads (Figure 1A).
- Gently squeeze the top of the tip with nippers to close the opening, being careful not to cut the tip after all beads have been filled (Figure 2B).
NOTE: This is to secure the beads inside the tip. It is recommended that the nipper be crafted to avoid cutting the tip (Figure 2C). - Straighten the tip by hand if it is bent.
- Store the prepared tip at 4 °C in a sealed bag with a desiccant until needed.
NOTE: Prior to using the tip, it should be brought to room temperature before opening the sealed bag and taking it out. The moisture drastically reduces the reactivity of lectins.
2. Preparation of the analytes
- Prepack the biotinylation reagent for routine analysis.
NOTE: For routine analysis, it is helpful to prepack the biotinylation reagent (Biotin-(AC5)2 Sulfo-Osu, see Table of Materials) in small portions as follows for quick analysis. It is recommended that the biotinylation reagent be dried and stored, as its succinimidyl ester is generally susceptible to hydrolysis.- Dissolve the biotinylation reagent in deionized water.
- Dispense 10 µg of the reagent into tubes using a pipette.
- Dry the tubes with biotinylation reagent in a refrigerated vacuum concentrator and store them with a desiccant at 4 °C in a lightproof bag until use.
- Add the analyte solution (200 ng eq. protein) to the tube containing the dried biotinylation reagent prepared in step 2.1.
NOTE: Be mindful of the buffer composition used to dissolve and dilute the analytes, depending on the properties of the biotinylation reagent used. For example, avoid using primary amine reagents as buffers for amine coupling.This will prevent a reduction in the biotinylation efficiency of the analytes. - Mix well by vortexing, then spin down (1000 x g for 5 s at room temperature) in a tabletop centrifuge to drop the liquid on the lid to the bottom of the tube.
- Incubate the tubes for 1 h at room temperature, shielded from light.
- Dilute the biotinylated samples 10-fold in the Probing buffer (1% Triton X-100, 0.5 M Glycine, 1 mM CaCl2, and 1 mM MnCl2 in TBS) to inactivate any unreacted biotinylation reagents.
NOTE: In the case of reactions by amine coupling, the unreacted biotinylation reagent is consumed by the reaction with a buffer containing a primary amine reagent such as Tris in TBS, which prevents the biotinylation of lectins and other substances immobilized on the beads in the subsequent measurement. - Incubate at room temperature, shielded from light, for 2 h.
- Assess the biotinylation efficiency of the analytes through Western blotting, using HRP-labeled streptavidin as a detection probe if necessary.Please refer to the literature for Western blotting methods6.
3. Preparation of reagents for glycan profiling with the automated reaction measurement device
- Dilute the HRP-conjugated streptavidin with the blocking solution in a 1:3000 ratio.
- Mix with equal volumes of Substrate A and Substrate B (see Table of Materials). Use 160 µL of mixed substrate per sample.
- Dispense the blocking solution, wash buffer (0.1% Triton X-100/TBS), TBS, HRP-conjugated streptavidin solution, and each substrate into the designated wells of a cartridge with 10 liquid reservoirs.
NOTE: The recommended volume and placement of solutions to fill each well of the reaction cartridge are described below. However, the solutions and well arrangement can be changed in the automated reaction measurement device as appropriate in advance.- Add 0.2 mL of HRP-labeled streptavidin prepared in step 3.1. to well #2 using a pipette. The well is named #1 from the front of the cartridge.
- Add 0.2 mL of blocking solution to well #3 using a pipette.
- Add 1 mL of TBS to wells #4 and #6 using a pipette.
- Add 1 mL of wash buffer to wells #7 and #8 using a pipette.
- Add 0.16 mL of substrate mixture to well #10 using a pipette.
- Confirm that wells #1, #5, and #9 are empty.
- Add the analytes prepared in step 2 to a 2 mL-protein-low adsorbent screwcap microtube.
- Open the front door of the automated reaction measurement device.
- Set the liquid reservoirs prepared in step 3.3, the tips prepared in 1, and the analytes prepared in step 3.4 in the designated positions of the automated reaction measurement device (Figure 2D) as follows.Each measurement is performed in a single vertical line direction.
- Place one tip prepared in step 1 in each hole at the position "a" yellow symbol in Figure 2D.
NOTE: Again, if refrigerated, bring the tips to room temperature before opening the sealed bag. Lectins lose their signal dramatically due to moisture. - Remove the lid of the tube containing the analyte prepared in step 3.4 and insert it into each hole at position "b" similarly.
- Insert the cartridge containing the liquid prepared in step 3.3, being careful not to spill it at position "c".
- Remove the entire "waste box" in Figure 2D when it is full, dump the contents into the trash bin, and return the "waste box" to its original position.
NOTE: The reacted tips are automatically collected in the "waste box" after measurement.
- Place one tip prepared in step 1 in each hole at the position "a" yellow symbol in Figure 2D.
4. Glycan profiling with the automated reaction measurement device
- Turn on the power switch on the side of the main unit.
- Touch the "Start Diagnosis" button displayed on the screen (Figure 3A). The self-diagnostic program starts automatically. After a while, the self-diagnostic program is completed, and the HOME screen appears (Figure 3B).
NOTE: The following operations can be performed by touching the respective icons. "Assay" to start measurement. "Maintenance" to confirm any system error. "History" to view past measurement data. - Touch "Assay" displayed on the HOME screen to select the protocol (Figure 3B).
- Select the "BAssaySTD" of the assay method (Figure 3C) and then press "Next" on the lower right.
- Enter the sample name (Figure 3D) for each sample as necessary and then touch "Next" on the lower right.
- Enter the tip name (Figure 3E) used for each sample as necessary and then touch "Next" on the lower right.
- Confirm the notes to the right (Figure 3F), and if there is no problem, touch "Start" on the lower right for measurement.
- Confirm the screen switch to the running mode (Figure 3G) and wait until the "finalize" arrow is highlighted. If necessary, touch "Break" to stop running mode.
NOTE: The operations automatically controlled by the automated reaction measurement device are as follows: (1) Auto-micropipette nozzles inside the instrument attach a maximum of eight -tips simultaneously (see the symbol yellow "a" in Figure 2D); (2) Repeatedly aspirate/discharge the solution in the tube containing the analyte for 5 min; (3) Transfer to the blocking solution and aspirate/discharge for 5 min; (4) Transfer to TBS and aspirate/discharge for 2 min; (5) Transfer to the HRP-labeled streptavidin solution and aspirate/discharge 5 min; (6) Transfer to the wash buffer and aspirate/discharge for 7 min; (7) Transfer to TBS and aspirate/discharge for 2 min; (8) Transfer to substrate mixture and aspirate at once; (9) Scan the chemiluminescence of eight tips simultaneously at the back of the device to obtain peak data; (10) Drop used tips into the waste box; (11) Nozzle returns to the initial position. - Confirm that the screen has changed to the result mode (Figure 3H) when the measurement is completed. The eight dotcodes are simultaneously displayed on the screen for easy verification.
NOTE: Touch the "History" on the lower left to display the Scan chart (Figure 3I,J), bar graph (Figure 3K,L), table (Figure 3M), and detail (Figure 3N) as the result on the screen. View the Results from other lanes from the drop-down "Lane" list. - Insert a USB memory into the USB port on the side of the main unit and touch "Export" on the lower right of the result mode to save the data of all lanes individually in the USB memory.
- Export the raw data (Figure 3M) as a CSV file using a USB port for further data analysis and individual graphing in Excel. "Value" of the table denotes the signal intensity of each lectin. The values of intensity represent the maximum value of the peak data (Figure 3I,J) in the scan of reacted tips.
NOTE: The peak extraction threshold can be set. Depending on the analytes, the signal in the spacer bead portion may be higher overall, in which case the value in the spacer portion is subtracted as background.
Results
First, the signal distribution is shown for each lectin to understand the characteristics of the lectin bead array. A library of lectin-fixed beads (1,000 beads each) was prepared. Fifteen beads were randomly picked from the 1,000 and added to a single tip. A typical chart is shown at the bottom of Figure 1A, representing almost the same signal intensity observed among the 15 beads immobilizing the same lectin. This measurement procedure can be applied to qualify hand-made lectin bead production prior to the use of glycan profiling. For instance, six tips are used for the simultaneous measurement to calculate the coefficient of variation (CV) from the signals on the 90 beads. A typical example is shown in Table 1. When the lectin-fixed beads library was expanded to accommodate 28 different lectins, 25 out of 28 lectins demonstrated high reproducibility with a CV of less than 10%.
Next, the data for a lectin bead array with 15 different lectins are shown. The 15 lectins shown in Table 2 were selected for the lectin bead array. Additionally, 12 polyacrylamide (PAA) mono/di/trisaccharides listed in Table 3 were measured. After assessing the measurement reliability using a dotcoding display on the screen, the raw data were exported from the automated reaction measurement device (see protocol step 4.11), and a graph was created in Excel using the reaction peak values at each saccharide (Figure 4A). These values were then used for principal component analysis to visualize the correlation between the selected 15 lectins and the reacted saccharides (Figure 4B,C). This resulted in a distinct difference in the binding pattern of each lectin against the 12 PAA-sugars shown in Figure 4A. Herein, the validity of each signal is shown to refer to integrated previous lists of lectin and saccharide specificities7,8 (also refer to these specificities in Table 2). As AAL binds to terminal α-Fuc, Sia-Lex, and Lex, automatic glycan analysis confirmed AAL's recognition of fucose-containing molecules (Figure 4A). SSA and MAL (see Table 2 for the full names of lectins and given abbreviations) recognized Siaα2-6Gal/GalNAc and Siaα2-3Gal, respectively. MAL in the bead array can also bind to 3'-O-sulfo-Galβ3GalNAc and LacNAc. This is consistent with previous results analyzed using machine learning7, in which MAL prefers the 3'-O-sulfo-Gal dominantly, whereas LacNAc is not dominant9. RCA120, a Gal-recognizing lectin, strongly reacted with terminal β-Gal, including Lac/LacNAc, and was permitted to bind to Siaα2-6Lac but not Siaα2-3Lac. ECA had reactivity with LacNAc much higher than Lac. WFA had a broader specificity, which recognized not only α/β-GalNAc but also terminal β-Gal as reported7,10. GSL II, which recognizes GlcNAc and a galactosylated tri/tetra-antennary N-glycans, did not bind to any saccharides except for a single GlcNAc among the prepared analytes. GRFT, which recognizes high mannose-type N-glycans, reacted with α-Man. ABA, Jacalin, and MAH have been generally used to detect O-glycans. As ABA prefers the Galβ1-3GalNAcα-Thr/Ser (T) and sialyl-T structures, ABA in the bead array strongly reacted with 3'-O-sulfo-Galβ1-3GalNAc and weakly bound to α-GalNAc. ABA also recognized β-GlcNAc, consistent with the previous reports on binding to agalactosylated N-glycans7. Jacalin has a relatively broader specificity and thus reacted with α-mannose, β-GalNAc, βGal, α-GalNAc, 3'-O-sulfo-Galβ1-3GalNAc. MAH specifically recognized 3'-O-sulfate-Galβ1,3GalNAc as previously reported7. The residual four lectins, NPA, LCA, PHA-L, and PHA-E, recognized the internal structure of N-glycan not included in the prepared PAA saccharides and thus had no affinity with all analytes.
Using the obtained data, the similarity of lectins contributing to the binding to each saccharide can be clarified by plotting them on a principal component analysis graph (Figure 4B). All of the saccharides that contributed to the variance in Figure 4B were represented by eigenvector, a method of statistical analysis in which the contribution ratio is represented by a vector (Figure 4C). It is noteworthy here that the reacted saccharides contribute to each lectin without bias. Lectins do not exhibit specificity for only one type of saccharide. For example, the presence of complex-type glycans is determined by the partial recognition of some glycans within complex-type glycans in humans. Jacalin, which recognizes O-glycans (see the specificities in Table 2), can recognize the 3'suTF structure and α-GalNAc among the saccharides used in this study, and therefore, the 3'suTF and α-GalNAc were plotted (Figure 4C) against the position direction of Jacalin (brown dot) plotted in Figure 4B. WFA can recognize α/β-GalNAc among the saccharides used in this study; therefore, α/β-GalNAc in Figure 4C was plotted in the same direction as the WFA plotted in Figure 4B. In contrast, α-GalNAc is plotted between WFA and Jacalin because it is a saccharide structure that Jacalin is capable of binding to easily. All 11 saccharides plotted in this study are consistent with the specificity (saccharide binding) of lectins reported previously7,8, indicating that the proposed method is a reliable measurement method. Furthermore, the eigenvectors corresponding to each saccharide are dispersed, supporting that the 15 lectins were selected with minimal bias to ensure comprehensive coverage in the analysis. Consequently, the tip replenished with these 15 lectins was defined as the standard GlycoBIST-tip (Table 2).
In the more practical example, purified protein products were subjected to the tip measurement (Figure 5). Bovine thyroglobulin, which has an N-glycosylation site and contains complex, hybrid, and high mannose-type N-glycans11, was analyzed. The standard tip indicated increased reactivity of certain lectins to the saccharides8 (please refer to the specificities in Table 2): PHA-E, which recognizes bisecting GlcNAc; GRFT, recognizing mannose-type N-glycans; SSA, recognizing Siaα2-6Gal/GalNAc; RCA120, recognizing lactose and LacNAc; and AAL, recognizing fucose. These glycan structures are present in complex, hybrid, and high mannose-type N-glycans, suggesting that the N-glycan structure of thyroglobulin11 could be effectively evaluated. Furthermore, thyroglobulin treated with sialidase A, an enzyme that digests sialic acid, showed decreased reactivity with SSA, which recognizes sialic acid, and increased reactivity with RCA120, WFA, and ECA, which are more readily recognized after the removal of sialic acids. The presence of O-glycan structures in bovine thyroglobulin has not been previously reported. As expected, there was no recognition of O-glycan in thyroglobulin with or without sialidase treatment in the automatic glycan analysis.
A within-run reproducibility test using the 15 selected lectins is shown to understand the robustness of the measurement (Table 4). For this test, seven standard tips for analytes and an additional tip for negative control were prepared, and all eight tips were measured simultaneously. This procedure was repeated three times in a single day. "Mix Analytes," a combination of analytes that led to obtaining significant signals on all the lectins, were prepared for the quality control of the beads array. The Mix Analytes were formulated by appropriately mixing sialidase-digested erythropoietin (EPO), sialidase- and galactosidase-digested EPO, human IgA, matrix metalloproteinase 3 (MMP3), and thyroglobulin. Each glycoprotein (200 ng) was labeled with 10 µg of biotinylation reagent in PBS containing Triton X-100. If necessary, sialidase and galactosidase treatments were performed as described in the instructions. After digestion, the products were incubated in a heat block at 75 °C for 10 min to inactivate the enzyme. The appropriate amounts of biotinylated glycoproteins (3 ng of EPO, 8 ng of human IgA, 5 ng of MMP3, and 15 ng of thyroglobulin) were mixed immediately before analysis. The measurement results indicated that the maximum CV value was 13.5%, and the average CV for the 15 lectins was 8.2%, demonstrating high reproducibility.
Additionally, a day-to-day reproducibility test is shown to understand variations due to the measurement date (Table 5). Standard tips and Mix Analytes were prepared in advance, and measurements of seven tips were repeated daily for five consecutive days. The results showed that most lectins had a CV of less than 10%. However, some lectins, such as LCA and ECA, exhibited higher CVs. The average CV of the 15 lectins per cycle was up to 7.7%, and the average CV values over 5 days were less than 10%, signifying high reproducibility. It was noted that Jacalin, owing to the self-digestion of MMP3 in the Mix Analyte, demonstrated low temporal reproducibility. Therefore, a more suitable analyte should be identified to replace MMP3.
To understand the stability of lectin-fixed beads, a long-term stability test is shown using these dried lectin-fixed beads (Table 6). Standard tips, assay reagents, and Mix Analytes were prepared in advance, and measurements were performed after 12 months of storage. The aforementioned five types of biotinylated analytes were stored individually and mixed prior to measurement. The results showed that the average CV for the 15 lectins was less than 10%, even up to 12 months after dry storage. This suggests the feasibility of rapid and precise measurements by storing numerous tips (up to 1,000) from the same lot at once.
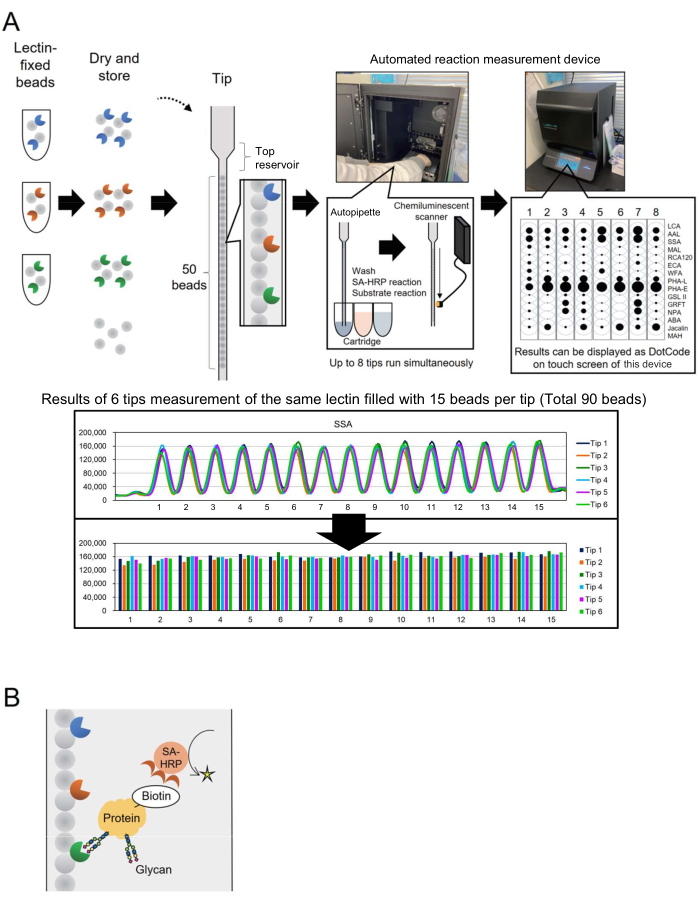
Figure 1: Schemes of the "bead array in a single tip" instrument and analysis method. (A) Scheme of automatic glycan profiling system. Lectin-fixed beads can be dried and stored in tips. When tips and cartridges containing reagents like HRP-labeled anti-streptavidin antibody (SA-HRP) are set in the measuring instrument (automated reaction measurement device) and activated, the tip functions as an autopipette. The chemiluminescence detection scanner at the instrument's rear quantifies signals from eight tips simultaneously. Quantitative data are displayed as dot codes on the instrument's touchscreen for rapid confirmation of measurement results. The lower section shows the results of measuring 90 beads with the same lectin. The measurement results are transported from the instrument and graphed by the individual researcher. (B) Scheme of the detection method used in this experiment. Target proteins are pre-biotinylated and detected using SA-HRP. Please click here to view a larger version of this figure.
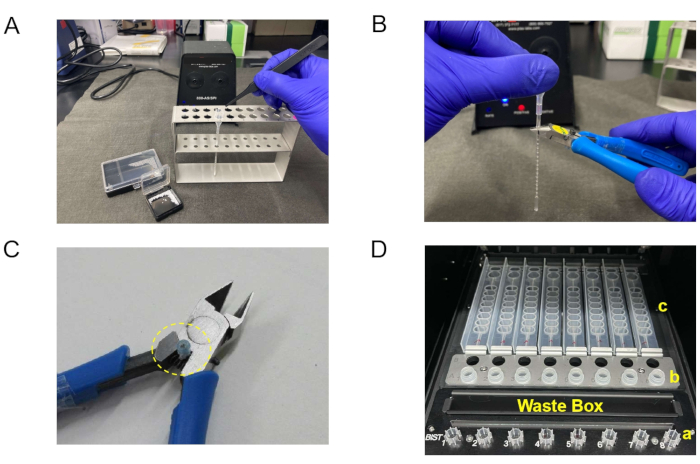
Figure 2: Images of materials and setup for automatic glycan profiling with the automated reaction measurement device. (A) Depiction of lectin-fixing beads being packed into a tip. Picking up the beads with antistatic tweezers on the antistatic mat and filling the tip with the beads. (B) Pinching the tip with a nipper. A slight upper portion of the top bead is squeezed. (C) A nipper for crimping the tips. The plastic (yellow circle) is pinched to prevent them from snipping completely. (D) Arrangement of materials used in the automated reaction measurement device. a: tips, b: tube containing analytes, and c: cartridges containing liquid should be inserted in place, respectively. In the waste box, the reacted tips are collected after measurement. The box can be removed. Please click here to view a larger version of this figure.
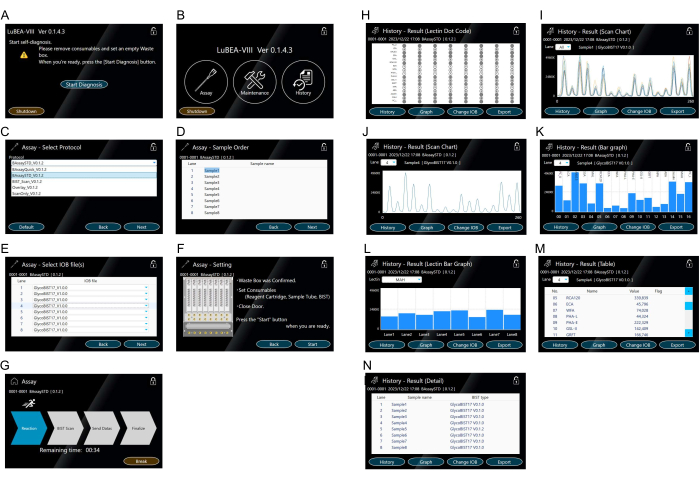
Figure 3: Touch screen for machine manipulation. (A) The self-diagnostic program starts automatically when the power is turned on. (B) The HOME screen displays "Assay," "Maintenance," and "History". (C-G) Operation of the "Assay" mode. Assay method selection (C). Multiple protocols can be registered in advance. Input of sample (analyte) order (D). Selecting the type of the tip (E). Confirmation of the assay method settings (F) and starting the assay from the "Start Assay" screen (G). (H-N) Representation of the result in "History." Lectin dotcode (H) displayed after assay completion or from "History" mode. A scan chart of 15 lectins is displayed on the screen for all samples (I) or for each sample (J). The scan chart is displayed as a bar graph (K). Bar charts for other lanes can be selected from the drop-down "Lane" list. Bar graph comparing eight lanes of samples per lectin (L). Other lectins can be selected from the dropdown "Lectin" list. Table showing quantitative values (M). Record of the executed measurement method (N). Please click here to view a larger version of this figure.
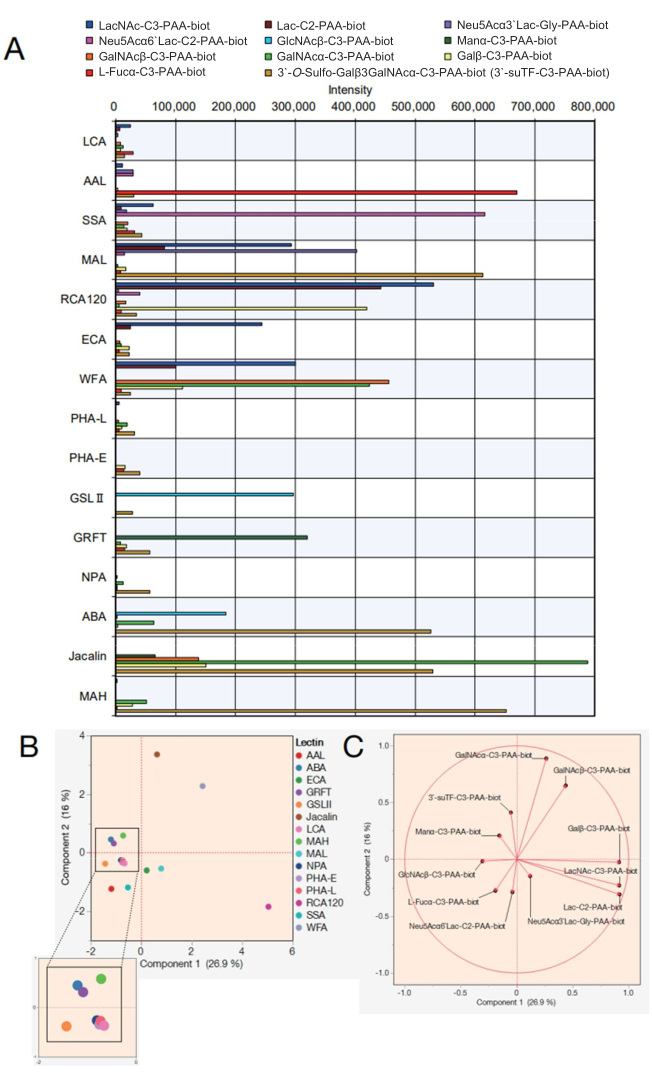
Figure 4: Evaluation of reactivity with PAA saccharides in the automatic glycan profiling system. (A) A graph depicting the reactivity of lectins with various PAA saccharides was adjusted for negative control values. (B) Principal component analysis based on the data in (A). (C) Eigenvectors from the analysis in (B). Compatible analysis software was used for parts (B) and (C). Please click here to view a larger version of this figure.
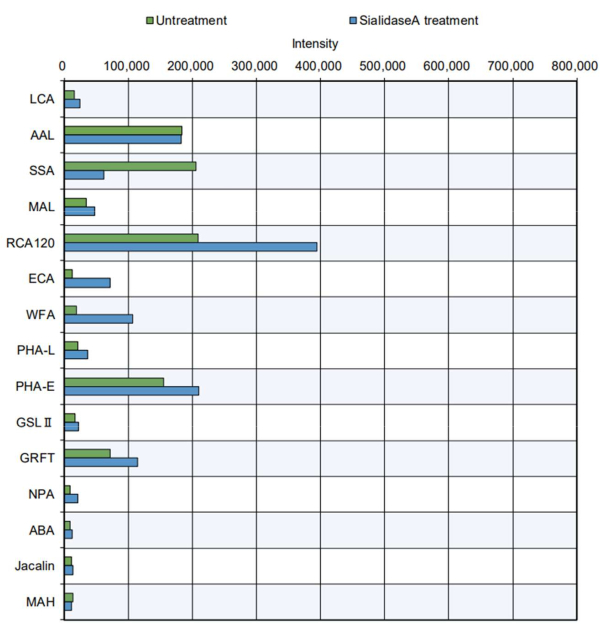
Figure 5: Verification of GlycoBIST reactivity using purified bovine thyroglobulin protein. Sample preparation without treatment was conducted under the same digestion conditions as the buffer alone, excluding the addition of sialidase A. Please click here to view a larger version of this figure.
Table 1: Repeatability test with lectin-fixed beads. The repeatability of reactivity for 28 lectins was evaluated. Analytes were reacted with each tip. EPO: erythropoietin, PSA: prostate-specific antigen, Tf: transferrin, M2BP: Mac-2 binding protein, hIgG: human IgG, MMP3: matrix metalloproteinase 3, (Sia+): sialidase A-digested analytes, (Sia+, Gal+): sialidase A and galactosidase-digested analytes, Ab: antibody. DSA: Datura stramonium agglutinin, HypninA2: Hypnea japonica agglutinin, WGA: wheat germ agglutinin, UDA: Urtica dioica agglutinin, BPL: Bauhinia purpurea lectin, Orysata: Oryza sativa lectin, LSL-N: Laetiporus sulphureus lectin N-terminal domain, SNA: Sambucus nigra lectin, BanLec: banana lectin, MPA: Maclura pomifera agglutinin, TxLC-I: Tulipa gesneriana agglutinin, AOL: Aspergillus oryzae lectin, ACG: Agrocybe cylindracea galectin. CV: coefficient of variation. Please click here to download this Table.
Table 2: List of lectins constituting the standard tipfor automatic glycan profiling. Please click here to download this Table.
Table 3: PAA saccharides used as standards for automatic glycan profiling system. Please click here to download this Table.
Table 4: Results of the within-run reproducibility test. CV: coefficient of variation. Please click here to download this Table.
Table 5: Results of the between-day reproducibility test. CV: coefficient of variation. Please click here to download this Table.
Table 6: Results of the long-term stability test. CV: coefficient of variation. Please click here to download this Table.
Discussion
In this study, a rapid evaluation technique for glycosylation employing "bead array in a single tip" technology has been developed. The present study introduced a standard GlycoBIST tip, designed for both glycoscience and non-glycoscience researchers, to facilitate routine, comprehensive glycosylation evaluation. The lectin microarray, typically employing 20-100 lectins12,13, has been extensively utilized in evaluations. However, considering the overlapping specificities of some lectins on the microarray and the relatively limited variety of glycoforms on a target glycoprotein compared to glycomics of crude clinical samples, it was anticipated that 15 lectins would suffice for simplified evaluation of focused glycan profiling.
The critical step in the protocol is to allow the lectin-immobilized beads or tips filled with those beads to return to room temperature after storage before using them for measurements. In particular, it was observed that condensation weakens the signals; therefore, it is advised to never open the storage bag until it returns to room temperature. For the storage of biotinylation reagents, it is also essential to completely dry before storage. An insufficient drying process decreases the efficiency of biotinylation to protein owing to the hydrolysis of the biotinylation reagent14.
Regarding modifications and troubleshooting, a method was explored to reduce variability, especially pertaining to the measurement method in the automated reaction measurement device. In particular, when the volume of buffer in the reservoir used for analysis is 150 µL, bubbles enter the tip, leading to reduced reaction efficiency and resulting in a large variation in values. Therefore, it is recommended that at least 200 µL of buffer be placed in the reservoir.
The amount of liquid that fills the tips during auto-pipetting is also an important factor. The tips cannot completely expel the liquid as it moves to the next reaction step. Therefore, in no small amount, the buffer from the previous step is carried over into the next step, and the previous buffer remains at the top area of the inserted solution when the new buffer is aspirated. Therefore, the substrate and other solutions should be sufficiently aspirated to fill the top reservoir (see Figure 1A). Given the irreversibility of antibody reactions on the instrument, it is crucial to exercise caution and avoid errors during the initial setup.
One limitation of the method is that it is restricted to soluble proteins derived from serum and culture supernatants. In the current method, lectin is not covalently crosslinked to the bead, rendering it unable to analyze samples containing high concentrations of surfactants, such as cell and tissue extracts. Consequently, future improvements are necessary to address these limitations.
The significance of the lectin bead array lies in the interchangeability and expandability of the lectin species fixed on the beads. For example, in large-scale differential analysis (>1,000 samples) using the automated glycan profiling system, users can tailor a 15-lectin lineup in the tip based on preliminary lectin microarray-based glycan profiling of the target glycoprotein (<100 samples). Moreover, the high stability of the lectin-fixed beads enables immediate experimentation from the initial tip design to measurement with routine procedures. Not only the 25 of 28 lectins that have demonstrated high reliability (Table 1), but any lectins of interest to the user can be used to create a custom automated glycan profiling system for their specific experiments, following the aforementioned routine reliability test. This approach led to the design of a possible 120-lectin bead array of eight different types of tips for expanded measurement in conjunction with the standard glycan profiling system.
A previous study focused on establishing a detection procedure for Cy3-labeled glycoproteins in line with the lectin microarray15. This method was limited to 13 lectins in parallel in the tip because of fluorescence interference. The current method, using HRP detection labels, accommodates 15 lectin-fixed beads and two control beads (positive and negative) in a tip. In addition, the biotinylation of samples has shortened the analysis process.
This analytical method can be applied not only to academic research, but also to medical and pharmaceutical research, food, cosmetics, and other industrial fields. While lectin microarray and glycoproteomics technologies are well-established, the approach of this study remains significant for its full automation and capability for rapid analysis with fewer steps. In the future, enhancements to this analysis will be made to a quantitative method by normalizing the signal using certain glycoproteins, employing antibody-fixed beads alongside lectin-fixed beads in a tip.
Disclosures
AO, TO, NT, HS, KK, MA, SY, TM, KN, OS, and KS are employees of Precision System Science Co., Ltd.
Acknowledgements
This work was supported by the Adaptable and Seamless Technology transfer Program through Target-driven R&D (A-STEP), funded by the Japan Science and Technology Agency (JST), under Grant Number JPMJTR204A and in part by the Japan Society for the Promotion of Science (JSPS) KAKENHI Grant Number 23H02680 to AK.We would like to thank Editage (www.editage.jp) for editing the English language.
Materials
| Name | Company | Catalog Number | Comments |
|---|---|---|---|
| 0.2 mL 8 PCR tubes + flat cap | FastGene | FG-0028FC/SE | For dispensing and storage of biotin labeling reagents |
| 2.0 mL SC Micro Tube protein LB | SARSTEDT AG&Co. KG | 72.694.600 | For loading samples in LuBEA-VIII |
| Analysis software | SAS Institute Inc. | JMP 17 | |
| Anti-Static Ionizer. 110 volts | Plas-Labs | 800-AS/SPI | Use while inserting beads into BIST Tip. |
| Antistatic tweezers NK2A | RUBIS | 9-5681-01 | Use while inserting beads into BIST Tip. |
| Automated reaction measurement device | Precision System Science Co., Ltd. | LuBEA | All data in this study were obtained using LuBEA-VIII. While LuBEA is commercialized, LuBEA-VIII is currently in the development phase. The website for product details of LuBEA and LuBEA-VIII can be found at the following URL (https://www.pss.co.jp/english/technology/apit/bist02.html). |
| Biotin-(AC5)2 Sulfo-Osu | Dojindo | 341-06801 | As biotinilation reagent |
| BIST spacer bead- V-11 | Precision System Science Co., Ltd. | F4938000 | Diameter: 1 mm |
| BIST tip and sheath | Precision System Science Co., Ltd. | F4930-000 | Fill this empty tip with beads. |
| Calcium chloride | Wako | 039-00475 | For preparing buffer solutions |
| Can Get Signal Solution 2 | TOYOBO | NKB-301 | This blocking reagent is good for this method |
| CentriVap Benchtop Vacuum Concentrators | Labconco | 7810010 | For dry of biotinilation reagent. The substitution provided by other companies is possible. |
| Clarity Western ECL Substrate | Bio-Rad | 1705060 | For measuring the samples by LuVEA VIII |
| Cold trap CentriVap series | Labconco | 7460040 | For dry of biotinilation reagent. The substitution provided by other companies is possible. |
| Glycine | Wako | 077-00735 | For preparing buffer solutions |
| Manganese(II) Chloride Tetrahydrate | Wako | 139-00722 | For preparing buffer solutions |
| Milli-Q reference | MERCK | ZIQ7000T0C | As deionazed water for dilution of reagents and buffers |
| PBS | Wako | 162-19321 | For preparing buffer solutions |
| Peroxidase Streptavidin | Jackson | 016-030-084 | This antibody is good for GlycoBIST analysis. It is useful for the detection of the western blotting, although substitutions can be provided by other companies. |
| Probe bead | Precision System Science Co., Ltd. | FP4936000 | For preparing lectin-fixed beads. See Shimazaki, H. et al., Current Protocols in Protein Science, 2020 in reference section for detail. |
| Protein LoBind Tubes 1.5 mL | Eppendorf | 0030108442 | Use while preparing the samples such as biotinylation. |
| Silica gel (for desiccan) | Kanto chemical | 37039-02 | Use while storing the GlycoBIST tip and dried biotinylation reagent. |
| Static electricity removal sheet M | TRUSCO NAKAYAMA | SD5050 | Use while inserting beads into BIST Tip. |
| SV Cartridge II | Daido Chemical Industry | ED041 | For measuring the samples by LuVEA VIII |
| Table Microcentrifuge-CAPSULEFUGE | TOMY | PMC-060 | For spin-down of the mixture in each process |
| Triton X-100 | Nacalai tesque | 35501-15 | For preparing buffer solutions |
References
- Butler, M., Reichl, U. Animal cell expression systems. Adv Biochem Eng Biotechnol. 175, 1-36 (2021).
- Silva, M. L. S. Chapter One - Lectin biosensors in cancer glycan biomarker detection. Adv Clin Chem. 93, 1-61 (2019).
- Hiono, T., Nagai-Okatani, C., Kuno, A. 4.07 - Application of glycan-related microarrays. Comprehensive Glycoscience (Second Edition). , 134-148 (2021).
- Shimazaki, H., et al. Lectin bead array in a single tip facilitates fully automatic glycoprotein profiling). Anal Chem. 91 (17), 11162-11169 (2019).
- Shimazaki, H., et al. GlycoBIST: A System for automatic glycan profiling of a target protein using milli-bead array in a tip. Curr Protoc Protein Sci. 99 (1), e103(2020).
- Mahmood, T., Yang, P. C. Western blot: Technique, theory, and trouble shooting. N Am J Med Sci. 4 (9), 429-434 (2012).
- Bojar, D., et al. A useful guide to lectin binding: machine-learning directed annotation of 57 unique lectin specificities. ACS Chem Biol. 17 (11), 2993-3012 (2022).
- Nagai-Okatani, C., et al. 2.0: An integrated visualization for lectin microarray-based mouse tissue glycome mapping data with lectin histochemistry. J Proteome Res. 20 (4), 2069-2075 (2021).
- Geisler, C., Jarvis, D. L. Effective glycoanalysis with Maackia amurensis lectins requires a clear understanding of their binding specificities. Glycobiology. 21 (8), 988-993 (2011).
- Noro, E., et al. N -glycan structures of Wisteria floribunda agglutinin-positive Mac2 binding protein in the serum of patients with liver fibrosis. Glycobiology. 31 (10), 1268-1278 (2021).
- Rawitch, A. B., Pollock, H. G., Yang, S. X. Thyroglobulin glycosylation: Location and nature of the N-Linked oligosaccharide units in bovine thyroglobulin. Arch Biochem Biophys. 300 (1), 271-279 (1993).
- Dang, K., Zhang, W., Jiang, S., Lin, X., Qian, A. Application of lectin microarrays for biomarker discovery. Chemistry Open. 9 (3), 285-300 (2020).
- Chen, S., Qin, R., Mahal, L. K. Sweet systems: Technologies for glycomic analysis and their integration into systems biology. Crit Rev Biochem Mol Biol. 56 (3), 301-320 (2021).
- Dwivedi-Agnihotri, H., Srivastava, A., Shukla, A. K. Reversible biotinylation of purified proteins for measuring protein-protein interactions. Methods Enzymol. 633, 281-294 (2020).
- Shimazaki, H., et al. Auto-lectin dotcoding by two octopuses: Rapid analysis of fluorescence-labeled glycoproteins by an 8-channel fully-automatic bead array scanner with a rolling-circle detector. Anal Chem. 95 (32), 11868-11873 (2023).
Reprints and Permissions
