Whole blood-based immunoassays provide a facile and resource-efficient tool to analyze antigen-specific immunity for diagnostic and research purposes. This article provides an optimized whole blood-based protocol with dual co-stimulation for comprehensive analysis of host immunity to fungal and viral pathogens, including a low-volume version for pediatric patients and small animals.
Method Article
Whole Blood Assay with Dual Co-Stimulation for Antigen-Specific Analysis of Host Immunity to Fungal and Viral Pathogens
* These authors contributed equally
In This Article
Summary
Abstract
Rapid and resource-efficient sample processing, high throughput, and high robustness are critical for effective scientific and clinical application of advanced antigen-specific immunoassays. Traditionally, such immunoassays, especially antigen-specific T-cell analysis by flow cytometry or enzyme-linked immunosorbent spot assays, often rely on the isolation of peripheral blood mononuclear cells. This process is time-consuming, subject to many pre-analytic confounders, and requires large blood volumes. Whole blood-based assays provide a facile alternative with increased pre-analytic robustness and lower blood volume requirements. Furthermore, whole blood-based assays allow for the preservation of inter-cellular interactions that are not captured by assays using isolated cell subsets. Recently, a refined whole blood immunoassay with dual anti-CD28 and anti-CD49d co-stimulation for comprehensive analysis of both antigen-specific T-cell functions and complex intercellular interactions in response to various fungal and viral antigens has been proposed. This protocol provides guidance for the preparation of stimulation tubes, blood stimulation, and downstream sample processing for flow cytometry, cytokine secretion assays, and transcriptional analyses. This includes a validated and functionally equivalent, previously unpublished, low-volume protocol (250 µL) to make flow cytometric and cytokine-based T-cell monitoring more accessible for studies in pediatric patients or preclinical studies in small animals (e.g., mice). Altogether, these protocols provide a versatile toolbox for complex antigen-specific immune analysis in both clinical and translational research settings.
Introduction
Quantification and characterization of antigen-specific immunity, especially specific T-cell responses, is pivotal for immunobiology and vaccination research, as well as some diagnostic tests. Traditionally, antigen-specific immunoassays commonly relied on isolated peripheral blood mononuclear cells (PBMCs). However, isolation of these cells is time-consuming and resource-intensive and often requires relatively large blood volumes. Additionally, to prevent granulocyte activation and subsequent T-cell disturbance during pre-analytic storage1 rapid processing of the samples is paramount, which is often not feasible in clinical practice. These limitations hamper the practicability of antigen-specific immunoassays in high-throughput research scenarios and clinical routines. Therefore, the development of easy-to-use and potentially automatable whole blood-based approaches in recent years has opened new areas of immunoassay applications. However, current commercially available systems usually lack optimal co-stimulatory environments for T-cells and are susceptible to pre-analytic delays. For instance, a widely used whole blood-based IFN-γ release assay has a 19% positive to negative reversion rate after 6 h of pre-analytic blood storage2. Optimized protocols with dual anti-CD28 and anti-CD49d co-stimulation have been developed to overcome these limitations3,4,5,6.
The protocol presented here allows for accurate and reproducible quantification and characterization of antigen-specific T-cells, assessment of antigen-induced cytokine responses, and other (flow cytometric or transcriptional) functional immune markers from minimal blood volume, i.e., 500 µL of blood per stimulation tube. Further advantages of this protocol include low hands-on time, high resilience to pre-analytic confounders, and preservation of functional inter-cellular interactions in a relatively physiological ex vivo environment. The comparability of whole blood-based flow cytometric antigen-specific T-cell characterization with data generated from traditional PBMC-based assays has been previously shown in the context of mold-specific T-cell quantification6. Furthermore, direct stimulation of the subjects' blood abrogates the need for supplementation with autologous, allogenic, or even xenogeneic serum that is commonly required for optimal PBMC stimulation. Omission of cell isolation also reduces shear and temperature stress, thereby improving cell viability. Most importantly, whole blood-based assays preserve granulocyte populations that are lost during gradient centrifugation for isolation of PBMCs7. Thereby, this assay setup preserves and captures functional interaction loops between granulocytes and mononuclear cells4.
Of note, this protocol requires only minimal modifications to accommodate different readout modalities and even allows for dual analysis of cytokine release and transcriptional responses from the same stimulation tube. Specifically, while cytokines are analyzed from the culture supernatant after stimulation, the cell pellet can be used for RNA isolation with subsequent transcriptomic analysis. The general workflow for the various readout modalities is summarized in Figure 1.
In recent years, an increasing number of whole blood-based assays has been developed for pathogen-reactive immune monitoring in research and clinical settings, e.g., for Mycobacterium tuberculosis8,9, Bordetella pertussis3, Orientia tsutsugamushi10, and SARS-CoV-25,11,12. For instance, a previously established system has been used for multiple antigens, including M. tuberculosis, Influenza A virus, and SARS-CoV-2, but does not use co-stimulatory factors optimized for T-helper (Th) cell stimulation13,14,15. Even though the blood volume required for these assays is already significantly lower than that used for traditional PBMC-based assays or commercially available whole blood stimulation kits, an even smaller sample volume might be warranted for applications in pediatrics, neonatology, patients in the intensive care unit (ICU), and preclinical research in small animal models. For instance, even terminal blood sampling from mice (e.g., by cardiac puncture) commonly yields a maximum of 0.7-1 mL of blood. Thus, the possibility to further downscale previously established whole blood-based immunoassay protocols4,6 for precise quantification and characterization of antigen-reactive T-cell responses from 250 µL of blood volume per stimulation tube has been evaluated as part of this protocol.
Protocol
The ethical board of the Ludwig Maximilians University Munich (project number 21-0689) approved the collection of human blood samples. Additionally, parts of the representative datasets were generated under Corona-Register-Study number 20-426, also approved by the ethics committee of the Ludwig Maximilians University Munich. Informed consent was obtained.
1. Preparation of whole blood stimulation tubes
NOTE: This step is adapted from Lauruschkat et al.4 and Weis et al.6. Table 1 summarizes detailed reagent concentrations and volumes.
- Under sterile conditions (sterile workbench), prepare 2.7 mL blood collection tubes without anti-coagulant, with antigens and co-stimulatory antibodies. Add 1 µg/mL of α-CD28 and 1 µg/mL of α-CD49d to each tube, including the negative control. Consider the blood volume to be added for whole blood stimulation when determining final concentrations (250 µL or 500 µL). To maintain chamber geometry and sample accessibility, do not retract the plunger from the blood collection tube.
- Based on the study design, determine whether the negative control tubes should either contain no additional stimulus (unstimulated background control, as shown in Table 1) or use antigens to which the study cohort should harbor no or minimal antigen-specific T-cells (e.g., an HIV peptide pool in HIV-seronegative individuals 16).
- For antigen-specific stimulation, optimize the ideal concentrations of antigens by titration in preliminary experiments. To generate the representative data below, use the following optimized antigen concentrations: 1.2 µg/mL HSV-1 lysate, 0.6 nM/peptide/mL CMV pp65, 0.6 nM/Peptide/mL SARS-CoV-2 Prot_S, 50 µg/mL Aspergillus fumigatus lysate, and 1 ng/mL CRX-527.
- Include a positive control, especially for studies in lymphopenic patients or those receiving immunosuppressive pharmacotherapy. Use CPI positive control solution (0.6 nM/peptide/mL), consisting of cytomegalovirus, parainfluenza virus, and influenza virus peptides.
NOTE: Alternatively, synthetic stimuli, such as PMA (10 µg/mL) ± ionomycin (1 µg/mL), can be used, but they induce less physiologic reactions and can affect the expression of surface antigens commonly used as population markers for flow cytometry (most notably, CD417). Note that co-stimulatory antibodies are not needed in conjunction with most synthetic positive control stimuli and might even negatively impact cell viability and responsiveness. - To harmonize reagent volumes across all stimulation tubes, add RPMI 1640 medium up to the following total volumes: Full-scale assay for flow cytometry: 50 µL; Full-scale assay for cytokine analysis and transcriptomics: 500 µL; Small-scale assay for flow cytometry: 25 µL; Small-scale assay for cytokine analysis and transcriptomics: 250 µL.
NOTE: For the preparation of multiple sets of stimulation tubes, it is recommended to prepare master mixes including all ingredients because of the lower risk of contamination and the low volume of co-stimulatory factors and stimuli. - Use the prepared tubes immediately or cryopreserve them at -20 °C. Most reagents can be stored for up to 4 weeks; however, pre-validate maximum storage periods for new reagents/stimuli.
2. Stimulation and incubation of whole blood samples
- About 30-60 min prior to whole blood stimulation, thaw the ready-to-use stimulation tubes and keep them at room temperature.
- Collect venous blood from the donor/patient using blood collection tubes with lithium heparin anticoagulant. Ensure that the collected blood volume meets individual experiment requirements, i.e., a minimum of 750 µL is required for 3 conditions of the small-scale assay, including negative and positive control. For the commercially acquired blood collection tubes, fill them completely to achieve heparin working concentrations of 16 - 25 IU/mL blood.
NOTE: Demographic data of the healthy adult subjects recruited to generate the representative datasets is shown in Table 2. - Transfer the required amount of heparinized whole blood (250 µL or 500 µL for small- or full-scale assay, respectively) into the stimulation tubes by pipetting under a sterile workbench.
NOTE: If a sterile workbench is unavailable or when working with samples exhibiting minimal risk of infection (i.e., blood of pre-screened human subjects or animals), samples can be transferred into the stimulation tubes using sterile syringes. This method also enables sample processing at the bedside immediately after blood collection, which minimizes pre-analytical storage and T-cell impairment. Before injecting the blood, extensively disinfect the rubber seals of both the blood collection tube and all stimulation tubes with an alcoholic disinfectant. Let the disinfectant dry for at least 1 min. - Carefully invert the stimulation tubes 5x-10x. Place stimulation tubes in a 37 °C incubator. Note that a CO2 incubator is not required. To prevent unspecific neutrophil activation, do not refrigerate the blood collection tube.
NOTE: This protocol has been validated for pre-analytic blood storage of up to 8 h at room temperature to allow for sample transportation. If feasible, it is preferable to inject whole blood into the stimulation tubes at the site of collection and transport blood to a central laboratory in the stimulation tubes, as co-stimulatory factors will improve lymphocyte viability18,19. - Only for samples used for flow cytometric assays with intracellular staining, add brefeldin A (final concentration of 10 µg/mL) to each stimulation tube after 4 h of incubation.
- Prepare a 1 mg/mL brefeldin A solution in RPMI and add 1 µL of the solution per 100 µL sample volume (i.e., premixed stimulation cocktail + whole blood volume). Add brefeldin A by uncapping the tubes and pipetting under a sterile workbench. Recap and return tubes to the 37 °C incubator for another 16-18 h at 37 °C (20-22 h in total).
- For cytokine secretion assays or transcriptional analyses, do not add brefeldin A and continuously incubate the samples at 37 °C for 24-26 h.
NOTE: Brefeldin A inhibits the Golgi apparatus and thereby abrogates cytokine secretion and transport of proteins to the cell surface. As secretion or surface expression will ultimately result in protein loss and degradation after re-internalization, respectively, exocytosis inhibitors are essential for intracellular accumulation and staining of cytokines and some activation markers (e.g., CD154) for flow cytometry studies. However, brefeldin A also disrupts physiological cellular processes visible in the transcriptome and invalidates cytokine secretion assays from culture supernatants20,21, necessitating the use of two separate test tubes (one with and one without brefeldin A) to perform these readouts in parallel.
3. Preparation of samples for flow cytometry
- Add 500 µL of 0.5 M EDTA solution to each stimulation tube and incubate the sample for 15 min at room temperature to detach adherent cells from the tubes' surface.
- Transfer samples into new 15 mL centrifuge tubes. Rinse the stimulation tubes with 1 mL of erythrocyte lysis buffer to collect the remaining blood cells, then add the buffer and cells to the same 15 mL centrifuge tubes.
- Centrifuge the 15 mL tubes for 7 min at 600 x g. Carefully discard the supernatant.
- Resuspend the blood cell pellet in erythrocyte lysis buffer (Figure 2A). Use 5 mL of erythrocyte lysis buffer for 500 µL of whole blood and 3 mL for 250 µL whole blood.
NOTE: Optimal erythrocyte lysis conditions need to be pre-evaluated for the specific buffer used (prepared in-house or commercial product). The instructions provided here have been optimized for the erythrocyte lysis buffer listed in the table of materials. - Incubate samples at room temperature until the samples appear clear (Figure 2B). To prevent granulocyte lysis and aggregation, do not exceed 6 min of incubation. An indicator of successful erythrocyte lysis is the ability to see the numbers and scale on the 15 mL tube through the fluid (Figure 2C).
- Centrifuge the 15 mL tubes for 7 min at 600 x g. Carefully discard the supernatant, repeat steps 3.4- 3.5 if the cell pellet is still noticeably red.
- Resuspend the cell pellet in 1 mL of HBSS and transfer the cells into 2 mL reaction tubes.
- Centrifuge the 2 mL tubes for 5 min at 400 x g. Carefully discard the supernatant.
- Perform flow cytometric staining according to the manufacturer's instructions for the intracellular staining kit and antibodies used.
NOTE: The antibody panel used to generate the representative dataset is summarized in Table 3.
4. Preparation of samples for cytokine assays
- After step 2.6, transfer the diluted blood from the stimulation tubes into 1.5 mL tubes.
- Centrifuge the 1.5 mL tubes for 20 min at 2000 x g. Carefully pipette the supernatant into a fresh 1.5 mL tube and use it either immediately for cytokine analysis or cryopreserve the supernatants at -80 °C.
- Centrifuge the supernatant again for 5 min at ≥ 7000 x g (in 1.5 mL tubes) to remove residual cell debris before analysis, especially after thawing. Depending on the cytokine assay protocol, perform pre-dilution of the samples.
- Resuspend the cell pellet in 1 mL of RNA protection buffer and cryopreserve it at -80 °C for subsequent RNA isolation. Alternatively, resuspend the cell pellet in lysis buffer for immediate RNA isolation according to the instructions for the RNA isolation kit (or in-house protocol).
NOTE: If necessary, depending on the subsequent RNA processing protocol, an erythrocyte lysis step similar to 3.4-3.5 can be added before adding the RNA protection buffer.
Results
Multimodal analysis of antigen-specific immune responses after whole blood stimulation with pathogen-associated antigens
To generate a representative dataset, a healthy adult donor seropositive for HSV-1 and CMV who had received SARS-CoV-2 vaccinations was selected. In addition to an unstimulated control, the following stimuli have been used as described above: Herpes simplex virus 1 (HSV) lysate (manufacturer's recommendation, unpublished data), cytomegalovirus (CMV) pp6522, severe acute respiratory syndrome coronavirus 2 (SARS-CoV-2) Prot_S5,23, Aspergillus fumigatus lysate (a ubiquitous environmental pathogen)4,24, CRX-527 (a Toll-like Receptor 4 stimulus based on lipopolysaccharide, which should not activate T cells in itself)25, and CPI (positive control for CD4+ T-cell activation consisting of CMV, parainfluenza virus, and influenza virus peptides)26. The flow cytometric data and gating strategy are shown in Figure 3. Generally, it is advised to measure as many lymphocytes as feasible when targeting rare cell populations (50,000 - 100,000 lymphocytes), as precision and reliability of measurements depend on the total number of events27. The unstimulated sample is used for gating of individual cell subsets (e.g., CD3+CD4+ cells). The gates for CD45RO and CCR7 for memory T-cell phenotyping should be set on the total CD3+CD4+ population and then transferred to the activation marker-positive populations, as the low event numbers on the latter often prevent clear identification of distinct populations. Slight adjustments might be necessary for individual gates, e.g., to account for differences in lymphocyte viability. Upregulation of CD154 (or CD40 ligand) has been described as a global, consistent, and rapidly induced T-helper cell activation marker28,29. IFN-γ is considered one of the most prominent and type-1-specific T-cell activation markers30,31. Importantly, this assay has been tested and published with various additional activation, exhaustion, and cytokine markers (see Table 4 and24).
Frequencies of activation marker-positive populations in the unstimulated sample represent unspecific backgrounds and were subtracted from antigen-stimulated frequencies. After subtraction of unspecific background, the representative donor had 0.75% (HSV), 0.09% (CMV), 0.06% (SARS-CoV-2), 0.34% (A. fumigatus), 0.00% (CRX-527), and 1.21% (CPI) specific CD154+/CD3+CD4+ T-helper cells, respectively. IFN-γ expression can be analyzed similarly, resulting in 0.12% (HSV), 0.07% (CMV), 0.03% (SARS-CoV-2), 0.04% (A. fumigatus), 0% (CRX-527), and 0.74% (CPI) IFN-γ+/CD3+CD4+ cells.
T-cell populations can be further subdivided into naïve T-cells (TN, CD45RO-CCR7+), central memory T-cells (TCM, CD45RO+CCR7+), effector memory T-cells (TEM, CD45RO+CCR7-), and effector T-cells (and effector memory T-cells re-expressing CD45RA, TE/TEMRA, CD45RO-CCR7-). Among global CD3+CD4+ T-cells, the representative donor had 38.34% TN, 38.33% TCM, 20.77% TEM, and 2.56% TE/TEMRA, respectively, as determined using the unstimulated sample (Figure 3A). However, among antigen-specific reactive T-helper cells (CD154+IFN-γ+), TCM and TEM were by far the most prominent subsets, with means of 22.14% and 73.97%, respectively.
Data on additional leukocyte populations has been previously published using this methodology24. The antibody combinations used are presented in Table 4 for further reference.
Furthermore, to show the full potential of this methodology, an IFN-γ ELISA has been performed on a second set of stimulated samples (without the addition of brefeldin A). To prevent exceedance of the IFN-γ ELISA kit's detection range, plasma from CPI-stimulated samples was pre-diluted 1:4. The following IFN-γ concentrations were measured and normalized per mL of the subject's blood volume, i.e., corrected for dilution in both the stimulation tubes and pre-ELISA dilutions: 0 pg/mL (unstimulated), 69.4 pg/mL (HSV), 471 pg/mL (CMV), 17.8 pg/mL (SARS-CoV-2), 61.9 pg/mL (A. fumigatus), 34.0 pg/mL (CRX-527), and 1958 pg/mL (CPI).
Lastly, RNA was isolated from the same samples with consistent results. The mean yield was 719 ng, with a mean absorbance ratio of 260nm/280nm being 1.98.
Altogether, this data set illustrates that the presented protocol allows for a multifaceted readout spectrum and concomitant analysis of various infection-associated antigens using minimal blood volume, i.e., 8 mL in total for multiple stimuli and readout modalities.
Representative dataset for transcriptional analyses to track vaccination response using antigen-stimulated whole blood
As a proof-of-principle for transcriptional studies performed on antigen-stimulated whole blood, blood was collected from 9 healthy adult subjects immediately before and 1 month after the first booster vaccination with BNT162b2 (SARS-CoV-2 mRNA vaccine)32,33 7-9 months following the initial two-dose vaccine series. The average RNA yield from 500 µL of unstimulated and Prot_S-stimulated whole blood was 1.1 µg of highly pure RNA, with a mean 260/280 absorption ratio of 1.99. Following nCounter analysis, RNA counts were normalized to the panel's 12 housekeeping genes (geometric mean). Thereafter, the ratio of normalized mRNA counts in Prot_S-stimulated samples versus unstimulated background controls was determined for each subject and gene. Median-to-median ratios of post-versus pre-vaccination measurements were determined, and pathway enrichment analysis was performed using the software package listed in the Table of Materials. Enrichment of canonical pathways was considered significant at an absolute z-score value ≥ 1.25 and a Benjamini-Hochberg adjusted p-value < 0.05. Significantly differently enriched pathways are summarized in Figure 4A, and a simplified network of background-adjusted changes in post- versus pre-vaccination response to Prot_S is shown in Figure 4B. Additionally, stronger background-adjusted induction of representative genes related to antigen-presenting cell maturation and Prot_S-induced T-cell activation after booster vaccination is shown in (p < 0.01-0.03) Figure 4C. Lastly, an increase in background-adjusted Prot_S-specific type 1 T-helper cells (CD69+IFN-γ+) after vaccination in most donors was confirmed by flow cytometry using a second set of stimulation tubes (p = 0.03, Figure 4D).
Comparison of virus-reactive T-cell responses in full-scale and small-volume whole blood-based immunoassay protocols
Next, frequencies of virus-reactive CD154+IFN-γ+ T-helper cells (CD3+CD4+ cells) in healthy volunteers were compared using the full-scale (500 µL, WB) and small-volume (250 µL, WBS) whole blood antigen stimulation protocols (Figure 5). As previously reported34, minimal unspecific background frequencies of CD154+IFN-γ+ cells were seen with either protocol despite dual co-stimulation (means, 0.010% and 0.011% for WB and WBS, respectively). Of note, although unspecific background responses are subtracted from antigen-specific responses, they still contribute to increased assay imprecision, as discussed previously27. Elevated background signals (i.e., >0.07-0.1% CD154+ Th cells or >0.05% CD154+IFN-γ+ cells) could indicate sample contamination, an acute infection of the subject, or could be the result of inappropriate pre-analytic sample handling.
Mean HSV lysate-reactive T-cell frequencies in seropositive donors (n = 5) were 0.151% and 0.107% in WB and WBS systems, respectively, compared to 0.012% and 0.004% in seronegative donors (n = 4). With the CMV pp65 peptide pool, seropositive donors (n = 4) had 0.041% and 0.049% reactive T-cells compared to 0.001% and 0.004% in seronegative donors (n = 5). Lin's concordance correlation coefficients were 0.868 for HSV and 0.985 for CMV, suggesting a strong correlation (Figure 5A). Notably, CMV-specific T-cell testing can be negative in healthy seropositive subjects who had no recent reactivation events. Both the total and the antigen-reactive CD3+CD4+ T-helper cell repertoires were further differentiated based on CCR7 and CD45RO expression (Figure 5B). Reassuringly, the results obtained using the WB and WBS protocols were comparable for both total and antigen-reactive populations. Expectedly, with both assays, the proportion of more differentiated memory Th cells (i.e., effector memory cells) was higher among the antigen-reactive T-cells than among the total Th-cell population. As expected, only a few naïve T-cells were activated by viral stimulants (Figure 5B).
Moreover, in another set of experiments, stimulated culture supernatants were analyzed by IFN-γ ELISA (Figure 5C). A minimal unspecific background was seen (means of 1.29 pg/mL and 2.18 pg/mL in WB and WBS protocols, respectively). Blood samples from HSV-seropositive donors showed mean background-adjusted HSV-induced IFN-γ concentrations of 111 pg/mL and 125 pg/mL in the WB and WBS system, respectively. In contrast, IFN-γ concentrations in seronegative samples were consistently below 10 pg/mL in both systems (Lin's concordance correlation coefficient = 0.972, Figure 5C). Likewise, pp65-stimulation of blood from CMV seropositive donors yielded mean IFN-γ concentrations of 258 pg/mL and 272 pg/mL in WB and WBS systems, respectively, whereas minimal pp65-induced IFN-γ secretion was seen in both systems using seronegative samples (Lin's concordance correlation coefficient = 0.953, Figure 5C).
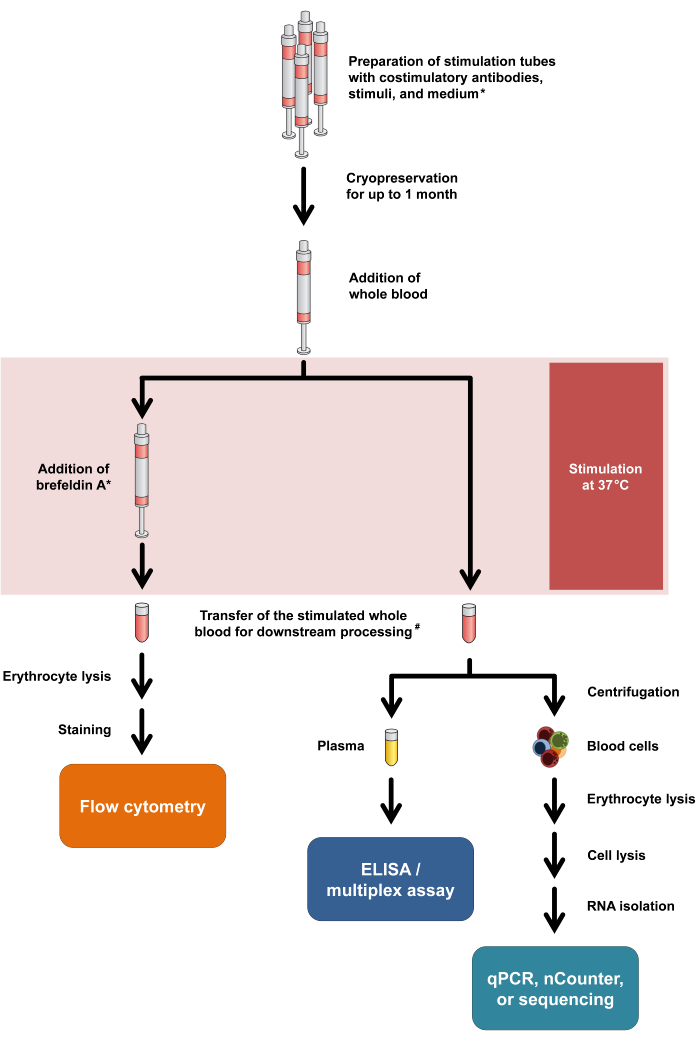
Figure 1: Flow chart summarizing experimental procedures and readouts. Asterisk means Brefeldin A is required for some T-cell activation markers (e.g., CD154) and intracellular cytokine staining. See protocol steps 2.5 and 2.6. #: Blood for flow cytometry is initially transferred to 15 mL centrifuge tubes for erythrocyte lysis, whereas blood for cytokine assays and transcriptomics is transferred to 1.5 mL microcentrifuge tubes. Please click here to view a larger version of this figure.
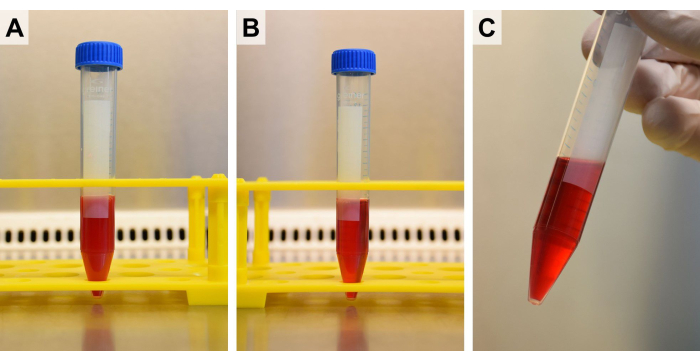
Figure 2: Erythrocyte lysis. After stimulated blood has been resuspended in (A) erythrocyte lysis buffer, it is incubated until (B) the fluid appears clear, but no longer than for 6 min. (C) When using a graded 15 mL tube, its scale should become visible through the increasingly translucent sample. Please click here to view a larger version of this figure.
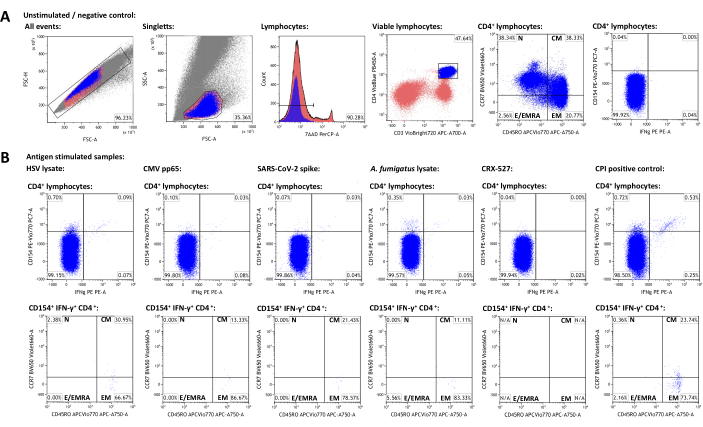
Figure 3: Representative dataset and flow cytometric gating schematics. (A) Singlet events are identified by FSC-A and FSC-H properties. Of those, lymphocytes are gated using FSC-A and SSC-A. Lymphocytes are differentiated into CD3+CD4+ T-helper cells. CD45RO and CCR7 expression levels are used for phenotyping of memory and effector cell populations. IFN-γ and CD154 were used as activation markers. Gates were set based on the IFN-γ-CD154- population in the unstimulated sample. Gates were subsequently transferred to the stimulated samples (B). Characterization of memory populations of the activated T-cells was achieved by transferring the CCR7/CD45RO quadrant gate from the CD3+CD4+ population to the IFN-γ+CD154+CD3+CD4+ populations. Please click here to view a larger version of this figure.
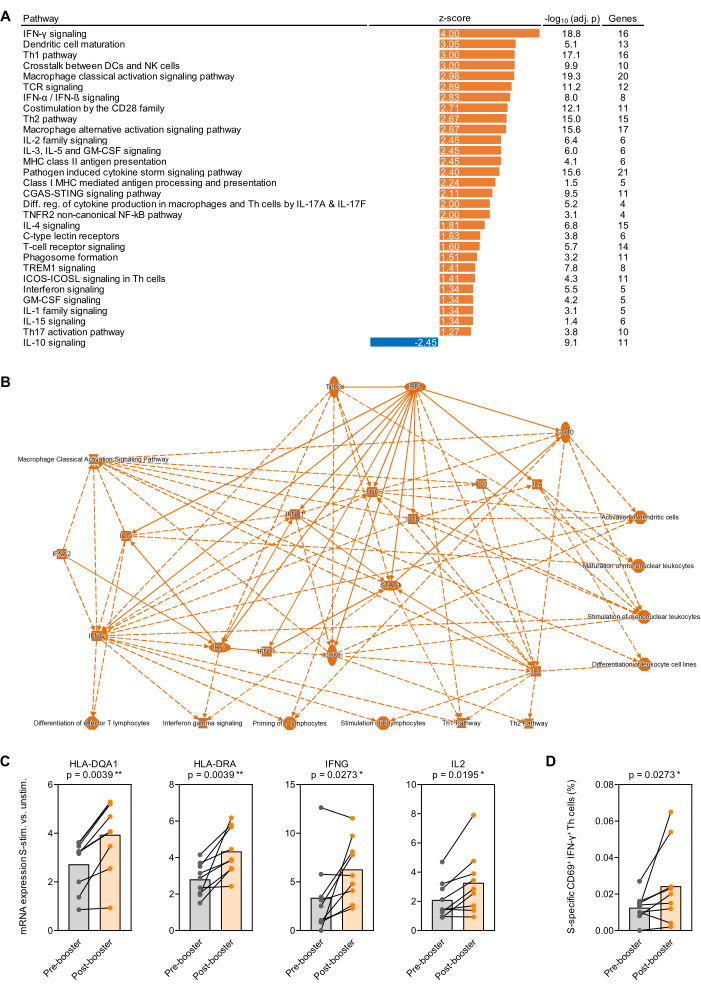
Figure 4: Antigen-induced transcriptional changes after SARS-CoV-2 booster vaccination. (A) Background-adjusted enrichment of transcriptional pathways in SARS-CoV-2 spike protein (Prot_S)-stimulated whole blood after versus before (first) BNT162b2 mRNA booster vaccination was analyzed in 9 healthy adult subjects. Immune-related canonical pathways with a Benjamini-Hochberg-adjusted (BH-adj.) p-value <0.05 (-log10[BH-adj. p] >1.3) and an absolute z-score >1.25 are shown. (B) Simplified network summarizing genes and pathways more strongly enriched in S-stimulated whole blood after versus before booster vaccination. (C) Background-adjusted expression levels of representative genes associated with antigen presentation and T-cell activation in Prot_S-stimulated whole blood before and after booster vaccination. Paired Wilcoxon test. (D) Background-corrected frequencies of Prot_S-specific IFN-γ+CD69+ T-cells before and after booster vaccination. Paired Wilcoxon test. Please click here to view a larger version of this figure.
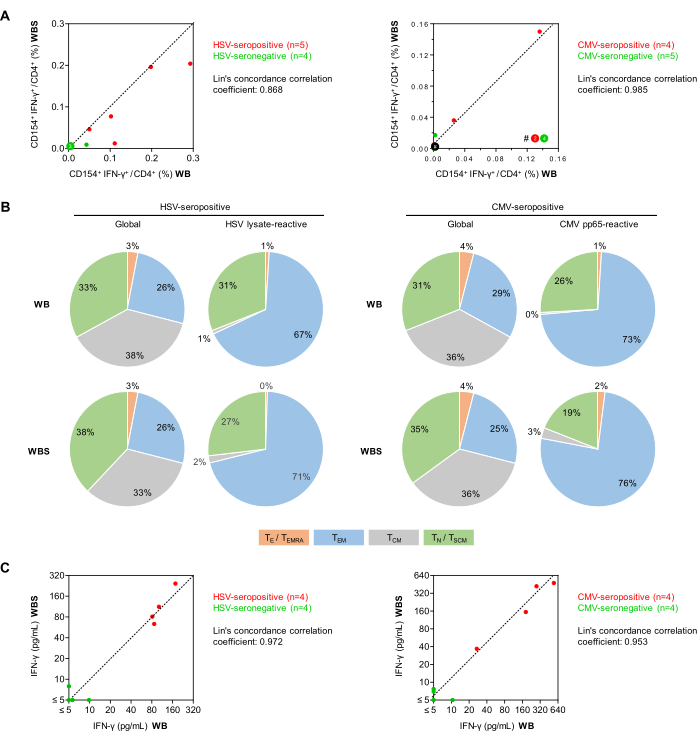
Figure 5: Antiviral T-cell reactivity in flow cytometry and ELISA. (A) Correlation plots of background-corrected CD154+IFN-γ+/CD3+CD4+ T-cell frequencies (flow cytometry) from the established (WB) and small-volume (WBS) whole blood assays are shown. Green and red dots represent subjects who are seronegative and seropositive for the tested virus, respectively. (B) Using flow cytometric assessment of CD45RO and CCR7 expression, memory/effector T-cell phenotypes were determined among global CD3+CD4+ T-cells and antigen-reactive IFN-γ+CD154+CD3+CD4+ T-cells after stimulation with HSV lysate or CMV pp65 using blood from seropositive donors (n = 5 and 4, respectively). Mean distributions are shown. Green: naïve T-cells (TN), CD45RO-CCR7+. Grey: central memory T-cells (TCM), CD45RO+CCR7+. Blue: effector memory T-cells (TEM), CD45RO+CCR7-. Orange: effector T-cells and effector memory T-cells re-expressing CD45RA (TE/TEMRA), CD45RO-CCR7-. (C) Correlation plots of background corrected IFN-γ release (ELISA) measured using the WB and WBS assays. Please click here to view a larger version of this figure.
Table 1: Stimulus tube contents. Stock concentrations of stimuli and solvents are summarized. The full-scale whole blood assay (WB) is performed using 500 µL of lithium heparinized whole blood, whereas the small-scale version (WBS) requires only 250 µL of blood. For WBS, all reagent volumes are half of WB volumes. Please click here to download this Table.
Table 2: Demographic data of healthy adult subjects sampled to generate the representative datasets. Please click here to download this Table.
Table 3: Representative flow cytometric panel for T-cell analysis. This flow cytometric panel has been used to generate the representative dataset. Results are shown in detail in Figure 3. Please click here to download this Table.
Table 4: Previously published flow cytometric panels. Data using these antibody combinations has been previously published by Tappe et al.24. Please click here to download this Table.
Discussion
Antigen-specific immunoassays provide insights into host-microbe interactions, are pivotal for vaccination and immunotherapy research, and are increasingly recognized as diagnostic and prognostic modalities in patients with opportunistic infections35. This protocol describes a facile antigen stimulation system that allows for robust and multimodal analysis of antigen-specific immunity using minimal blood volumes (250-500 µL per antigen). The downsized 250 µL protocol yielded an excellent correlation of antigen-specific T-cell frequencies, phenotypes, and cytokine production when compared to the previously established 500 µL protocol. Despite the availability of small-volume solutions for some steps of sample processing36, to the authors' knowledge, no currently available commercial system can reliably support antigen stimulation and multifaceted functional analysis of T-cell-driven functional immune responses by flow cytometry, cytokine release assays, and transcriptomics from blood volumes of 250-500 µL. The most widely used commercial system facilitating a similar spectrum of research applications uses a 1 mL blood volume in a 3 mL stimulation environment, resulting in considerably higher cost and amounts of antigens needed compared to the protocol presented here13,14,15.
Despite continuous optimization of whole blood-based protocols for flow cytometric quantification of antigen-specific T-cells6,37,38, flow cytometric measurements have several disadvantages. In particular, they remain laborious in nature and are difficult to standardize due to considerable inter-operator variability (e.g., the subjective gating process) and different equipment setups, compensation protocols, and acquisition parameters between laboratories. Although standardized reporting39 and the use of automated analysis and gating software might improve standardization and comparability of increasingly complex multicolor data sets40,41, the stimulation protocol described here has been designed to accommodate various non-flow-cytometric readout modalities.
In particular, cytokine release assays can be performed with low hands-on time and relatively inexpensive equipment, and they are often readily standardized for routine clinical applications. Moreover, as shown in previous studies using this protocol, a multitude of cytokine responses can be measured from minimal sample volumes with modern multiplexed assays, thus allowing for profiling of complex cytokine signatures in research settings24,42. Of note, this robust protocol with dual co-stimulation facilitates reliable quantification of antigen-specific cytokine responses in non-lymphopenic patients (>800 lymphocytes/µL blood), even in those receiving iatrogenic immunosuppression26,34. As a disadvantage of cytokine release assays, especially in patients with leukopenia, secreted cytokines cannot be retraced to individual cell populations. In some cases, this might be mitigated by the use of cell-specific stimuli, if available. However, a combination of cytokine concentrations with other readout modalities and/or adjustment of cytokine responses based on clinical hematology (i.e., complete blood count with leukocyte differentiation) may be required. Notably, the protocol presented here allows for a combination of cytokine readouts and transcriptional signatures from the same sample, thereby allowing for concordant analysis of well-defined transcriptional activation markers that might add cellular context and specificity to global cytokine signatures.
A future step toward complete standardization and even better clinical practicability would be full automation of these assays from sample processing to analyte readout. Even though precise automated isolation of individual cell populations has been successfully established43,44, the antigen-specific T-cell analysis still requires laboratory personnel to take intermittent handling steps. However, the omission of cell isolation and handling of vulnerable PBMC and the use of commercial, automation-compatible stimulation tubes might facilitate the implementation of simple, fully automated whole blood-based workflows for functional immunoassays.
Altogether, versatile whole blood-based protocols, such as the one presented herein, hold significant promise to expand applications of antigen-specific functional immunoassays to new patient cohorts and fields of research, including preclinical studies in small animals. Antigen-specific functional immunoassays are currently largely unfeasible in murine models or require pooling of blood from several animals and/or the use of non-standardized cell extracts such as splenocytes. Given the emerging interest in immunotherapeutic interventions to boost host defense against opportunistic infections (e.g., immune checkpoint inhibitors, hematopoietic growth factors, cytokines, etc.) and the surge in innovative vaccination technologies, antigen-specific functional immunoassays are expected to play an increasing role in both preclinical infectious diseases research and clinical applications in diverse patient populations. The robust, inexpensive, easy-to-use, low-volume antigen stimulation system presented here may facilitate comprehensive antigen-specific immune analyses in untapped areas. Moreover, the pre-analytic robustness of this facile protocol might create opportunities for improved incorporation of immunoassay applications into clinical routine, allowing us to inch one step closer to personalized, biomarker-driven management of infectious diseases.
Disclosures
There are no conflicts of interests to be disclosed by the authors.
Acknowledgements
We thank the clinical chemistry and infection serology divisions at the Institute for Laboratory Medicine and Microbiology, University Hospital of Augsburg, for performing serum antibody measurements. We thank Dr. Friederike Liesche-Starnecker and the Institute for Pathology and Molecular Diagnostics of the University Hospital Augsburg for providing transcriptomics facilities. We thank Marie Freitag of the University Hospital Augsburg for providing support in vaccinée logistics and sample acquisition. We thank Dr. Olaf Kniemeyer and the Hans-Knoell-Institute in Jena, Germany, for providing Aspergillus fumigatus lysate. The research initiative Bay-VOC (funding number GE2-2452-200-D37666/2022), the Bavarian State Ministry for Science and Art, as well as the University of Augsburg, Germany, supported this work.
Materials
| Name | Company | Catalog Number | Comments |
|---|---|---|---|
| 7-AAD Solution | Miltenyi Biotec | 130-111-568 | |
| Anti-IFN-g-PE, human, REA600, 100 tests | Miltenyi Biotec | 130-113-498 | |
| Aspergillus fumigatus lysate | N/A | N/A | Kindly provided by the Hans-Knoell Institute Jena, Germany |
| Brilliant Violet 650 anti-human CD197 (CCR7) Antibody | BioLegend | 353234 | |
| Buffer EL | Qiagen | 79217 | Erythrocyte lysis buffer |
| CD154-PE-Vio770, human, REA238, 100 tests | Miltenyi Biotec | 130-113-614 | |
| CD279 (PD1)-VioBright 515, human, 100 tests | Miltenyi Biotec | 130-120-386 | |
| CD28 pure, human - functional grade | Miltenyi Biotec | 130-093-375 | |
| CD3-VioBright R720, human, REA613, 100 tests | Miltenyi Biotec | 130-127-377 | |
| CD45RO-APC-Vio770, human, REA611, 100 tests | Miltenyi Biotec | 130-113-557 | |
| CD49d pure, human | Miltenyi Biotec | 130-093-279 | |
| CD4-VioBlue, human, REA623, 100 tests | Miltenyi Biotec | 130-114-534 | |
| CD69-PE-Vio615, human, REA824, 100 tests | Miltenyi Biotec | 130-112-617 | |
| CO2 Incubator | PHCbi | MCO-170AICD-PE | |
| CPI Positive Control Solution | ImmunoSpot | CTL-CPI-001 | |
| CRX-527 | Invivogen | tlrl-crx527 | |
| CytExpert Acquisition and Analysis Software | Beckman Coulter | Version 2.4 | Flow cytometer operating softwware |
| CytoFlex S B2-R3-V4-Y4 | Beckman Coulter | B75408 | Flow cytometer |
| GraphPad Prism | GraphPad | Version 10.1.0 | |
| Herpes simplex virus 1 lysate | AID Autoimmun Diagnostika | ELSP 5916K | |
| HU IFN G Uncoated ELISA 2X96T PLT | Thermo Fisher Scientific | 88-7316-22 | |
| HydroFLex Microplate Washer | Tecan | 30220085 | |
| Infinite M Plex | Tecan | 30213614 | Multimode Microplate Reader |
| Kaluza Analysis Software | Beckman Coulter | Version 2.1.00003.20057 | Flow cytometric data analysis software |
| MACS Inside Stain Kit | Miltenyi Biotec | 130-090-477 | |
| Mastercycler X50l | Eppendorf | 6303000010 | |
| Nanodrop One | Thermo Fisher Scientific | ND-ONE-W | |
| nCounter Sprint Cartridge | Nanostring | 100078 | |
| nCounter Sprint Profiler | Nanostring | 100170 | |
| nCounter Sprint Reagent Pack | Nanostring | 100077 | |
| nSolver | Nanostring | Version 4.0 | Nanostring nCounter data analysis software |
| Octeniderm farblos 250 ml FL | Schuelke | 118211 | |
| Omnifix F Solo, 1 ml, ohne Kanüle, 3-teilig | Braun | 9161406V | Syringes |
| PepTivator CMV pp65, human, 60nmol | Miltenyi Biotec | 130-093-435 | |
| PepTivator SARS-CoV-2 Prot_S, research grade, for stimulation of 1×10⁸ cells | Miltenyi Biotec | 130-126-700 | |
| QIAshredder | Qiagen | 79654 | |
| RNA Protect | Qiagen | 76526 | |
| RNeasy Plus Mini Kit | Qiagen | 74134 | |
| RPMI 1640 Medium, GlutaMAX Supplement, HEPES | Thermo Fisher Scientific | 72400047 | |
| Safe 2020 1.5 Microbiological Safety Cabinet | Thermo Fisher Scientific | 51026959 | |
| S-Monovette lithium-heparin, 4.9 ml | Sarstedt | 04.1939.001 | Blood collection tubes |
| S-Monovette neutral, 2.7 ml | Sarstedt | 05.1729 | Stimulation environment tubes |
| Sterican Safety G 19 x 1 1/2'' 1,1 x 40 mm | Braun | 4670052S-01 | Needles |
| Stop Solution, 100 ML | Thermo Fisher Scientific | BMS409.0100 | |
| Wash Buffer 20X, 500 ML | Thermo Fisher Scientific | BMS408.0500 | |
| Water, 1 l | Carl Roth | 3478.1 | |
| XT Hs Exhaustion CSO | Nanostring | 115000466 | Nanostring Immune Exhaustion Panel |
References
- Mckenna, K. C., Beatty, K. M., Vicetti Miguel, R., Bilonick, R. A. Delayed processing of blood increases the frequency of activated CD11b+ CD15+ granulocytes which inhibit t cell function. J Immunol Methods. 341 (1-2), 68-75 (2009).
- Doberne, D., Gaur, R. L., Banaei, N. Preanalytical delay reduces sensitivity of quantiferon-tb gold in-tube assay for detection of latent tuberculosis infection. J Clin Microbiol. 49 (8), 3061-3064 (2011).
- Corbiere, V., et al. A semi high-throughput whole blood-based flow cytometry assay to detect and monitor bordetella pertussis-specific th1, th2 and th17 responses. Front Immunol. 14, 1101366(2023).
- Lauruschkat, C. D., et al. Development of a simple and robust whole blood assay with dual co-stimulation to quantify the release of t-cellular signature cytokines in response to aspergillus fumigatus antigens. J Fungi (Basel). 7 (6), 462(2021).
- Riou, C., et al. simplified whole blood-based multiparameter assay to quantify and phenotype SARS-COV-2-specific T-cells. Eur Respir J. 59 (1), 2100285(2022).
- Weis, P., et al. Development and evaluation of a whole blood-based approach for flow cytometric quantification of CD154+ mould-reactive T cells. Med Mycol. 58 (2), 187-196 (2020).
- Boyum, A. Isolation of lymphocytes, granulocytes and macrophages. Scand J Immunol. 5, Suppl 5 9-15 (1976).
- Chen, G., Wang, H., Wang, Y. Clinical application of quantiferon-tb gold in-tube in the diagnosis and treatment of tuberculosis. Eur J Clin Microbiol Infect Dis. 39 (4), 607-612 (2020).
- Manuel, O., Kumar, D. Quantiferon-tb gold assay for the diagnosis of latent tuberculosis infection. Expert Rev Mol Diagn. 8 (3), 247-256 (2008).
- Inthawong, M., et al. A whole blood intracellular cytokine assay optimised for field site studies demonstrates polyfunctionality of CD4+ t cells in acute scrub typhus. PLoS Negl Trop Dis. 17 (3), e0010905(2023).
- Johnson, S. A., et al. Evaluation of quantiferon SARS-COV-2 interferon-gamma release assay following SARS-COV-2 infection and vaccination. Clin Exp Immunol. 212 (3), 249-261 (2023).
- Kruttgen, A., et al. Evaluation of the quantiferon SARS-COV-2 interferon-ɣ release assay in mrna-1273 vaccinated health care workers. J Virol Methods. 298, 114295(2021).
- Duffy, D., et al. Standardized whole blood stimulation improves immunomonitoring of induced immune responses in multi-center study. Clin Immunol. 183, 325-335 (2017).
- Duffy, D., et al. Functional analysis via standardized whole-blood stimulation systems defines the boundaries of a healthy immune response to complex stimuli. Immunity. 40 (3), 436-450 (2014).
- Smith, N., et al. Defective activation and regulation of type i interferon immunity is associated with increasing COVID-19 severity. Nat Commun. 13 (1), 7254(2022).
- Lauruschkat, C. D., et al. CD4+ T cells are the major predictor of hcmv control in allogeneic stem cell transplant recipients on letermovir prophylaxis. Front Immunol. 14, 1148841(2023).
- Pelchen-Matthews, A., Parsons, I. J., Marsh, M. Phorbol ester-induced downregulation of cd4 is a multistep process involving dissociation from p56lck, increased association with clathrin-coated pits, and altered endosomal sorting. J Exp Med. 178 (4), 1209-1222 (1993).
- Boise, L. H., et al. CD28 costimulation can promote t cell survival by enhancing the expression of bcl-xl. Immunity. 3 (1), 87-98 (1995).
- Udagawa, T., Woodside, D. G., Mcintyre, B. W. Alpha 4 beta 1 (CD49d/CD29) integrin costimulation of human t cells enhances transcription factor and cytokine induction in the absence of altered sensitivity to anti-cd3 stimulation. J Immunol. 157 (5), 1965-1972 (1996).
- Baumann, J., et al. Golgi stress-induced transcriptional changes mediated by mapk signaling and three ets transcription factors regulate mcl1 splicing. Mol Biol Cell. 29 (1), 42-52 (2018).
- Miller, S. G., Carnell, L., Moore, H. H. Post-golgi membrane traffic: Brefeldin a inhibits export from distal golgi compartments to the cell surface but not recycling. J Cell Biol. 118 (2), 267-283 (1992).
- Zandvliet, M. L., et al. Co-ordinated isolation of CD8(+) and CD4(+) t cells recognizing a broad repertoire of cytomegalovirus pp65 and ie1 epitopes for highly specific adoptive immunotherapy. Cytotherapy. 12 (7), 933-944 (2010).
- Kramer, K. J., et al. Single-cell profiling of the antigen-specific response to bnt162b2 sars-cov-2 rna vaccine. Nat Commun. 13 (1), 3466(2022).
- Tappe, B., et al. COVID-19 patients share common, corticosteroid-independent features of impaired host immunity to pathogenic molds. Front Immunol. 13, 954985(2022).
- Stover, A. G., et al. Structure-activity relationship of synthetic toll-like receptor 4 agonists. J Biol Chem. 279 (6), 4440-4449 (2004).
- Page, L., et al. Impact of immunosuppressive and antifungal drugs on pbmc- and whole blood-based flow cytometric CD154(+) Aspergillus fumigatus specific t-cell quantification. Med Microbiol Immunol. 209 (5), 579-592 (2020).
- Hedley, B. D., Keeney, M. Technical issues: Flow cytometry and rare event analysis. Int J Lab Hematol. 35 (3), 344-350 (2013).
- Bacher, P., Scheffold, A. Flow-cytometric analysis of rare antigen-specific T cells. Cytometry A. 83 (8), 692-701 (2013).
- Frentsch, M., et al. Direct access to CD4+ t cells specific for defined antigens according to cd154 expression. Nat Med. 11 (10), 1118-1124 (2005).
- Osum, K. C., Jenkins, M. K. Toward a general model of CD4(+) t cell subset specification and memory cell formation. Immunity. 56 (3), 475-484 (2023).
- Lighvani, A. A., et al. T-bet is rapidly induced by interferon-gamma in lymphoid and myeloid cells. Proc Natl Acad Sci U S A. 98 (26), 15137-15142 (2001).
- Lamb, Y. N. Bnt162b2 mrna COVID-19 vaccine: First approval. Drugs. 81 (4), 495-501 (2021).
- Arbel, R., et al. Bnt162b2 vaccine booster and mortality due to COVID-19. N Engl J Med. 385 (26), 2413-2420 (2021).
- Lauruschkat, C. D., et al. T-cell immune surveillance in allogenic stem cell transplant recipients: Are whole blood-based assays ready to challenge elispot. Open Forum Infect Dis. 8 (1), 547(2021).
- Albert-Vega, C., et al. Immune functional assays, from custom to standardized tests for precision medicine. Front Immunol. 9, 2367(2018).
- Biolegend. , Available from: https://www.biolegend.com/de-de/products/dry-human-aim-assay-cocktail-kit-23591?GroupID=GROUP28 (2024).
- Lauruschkat, C. D., et al. Susceptibility of a. Fumigatus-specific t-cell assays to pre-analytic blood storage and pbmc cryopreservation greatly depends on readout platform and analytes. Mycoses. 61 (8), 549-560 (2018).
- Wurster, S., et al. Quantification of a. Fumigatus-specific cd154+ t-cells-preanalytic considerations. Med Mycol. 55 (2), 223-227 (2017).
- Britten, C. M., et al. T cell assays and miata: The essential minimum for maximum impact. Immunity. 37 (1), 1-2 (2012).
- Cossarizza, A., et al. Guidelines for the use of flow cytometry and cell sorting in immunological studies (third edition). Eur J Immunol. 51 (12), 2708-3145 (2021).
- Le Lann, L., et al. Standardization procedure for flow cytometry data harmonization in prospective multicenter studies. Sci Rep. 10 (1), 11567(2020).
- Lauruschkat, C. D., et al. Chronic occupational mold exposure drives expansion of aspergillus-reactive type 1 and type 2 t-helper cell responses. J Fungi (Basel). 7 (9), 698(2021).
- Pascual-Garcia, M., et al. Lif regulates cxcl9 in tumor-associated macrophages and prevents cd8(+) t cell tumor-infiltration impairing anti-pd1 therapy. Nat Commun. 10 (1), 2416(2019).
- Paull, D., et al. Automated, high-throughput derivation, characterization and differentiation of induced pluripotent stem cells. Nat Meth. 12 (9), 885-892 (2015).
Reprints and Permissions
