The procedures for body size, shape, and composition assessment through commercially available solutions for three-dimensional optical imaging enable the rapid collection of accurate and reproducible data. Clinicians could implement the acquisition of innovative and useful biomarkers ("e-tape" measurements) in routine evaluations of patients to assist in characterizing their health status.
Method Article
Clinical Anthropometrics and Body Composition from 3-Dimensional Optical Imaging
Marco A. Minetto1 , Chiara Busso1 , Andrea Ferraris1 , Angelo Pietrobelli2,3 , John A. Shepherd4 , Cassidy McCarthy2 , Steven B. Heymsfield2
1Division of Physical Medicine and Rehabilitation, Department of Surgical Sciences, University of Turin, 2Pennington Biomedical Research Centre, 3Department of Surgical Sciences, Dentistry, Gynaecology and Paediatrics, Paediatric Unit, University of Verona, 4Department of Epidemiology, University of Hawaii Cancer Center
Opens in a new tab
In This Article
Summary
Loading...
$$\rightleftharpoonup{xx}$$
$$\longleftharp{xx}$$,
$$\longrightharp{xx}$$,
Abstract
Loading...
$$\rightleftharpoonup{xx}$$
$$\longleftharp{xx}$$,
$$\longrightharp{xx}$$,
The body size and composition assessment is commonly included in the routine management of healthy athletes as well as of different types of patients to personalize the training or rehabilitation strategy. The digital anthropometric analyses described in the following protocol can be performed with recently introduced systems. These new tools and approaches have the potential to be widely used in clinical settings because they are very simple to operate and enable the rapid collection of accurate and reproducible data. One system consists of a rotating platform with a weight measurement plate, three infrared cameras, and a tablet built into a tower, while the other system consists of a tablet mounted on a holder. After image capture, the software of both systems generates a de-identified three-dimensional humanoid avatar with associated anthropometric and body composition variables. The measurement procedures are simple: a subject can be tested in a few minutes and a comprehensive report (including the three-dimensional scan and body size, shape, and composition measurements) is automatically generated.
Introduction
Loading...
$$\rightleftharpoonup{xx}$$
$$\longleftharp{xx}$$,
$$\longrightharp{xx}$$,
Anthropometry is the study of the physical measures of the human body. Height, weight, lengths, skinfold thicknesses, and circumferences are commonly used anthropometric measures that proved to be useful for investigating patients with endocrine and metabolic disorders and for monitoring growth, aging, and body size and composition adaptations elicited by diet and training in athletes1,2. For example, the assessment of waist and hip circumferences proved to be useful for the management of persons with obesity: both circumferences assess the distribution of adiposity that can be considered a predictor of all-cause mortality3.
Limb circumferences are frequently assessed in rehabilitative and sports medicine because of their usefulness for detecting and/or monitoring the decrease in appendicular lean mass (e.g., calf circumference is used as a simple and practical skeletal muscle marker for diagnosing low skeletal muscle and sarcopenia)1,2 and the inter-limb asymmetry that impacts both physical performance and risk of injuries in athletes and quality of life in patients (e.g., cancer patients with unilateral extremity swelling)1,2. Further, a large number of anthropometrics-based body composition prediction models have been proposed over the last several decades to estimate the amount of fat mass or fat-free mass from a combination of different anthropometric measures such as body circumferences or skinfold thicknesses1,2,4,5,6,7.
Because conventional anthropometric (i.e., tape-based and caliper-based) measurements may not be culturally or socially acceptable and also exhibit poor reliability8, there was the need for the development and validation of non-invasive, reproducible, and valid approaches. Recently developed three-dimensional (3D) optical imaging systems enabled to provide non-invasive, precise, and accurate measurements8,9,10,11, as well as digital consumer cameras and smartphones offer easy-to-use and widely available tools suitable to be used in clinical and non-clinical settings to evaluate both patients and healthy subjects8,9,10,11,12,13,14,15,16,17,18,19,20. The aim of the protocol reported in the following section is to describe the procedures for evaluating body size, shape, and composition through two commercially available solutions for 3D optical imaging that became pervasive during the last years both in the healthcare setting (to evaluate patients) and in non-clinical settings (to evaluate athletes).
Protocol
Loading...
$$\rightleftharpoonup{xx}$$
$$\longleftharp{xx}$$,
$$\longrightharp{xx}$$,
The protocol follows the research integrity guidelines of the Polytechnic of Turin21. The acquisition of optical images was performed within research studies approved by the local ethics committees (data are reported in the legends of Figure 1 and Figure 2) and the investigated subjects gave their written consent (for study participation and publication of anonymized images).
1. Subject preparation
NOTE: All prescanning preparations described in this section are similar between testing procedures #1 and #2.
- Ask the subject to be dressed in undergarments or to wear minimal form-fitting garments (shorts if male and shorts and sports bra if female), to remove socks, shoes, and accessories, and to wear a swim cap for hair coverage.
2. Subject registration for the testing procedure #1
- Measure the height of the subject using a standard stadiometer.
- Launch the app installed on the tablet (app #1 and tablet #1 in the Table of Materials) of system #1 that consists of a rotating platform with a weight measurement plate, three infrared cameras, and the tablet built into a tower (Figure 1A,B).
- Fill in the subject registration form (Supplemental Figure S1), including the first name, last name, email address, password, gender (select male or female), units of measurement (select US or metric), ethnicity (select one of the following groups: unspecified, Hispanic/Latino, American Indian or Alaska Native, Asian, Black or African American, Native Hawaiian or Other Pacific Islander, Caucasian), birth date.
- Flag the three checkboxes (acceptance of terms of service agreement, privacy policy, liability waiver), then tap the Submit button.
- Verify that the subject is wearing the swim cap properly, then tap the Next button.
- Verify that the subject is wearing proper attire, then tap the Next button.
- Verify that the scanner area is clear (i.e., keep clothing outside the scanning area and ensure that there is no sunlight or reflective material in the view of the scanner), then tap the Next button.
- Fill in the height measurement field, then tap the Next button.
- Fill in the fields related to optional additional metrics (body fat % [BF%], heart rate, systolic and diastolic blood pressure, intracellular and extracellular water), then tap the Submit button.
3. Testing procedure #1
- Ask the subject to step on the scale and stand as still as possible on the footprints (with upper limbs and hands on the two sides, without touching the telescoping handles) for 10 s to capture the body weight (and its distribution).
- Ask the subject to stand upright in a standardized A-pose (with shoulder relaxed and arms positioned straight and abducted from the torso) while grasping the telescoping handles to perform the body scanning according to the following instructions (Figure 1A,B).
NOTE: A full body scan takes ~45 s during which light-coding depth sensors capture the 3D shape as the platform rotates once around.- Lift the handles until the arms and legs are straight.
- Stay as still as possible.
- Keep the head still with eyes forward.
- Press and hold the buttons of the handles until the scan is complete.
- Step off the scale when the scan is complete.
- After the subject steps off the scale, tap the Sign out button.
4. Subject registration for the testing procedure #2
- Measure the height and weight of the subject using a standard scale with a stadiometer.
- Using any modern web browser installed on a desktop or laptop computer, go to the dashboard of system #2 (registration dashboard in the Table of Materials).
- Fill in the subject registration form (Supplemental Figure S2), including the first name, last name, phone number, email address, age, gender (select male or female), weight, and height.
- Flag the checkbox (acceptance of terms of use and privacy policy), then tap or click the Sign up button to complete the account setup.
- Visualize the account view page showing the subject's unique quick response (QR) code, phone number, and email address.
- Take a picture (e.g., with a mobile phone) of the QR code.
5. Testing procedure #2
- Launch the app (app #2 in the Table of Materials) installed on the tablet of system #2 that consists of a tablet mounted on a holder (tablet #2 and floor stand in the Table of Materials).
- Tap the screen of the tablet and show the QR code.
- Tap the Start button.
- Ask the subject to listen to the audio instructions and watch the guide provided on the screen.
- Ask the subject to stand over a carpet at a standardized distance from the tablet, with the feet in the feet guide (black oval symbol over the carpet) aligned with the green feet marker shown on the screen (Figure 2A).
- Ask the subject to assume a "front A-pose" (and to maintain the pose without movements that can cause a malformed avatar)10,22 with legs separated, arms abducted from the torso at an approximate 45° angle, and hands closed into fists to capture the frontal image (Figure 2B).
- After the frontal image capture, ask the subject to assume a "side pose" with feet together, arms/hands placed straight on the sides (i.e., arms/hands aligned with and against the trunk/thighs), and face straight forward to capture the lateral image (Figure 2C).
- After the lateral image capture, inform the subject the scan is complete (the app displays a Thank you screen).
Results
Loading...
$$\rightleftharpoonup{xx}$$
$$\longleftharp{xx}$$,
$$\longrightharp{xx}$$,
After the image capture, the software of system #1 generates a de-identified 3D humanoid avatar (Figure 1C: point clouds are converted to a mesh connected by triangles with approximately 25,000 vertices and 50,000 faces) and automated anthropometry, which includes lengths, circumferences, volumes, surface areas, and body composition estimates. The dashboard of system #1 enables for each subject to visualize (and download a report including) the 3D scan (Figure 1C), measurements of body weight, size, and shape (i.e., body shape rating, waist circumference, waist-to-hip ratio, trunk-to-leg volume ratio), estimates of basal metabolic rate and body composition (i.e., BF%, fat mass, lean mass), and standard circumference measurements (neck, bust, waist, hips, left and right biceps, left and right forearm, left and right thigh, left and right calf).
Moreover, the results of the posture and balance assessments can also be visualized and are included in the report. The posture assessment results include the front, side, and back views of the 3D scan with associated shift (defined as a part of the body that moves into a sloping position and the rate at which it slopes in any one direction) and tilt (defined as the "sliding" movement forward, backward, left or right, a slight change or variation in position from the center point) measurements: i) front and back views: shift measurements toward right or left with respect to the sagittal plane (represented as a vertical line between right and left hemisomes) and tilt percentages with respect to the transverse (horizontal plane) for head, shoulder, underbust, hip, knee; ii) side view: shift measurements forward or backward with respect to the frontal (coronal) plane (represented as a vertical line up from the ankle joint) for head, shoulder, hip, knee.
The balance assessment result includes the weight distribution during standing posture for the anterior and posterior regions of the right and left feet. The dashboard of system #1 also enables for each subject to download .OBJ and .GIF image files and a .CSV file with the anthropometric measurements and body composition estimates listed in Table 1.
All body composition estimates are obtained by using proprietary algorithms, with the exceptions of the basal metabolic rate estimation and of the body shape index calculation that are obtained, respectively, according to the Mifflin-St. Jeor equation23 and the Krakauer equation24 reported in Table 2.
After the image capture, the software of system #2 generates a de-identified 3D humanoid avatar (Figure 2D: point clouds are converted to a mesh connected by triangles with approximately 50,000 vertices and 100,000 faces) and automated anthropometry, which includes lengths, circumferences, volumes, surface areas, and body composition estimates. The dashboard of system #2 (data download dashboard in the Table of Materials) enables for each subject to download .OBJ and .PNG image files and the following three .CSV files:
The "App Measures.csv" file reports the following anthropometric and body composition measurements: weight, body surface area, BF%, visceral adipose tissue, fitness index, arms lean mass, legs lean mass, lean body mass, total bone mineral content, shoulder width, back shoulder width (through back neck), circumferences of neck, overarm, biceps (right/left), forearm (right/left), wrist (right/left), chest, underbust, bust (with drop), stomach, waist, paint waist, hips (taken 8 inches down from small of back), seat, thigh (right/left), calf (right/left), back-neck-to-waist length, sleeve length (right/left), crotch length, inseam, outseam (right/left).
The "Body Composition.csv" file reports the following anthropometric and body composition measurements: body fat, body mass index, body surface area, bone mineral content, fat mass index, fitness index, height, lean body index, lean body mass, arms lean mass, legs lean mass, resting metabolic rate, stomach circumference, visceral adipose tissue, waist-to-height ratio, waist-to-hip ratio, weight.
The "Core Measures.csv" file reports the anthropometric measurements listed in Table 1.
All body composition estimates are obtained by using proprietary algorithms, with the exceptions of the basal metabolic rate estimation and the BF% estimation that are obtained, respectively, according to the Katch-McArdle equation25 and to the two equations previously developed and validated by Harty et al.26. These two equations (BF% Equation 1 and Equation 2 in Table 2) are adopted, respectively, for individuals with lower abdominal circumference <103.5 cm (<40.75 inches) and ≥103.5 cm (≥40.75 inches). Although previous studies demonstrated the accuracy of Equation 1 for BF% estimation in healthy adults15,26, we recently found that it overestimated (with respect to dual-energy X-ray absorptiometry) the BF% in young athletes18. Therefore, we proposed the reparameterization (Equation 3) reported in Table 2 to provide an accurate estimation of BF% in young soccer players of both sexes18.
In addition to the above-listed body composition variables, the appendicular lean mass (ALM) can also be estimated for the scans performed with system #2 through the device-specific equation recently proposed by McCarthy et al.27 for sedentary subjects (ALM Equation 1 for males and ALM Equation 2 for females in Table 2) that we adapted for ALM estimation in young athletes (ALM Equation 3 for males and ALM Equation 4 for females in Table 2)18.
Figure 3 shows representative avatars obtained in a male athlete (body mass index: 26.0 kg/m2: Figure 3A,B) and a person with obesity (body mass index: 44.0 kg/m2: Figure 3C,D) with the system #1 (Figure 3A,C) and with the system #2 (Figure 3B,D). The anthropometric measurements and body composition estimates obtained by system #1 and system #2 for two scans of both subjects are reported in Table 3.
Circumference measurements obtained in the athlete differed between the scans obtained with the two systems (especially for the neck, arms, hips, and legs: data are reported in Table 3). BF% values (averages of the two scans) were 19.1% and 16.1% for the scans performed with systems #1 and #2, respectively, and lean mass values (averages of the two scans) were 69.7 kg and 72.2 kg. The ALM average value for the scans performed with system #2 was 38.4 kg.
Circumference measurements obtained in the person with obesity differed between the scans obtained with the two systems (especially for waist and legs: data are reported in Table 3). BF% values (averages of the two scans) were 44.1% and 46.3% for the scans performed with systems #1 and #2, respectively, and lean mass values (averages of the two scans) were 67.9 kg and 64.9 kg. The ALM average value for the scans performed with system #2 was 25.1 kg.
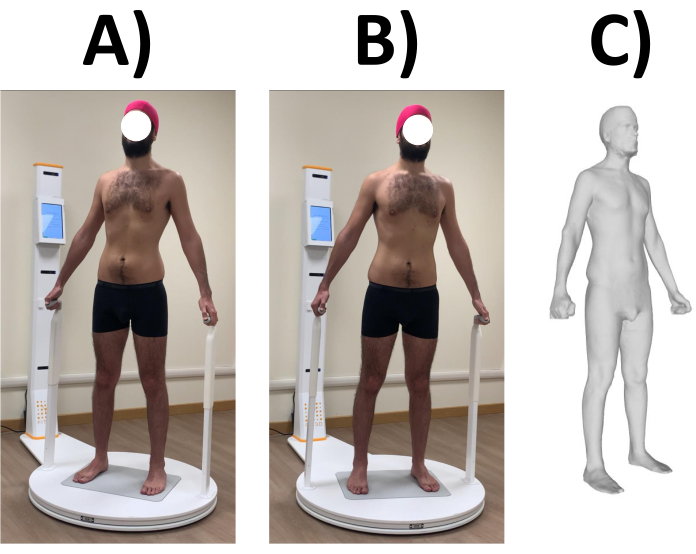
Figure 1: Images taken with system #1. (A,B) Standardized A-pose assumed and maintained by a representative male subject during the rotation of the platform and (C) the relative 3D avatar. Acquisition of optical images was performed within a research study approved by the ethics committee of the University of Turin (protocol n. 0115311). Please click here to view a larger version of this figure.
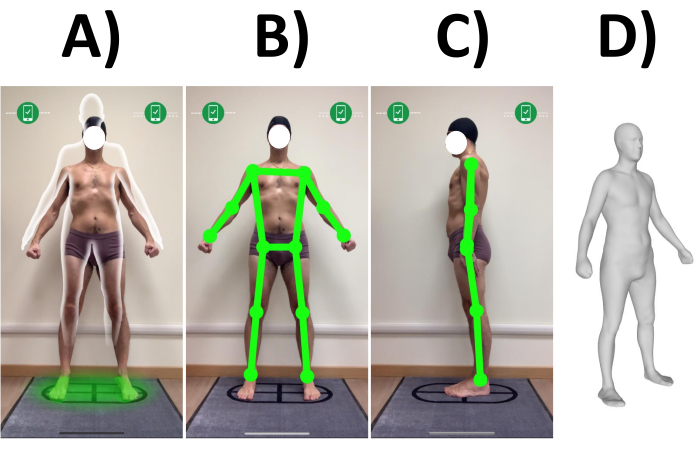
Figure 2: Images taken with system #2. (A) Image of a representative male subject standing over a carpet with the feet guide symbol (black oval symbol over the carpet) aligned with the green feet marker shown on the screen of the tablet of system #2. Acquisition of the (B) frontal and (C) lateral images in the representative subject and (D) the relative 3D avatar. Acquisition of optical images was performed within a research study approved by the ethics committee of the University of Turin (protocol n. 0115311). Please click here to view a larger version of this figure.
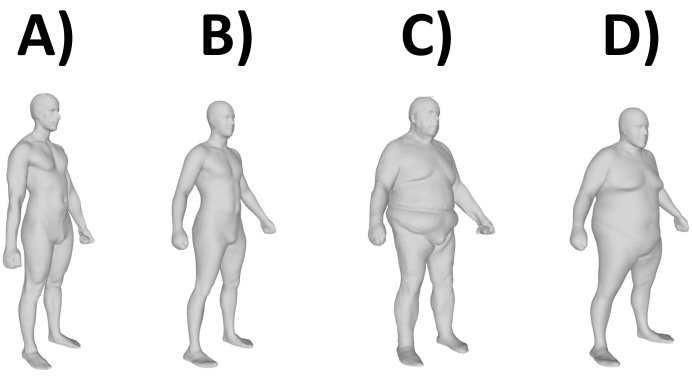
Figure 3: Representative avatars obtained with systems #1 and #2. (A,B) Male athlete and (C,D) a person with obesity investigated with (A,C) system #1 and (B,D) system #2. Each subject underwent two scans, with repositioning: the avatar obtained from the first scan was shown for both subjects, while the anthropometric and body composition estimates obtained by system #1 and system #2 for two scans of both subjects are reported in Table 3. Acquisition of optical images was performed within research studies approved by the ethics committee of the University of Turin (protocol n. 0115311) and by the Territorial Ethics Committee (CET - protocol n. 0065654). Please click here to view a larger version of this figure.
Table 1: Extended measurement sets downloadable from the dashboard of systems #1 and #2. Please click here to download this Table.
Table 2: Equations for estimation of basal metabolic rate, body fat percentage, and appendicular lean mass. Basal metabolic rate estimations: the units of measurement are kg for weight and lean mass, cm for height, and years for age. A body shape index estimation: the units of measurement are m for waist circumference and height are measured, kg/m2 for body mass index. Body fat percentage estimation: sex is coded as male = 1 and female = 0, body surface area is measured in cm2, and all remaining variables indicated as circ. are measured in cm. Muscle to stomach index is obtained as (right biceps circ. + left biceps circ. + right thigh circ. + left thigh circ. + right calf circ. + left calf circ.) / maximum stomach circ. Appendicular lean mass estimation: the units of measurement are cm for all circumferences and lengths; cm2 for surface areas; cm3 for volumes; kg for weight; years for age. Three equations of this table are from Minetto et al.18. Abbreviations: BMR = basal metabolic rate; ABSI = a body shape index; BF% = body fat percentage; circ. = circumferences; ALM = appendicular lean mass; NHOPI = Native Hawaiian and other Pacific Islander. Please click here to download this Table.
Table 3. Circumference measurements and body composition estimates obtained by the two systems in each of the two representative subjects (one athlete and one person with obesity). Please click here to download this Table.
Supplemental Figure S1: Subject registration form for testing procedure #1. Please click here to download this File.
Supplemental Figure S2: Subject registration form for testing procedure #2. Please click here to download this File.
Discussion
Loading...
$$\rightleftharpoonup{xx}$$
$$\longleftharp{xx}$$,
$$\longrightharp{xx}$$,
The procedures presented in this article can be used to evaluate body size, shape, and composition through two commercially available solutions for 3D optical imaging that have been previously developed and validated9,10,11,12,13,14,15,16,17,18,19,20. These solutions are simple to operate, and valid data can be quickly collected and automatically organized into a report. Moreover, the presented systems enable the collection of reproducible data (as suggested by the comparison of the results from the two scans performed with both systems in our two representative cases and documented by previous studies)9,10,11,12,13,14,15,16,17,18,19,20 and can therefore be used to monitor the training- or diet-induced changes.
As system #2 has a limited weight (~4 kg in total for tablet and holder), it is easily portable. However, a limitation of system #2 is that the generation of a 3D avatar from 2D images can produce 3D reconstructions that are less accurate than those obtained with system #1, especially in persons with obesity (as shown in the representative example of Figure 3 C,D) or in patients presenting localized abnormalities of the body shape (e.g., patients after bariatric surgery presenting troublesome skin excess or cancer patients with unilateral upper or lower limb lymphedema).
The availability of adequate space is critical for the scan acquisition with both systems: a clear area of 157 x 198 cm for system #1 and of 86 x 166 cm for system #2 is required. Moreover, system #2 requires the subject to be placed close to a blank wall without mirrors, glossy posters, or windows. Both systems require that no natural sunlight and no reflective surfaces should be in view of the cameras. Both systems also require a constant and consistent wi-fi internet connection to process scans effectively.
The main limitation of the above-described procedures is that they require the investigated subject to be able to assume the standing position. Therefore, these approaches cannot be used in severely ill patients (such as seriously impaired neurological patients or critically ill patients) who are unable to get out of bed. Moreover, the investigated subjects must be able to maintain the standing position (i.e., A-pose and side pose) without movements that can change the shape of the avatar10,22 and bias the estimation of body circumferences.
A limitation of the above-described parameters is that they are obtained using proprietary device-specific algorithms: this implies that the body size, shape, and composition measurements are unique to the particular scanning system. Therefore, comparing or pooling data acquired with different systems is precluded by analytical (i.e., between scanners) variability. Consistently, circumference measurements obtained in our representative two subjects shown in Figure 3 differed between the two systems. However, device-agnostic solutions have already been developed to overcome this limitation: these solutions reformat and edit the 3D mesh, then automatically detect different landmarks (such as armpits, crotch, and feet) and then calculate body size measurements28,29,30,31,32,33,34,35. Another limitation of the above-described body composition parameters is that they are obtained through conventional anthropometrics-based prediction models. However, recent studies showed that body shape-based models could be required to capture information about body composition beyond conventional anthropometric measurements36,37.
Despite some limitations, the digital anthropometric approach must be considered ready to be used in the clinical setting. 3D imaging systems provide non-invasive measurements that can be more acceptable compared to manual (tape-based and/or caliper-based) measurements that are based on the identification of anatomical landmarks through observation and palpation. Moreover, 3D optical scanning is also faster compared to other investigations (e.g., magnetic resonance imaging and dual-energy X-ray absorptiometry) commonly adopted in research and clinical settings for body size and composition assessment. In addition, as it is relatively inexpensive and radiation-free, it is safe to be used for subsequent scans (e.g., the image acquisition can easily and quickly be repeated if the experimenter notices body movements or an improper limb placement that can produce changes in the shape of the avatar) and for repeated investigations38 as well as safe to be used in special populations (such as children, adolescents, and pregnant women)35,39.
Clinicians could therefore implement the acquisition of innovative and useful biomarkers ("e-tape" measurements and derived body composition estimations) in routine evaluations of healthy subjects (e.g., athletes) to assist in predicting and characterizing their physical performance and injury risk40,41,42,43 as well as to monitor injury recovery. For example, leg strength and lean mass symmetry influence physical performance and (re-)injury risk44. Therefore, the recovery of a normal symmetry of the thigh/calf circumferences can be included among the general goals to consider for returning to play45. The routine evaluation of patients also could be improved by the integration of digital anthropometry into healthcare. The assessment of body circumferences and shape (that is driven by the internal distribution of soft and fat tissues) can be useful to detect the low mass muscle (e.g., in patients suspected to be sarcopenic), to predict the metabolic disease risk46, to assess the outcome of a surgical procedure, as well as to monitor the patient progress following an intervention38. Patients with diseases that have nutritional components as key contributors to their pathophysiology can specifically benefit from longitudinal monitoring of body size and composition to reduce symptoms and co-existing conditions47. For example, in the case of diet- and/or drug-based management of obesity, it may not be appropriate to only monitor weight because the well-known "25/75 rule of thumb" (i.e., the general assumption that weight loss is typically 25% fat-free mass loss and 75% fat loss) may not accurately describe intervention efficacy38 that could be unraveled by anthropometry-based assessment of the relative amount of muscle and fat loss. Furthermore, digital anthropometry, integrated into healthcare, has the potential to expand healthcare services to remote locations, thereby improving patient assistance and adherence and reducing healthcare costs.
Disclosures
Loading...
$$\rightleftharpoonup{xx}$$
$$\longleftharp{xx}$$,
$$\longrightharp{xx}$$,
A.P. and S.B.H. are on the medical advisory board of Tanita Corporation. The remaining authors have no conflicts of interest to declare.
Acknowledgements
Loading...
$$\rightleftharpoonup{xx}$$
$$\longleftharp{xx}$$,
$$\longrightharp{xx}$$,
The Authors are grateful to Dr. Federico Della Vecchia and Dr. Alessandro Cairo (University of Turin) for their valuable support with the manuscript preparation. This work was supported by grants from Fondazione CRT (Turin, Italy), the University of Turin (Fondo per la Ricerca Locale - ex-60%), and the National Institutes of Health (grant R01DK109008, Shape UP! Adults).
Materials
| Name | Company | Catalog Number | Comments |
|---|---|---|---|
| System #1 | |||
| Proscanner | Fit3D Inc., San Mateo, CA, USA | Version 5 | "System #1" in the manuscript |
| Fit3D Proscanner app | Fit3D Inc., San Mateo, CA, USA | Version 5 | "App #1" in the manuscript |
| CHUWI tablet PC | Chuwi Technology Co., Ltd., Shenzhen, CHINA | Hi10X | "Tablet #1" in the manuscript |
| Fit3D dashboard | Fit3D Inc., San Mateo, CA, USA | https://dashboard.fit3d.com | |
| System #2 | |||
| Mobile Scanner 1 (MS-1) app | Size Stream LLC, Cary, NC, USA | Version 2 | "System #2" in the manuscript |
| iPad | Apple Inc., Cupertino, CA, USA | 9th generation | "Tablet #2" in the manuscript |
| iPad Floor Stand | Displays2go LLC, Fall River, MA, USA | SKU: TABFLATBBK | www.displays2go.com/P-29987/Universal-Tablet-Floor-Stand-Anti-Theft-Locking-Kit |
| Size Stream registration dashboard | Size Stream LLC, Cary, NC, USA | https://measure.mobilefit.sizestream.com | |
| Size Stream data download dashboard | Size Stream LLC, Cary, NC, USA | https://data.mobilefit.sizestream.com |
References
Loading...
$$\rightleftharpoonup{xx}$$
$$\longleftharp{xx}$$,
$$\longrightharp{xx}$$,
- Human body composition-2nd edition. Human Kinetics. , Champaign, IL, USA. (2005).">Heymsfield, S. B., Lohman, T., Wang, Z. M., Going, S. Human body composition-2nd edition. Human Kinetics. , Champaign, IL, USA. (2005).
- ACSM's Body composition assessment. Human Kinetics. , Champaign, IL, USA. (2020).">Lohman, T. G., Milliken, L. A. ACSM's Body composition assessment. Human Kinetics. , Champaign, IL, USA. (2020).
- Waist circumference as a vital sign in clinical practice: a Consensus Statement from the IAS and ICCR Working Group on Visceral Obesity. Nat Rev Endocrinol. 16 (3), 177-189 (2020).">Ross, R., et al. Waist circumference as a vital sign in clinical practice: a Consensus Statement from the IAS and ICCR Working Group on Visceral Obesity. Nat Rev Endocrinol. 16 (3), 177-189 (2020).
- Skeletal muscle mass and quality: evolution of modern measurement concepts in the context of sarcopenia. Proc Nutr Soc. 74 (4), 355-366 (2015).">Heymsfield, S. B., Gonzalez, M. C., Lu, J., Jia, G., Zheng, J. Skeletal muscle mass and quality: evolution of modern measurement concepts in the context of sarcopenia. Proc Nutr Soc. 74 (4), 355-366 (2015).
- Criterion-related validity of field-based methods and equations for body composition estimation in adults: a systematic review. Curr Obes Rep. 11 (4), 336-349 (2022).">Marin-Jimenez, N., et al. Criterion-related validity of field-based methods and equations for body composition estimation in adults: a systematic review. Curr Obes Rep. 11 (4), 336-349 (2022).
- Prediction equations to estimate muscle mass using anthropometric data: a systematic review. Nutr Rev. 81 (11), 1414-1440 (2023).">Duarte, C. K., et al. Prediction equations to estimate muscle mass using anthropometric data: a systematic review. Nutr Rev. 81 (11), 1414-1440 (2023).
- Validation of skinfold equations and alternative methods for the determination of fat-free mass in young athletes. Front Sports Act Living. 5, 1240252(2023).">Jagim, A. R., et al. Validation of skinfold equations and alternative methods for the determination of fat-free mass in young athletes. Front Sports Act Living. 5, 1240252(2023).
- Digital anthropometry for body circumference measurements: European phenotypic variations throughout the decades. J Pers Med. 12 (6), 906(2022).">Minetto, M. A., et al. Digital anthropometry for body circumference measurements: European phenotypic variations throughout the decades. J Pers Med. 12 (6), 906(2022).
- Clinical anthropometrics and body composition from 3D whole-body surface scans. Eur J Clin Nutr. 70 (11), 1265-1270 (2016).">Ng, B. K., Hinton, B. J., Fan, B., Kanaya, A. M., Shepherd, J. A. Clinical anthropometrics and body composition from 3D whole-body surface scans. Eur J Clin Nutr. 70 (11), 1265-1270 (2016).
- Clinically applicable optical imaging technology for body size and shape analysis: comparison of systems differing in design. Eur J Clin Nutr. 71 (11), 1329-1335 (2017).">Bourgeois, B., et al. Clinically applicable optical imaging technology for body size and shape analysis: comparison of systems differing in design. Eur J Clin Nutr. 71 (11), 1329-1335 (2017).
- Digital anthropometry: a critical review. Eur J Clin Nutr. 72 (5), 680-687 (2018).">Heymsfield, S. B., et al. Digital anthropometry: a critical review. Eur J Clin Nutr. 72 (5), 680-687 (2018).
- 3-Dimensional optical scanning for body composition assessment: A 4-component model comparison of four commercially available scanners. Clin Nutr. 39 (10), 3160-3167 (2020).">Tinsley, G. M., Moore, M. L., Benavides, M. L., Dellinger, J. R., Adamson, B. T. 3-Dimensional optical scanning for body composition assessment: A 4-component model comparison of four commercially available scanners. Clin Nutr. 39 (10), 3160-3167 (2020).
- Digital anthropometry via three-dimensional optical scanning: evaluation of four commercially available systems. Eur J Clin Nutr. 74 (7), 1054-1064 (2020).">Tinsley, G. M., Moore, M. L., Dellinger, J. R., Adamson, B. T., Benavides, M. L. Digital anthropometry via three-dimensional optical scanning: evaluation of four commercially available systems. Eur J Clin Nutr. 74 (7), 1054-1064 (2020).
- Anthropometric evaluation of a 3D scanning mobile application. Obesity (Silver Spring). 30 (6), 1181-1188 (2022).">Smith, B., et al. Anthropometric evaluation of a 3D scanning mobile application. Obesity (Silver Spring). 30 (6), 1181-1188 (2022).
- Validity and reliability of a mobile digital imaging analysis trained by a four-compartment model. J Hum Nutr Diet. 36 (3), 905-911 (2023).">Graybeal, A. J., Brandner, C. F., Tinsley, G. M. Validity and reliability of a mobile digital imaging analysis trained by a four-compartment model. J Hum Nutr Diet. 36 (3), 905-911 (2023).
- Evaluation of automated anthropometrics produced by smartphone-based machine learning: a comparison with traditional anthropometric assessments. Br J Nutr. 130 (6), 1077-1087 (2023).">Graybeal, A. J., Brandner, C. F., Tinsley, G. M. Evaluation of automated anthropometrics produced by smartphone-based machine learning: a comparison with traditional anthropometric assessments. Br J Nutr. 130 (6), 1077-1087 (2023).
- Accuracy and precision of 3-dimensional optical imaging for body composition by age, BMI, and ethnicity. Am J Clin Nutr. 118 (3), 657-671 (2023).">Wong, M. C., et al. Accuracy and precision of 3-dimensional optical imaging for body composition by age, BMI, and ethnicity. Am J Clin Nutr. 118 (3), 657-671 (2023).
- Equations for smartphone prediction of adiposity and appendicular lean mass in youth soccer players. Sci Rep. 13 (1), 20734(2023).">Minetto, M. A., et al. Equations for smartphone prediction of adiposity and appendicular lean mass in youth soccer players. Sci Rep. 13 (1), 20734(2023).
- Accuracy and precision of multiple body composition methods and associations with muscle strength in athletes of varying hydration: The Da Kine Study. Clin Nutr. 43 (1), 284-294 (2024).">Cataldi, D., et al. Accuracy and precision of multiple body composition methods and associations with muscle strength in athletes of varying hydration: The Da Kine Study. Clin Nutr. 43 (1), 284-294 (2024).
- Smartphone derived anthropometrics: Agreement between a commercially available smartphone application and its parent application intended for use at point-of-care. Clinical Nutrition ESPEN. 59, 107-112 (2024).">Graybeal, A. J., et al. Smartphone derived anthropometrics: Agreement between a commercially available smartphone application and its parent application intended for use at point-of-care. Clinical Nutrition ESPEN. 59, 107-112 (2024).
- https://www.polito.it/sites/default/files/2023-05/Research%20Integrity%20POLITO_EN.pdf (2024).">Politecnico di Torino. , Available from: https://www.polito.it/sites/default/files/2023-05/Research%20Integrity%20POLITO_EN.pdf (2024).
- Hole filling in 3D scans for digital anthropometric applications. Annu Int Conf IEEE Eng Med Biol Soc. 2019, 2752-2757 (2019).">Sobhiyeh, S., et al. Hole filling in 3D scans for digital anthropometric applications. Annu Int Conf IEEE Eng Med Biol Soc. 2019, 2752-2757 (2019).
- A new predictive equation for resting energy expenditure in healthy individuals. Am J Clin Nutr. 51 (2), 241-247 (1990).">Mifflin, M. D., et al. A new predictive equation for resting energy expenditure in healthy individuals. Am J Clin Nutr. 51 (2), 241-247 (1990).
- A new body shape index predicts mortality hazard independently of body mass index. PLoS One. 7 (7), e39504(2012).">Krakauer, N. Y., Krakauer, J. C. A new body shape index predicts mortality hazard independently of body mass index. PLoS One. 7 (7), e39504(2012).
- Validity of body composition prediction equations for college men and women. Am J Clin Nutr. 28 (2), 105-109 (1975).">Katch, F. I., McArdle, W. D. Validity of body composition prediction equations for college men and women. Am J Clin Nutr. 28 (2), 105-109 (1975).
- Novel body fat estimation using machine learning and 3-dimensional optical imaging. Eur J Clin Nutr. 74 (5), 842-845 (2020).">Harty, P. S., et al. Novel body fat estimation using machine learning and 3-dimensional optical imaging. Eur J Clin Nutr. 74 (5), 842-845 (2020).
- Smartphone prediction of skeletal muscle mass: model development and validation in adults. Am J Clin Nutr. 117 (4), 794-801 (2023).">MCCarthy, C., et al. Smartphone prediction of skeletal muscle mass: model development and validation in adults. Am J Clin Nutr. 117 (4), 794-801 (2023).
- SMPL: A skinned multi-person linear model. ACM Trans Graph. 34, 248(2015).">Loper, M., Mahmood, N., Romero, J., Pons-Moll, G., Black, M. J. SMPL: A skinned multi-person linear model. ACM Trans Graph. 34, 248(2015).
- http://meshcapade.me (2024).">Meshcapade Me. , Available from: http://meshcapade.me (2024).
- Digital anthropometry for body circumference measurements: Toward the development of universal three-dimensional optical system analysis software. Obes Sci Pract. 7 (1), 35-44 (2020).">Sobhiyeh, S., et al. Digital anthropometry for body circumference measurements: Toward the development of universal three-dimensional optical system analysis software. Obes Sci Pract. 7 (1), 35-44 (2020).
- Digital anthropometric volumes: Toward the development and validation of a universal software. Med Phys. 48 (7), 3654-3664 (2021).">Sobhiyeh, S., et al. Digital anthropometric volumes: Toward the development and validation of a universal software. Med Phys. 48 (7), 3654-3664 (2021).
- Total body and regional surface area: Quantification with low-cost three-dimensional optical imaging systems. Am J Phys Anthropol. 175 (4), 865-875 (2021).">Dechenaud, M. E., Kennedy, S., Sobhiyeh, S., Shepherd, J., Heymsfield, S. B. Total body and regional surface area: Quantification with low-cost three-dimensional optical imaging systems. Am J Phys Anthropol. 175 (4), 865-875 (2021).
- A pose-independent method for accurate and precise body composition from 3D optical scans. Obesity (Silver Spring). 29 (11), 1835-1847 (2021).">Wong, M. C., et al. A pose-independent method for accurate and precise body composition from 3D optical scans. Obesity (Silver Spring). 29 (11), 1835-1847 (2021).
- A device-agnostic shape model for automated body composition estimates from 3D optical scans. Med Phys. 49 (10), 6395-6409 (2022).">Tian, I. Y., et al. A device-agnostic shape model for automated body composition estimates from 3D optical scans. Med Phys. 49 (10), 6395-6409 (2022).
- Automated body composition estimation from device-agnostic 3D optical scans in pediatric populations. Clin Nutr. 42 (9), 1619-1630 (2023).">Tian, I. Y., et al. Automated body composition estimation from device-agnostic 3D optical scans in pediatric populations. Clin Nutr. 42 (9), 1619-1630 (2023).
- Three-dimensional optical scanning for clinical body shape assessment comes of age. Am J Clin Nutr. 110 (6), 1272-1274 (2019).">Wells, J. C. K. Three-dimensional optical scanning for clinical body shape assessment comes of age. Am J Clin Nutr. 110 (6), 1272-1274 (2019).
- Detailed 3-dimensional body shape features predict body composition, blood metabolites, and functional strength: the Shape Up! studies. Am J Clin Nutr. 110 (6), 1316-1326 (2019).">Ng, B. K., et al. Detailed 3-dimensional body shape features predict body composition, blood metabolites, and functional strength: the Shape Up! studies. Am J Clin Nutr. 110 (6), 1316-1326 (2019).
- Monitoring body composition change for intervention studies with advancing 3D optical imaging technology in comparison to dual-energy X-ray absorptiometry. Am J Clin Nutr. 117 (4), 802-813 (2023).">Wong, M. C., et al. Monitoring body composition change for intervention studies with advancing 3D optical imaging technology in comparison to dual-energy X-ray absorptiometry. Am J Clin Nutr. 117 (4), 802-813 (2023).
- Children and adolescents' anthropometrics body composition from 3-D optical surface scans. Obesity (Silver Spring). 27 (11), 1738-1749 (2019).">Wong, M. C., et al. Children and adolescents' anthropometrics body composition from 3-D optical surface scans. Obesity (Silver Spring). 27 (11), 1738-1749 (2019).
- Machine learning prediction of combat basic training injury from 3D body shape images. PLoS One. 15 (6), e0235017(2020).">Morse, S., et al. Machine learning prediction of combat basic training injury from 3D body shape images. PLoS One. 15 (6), e0235017(2020).
- Military body composition standards and physical performance: historical perspectives and future directions. J Strength Cond Res. 36 (12), 3551-3561 (2022).">Harty, P. S., et al. Military body composition standards and physical performance: historical perspectives and future directions. J Strength Cond Res. 36 (12), 3551-3561 (2022).
- Anthropometric predictors of conventional deadlift kinematics and kinetics: a preliminary study. Int J Exerc Sci. 16 (1), 429-447 (2023).">Keith, D. S., et al. Anthropometric predictors of conventional deadlift kinematics and kinetics: a preliminary study. Int J Exerc Sci. 16 (1), 429-447 (2023).
- Body shape and performance on the US Army Combat Fitness Test: Insights from a 3D body image scanner. PLoS One. 18 (5), e0283566(2023).">Smith, M., et al. Body shape and performance on the US Army Combat Fitness Test: Insights from a 3D body image scanner. PLoS One. 18 (5), e0283566(2023).
- Leg strength and lean mass symmetry influences kicking performance in Australian football. J Sports Sci Med. 13 (1), 157-165 (2014).">Hart, N. H., Nimphius, S., Spiteri, T., Newton, R. U. Leg strength and lean mass symmetry influences kicking performance in Australian football. J Sports Sci Med. 13 (1), 157-165 (2014).
- Consensus statement on return to sport from the First World Congress in Sports Physical Therapy, Bern. Br J Sports Med. 50 (14), 853-864 (2016).">Ardern, C. L., et al. Consensus statement on return to sport from the First World Congress in Sports Physical Therapy, Bern. Br J Sports Med. 50 (14), 853-864 (2016).
- Three-dimensional optical body shape and features improve prediction of metabolic disease risk in a diverse sample of adults. Obesity (Silver Spring). 30 (8), 1589-1598 (2022).">Bennett, J. P., et al. Three-dimensional optical body shape and features improve prediction of metabolic disease risk in a diverse sample of adults. Obesity (Silver Spring). 30 (8), 1589-1598 (2022).
- Guidance on energy and macronutrients across the life span. N Engl J Med. 390 (14), 1299-1310 (2024).">Heymsfield, S. B., Shapses, S. A. Guidance on energy and macronutrients across the life span. N Engl J Med. 390 (14), 1299-1310 (2024).
Reprints and Permissions
Request permission to reuse the text or figures of this JoVE article
Request Permission