This protocol describes establishing three-dimensional (3D) tissue organoids from primary human ovarian surface epithelium (hOSE) cells. The protocol includes isolation of hOSE from freshly collected ovaries, cellular expansion of the hOSE, cryopreservation-thawing procedures, and organoid derivation. Immunofluorescence, quantitative analysis, and showcasing utility as a screening platform are included.
Method Article
Human Ovarian Surface Epithelium Organoids as a Platform to Study Tissue Regeneration
* These authors contributed equally
In This Article
Summary
Abstract
The ovarian surface epithelium (OSE), the outermost layer of the ovary, undergoes rupture during each ovulation and plays a crucial role in ovarian wound healing while restoring ovarian integrity. Additionally, the OSE may serve as the source of epithelial ovarian cancers. Although the OSE regenerative properties have been well studied in mice, understanding the precise mechanism of tissue repair in the human ovary remains hampered by limited access to human ovaries and suitable in vitro culture protocols. Tissue-specific organoids, miniaturized in vitro models replicating both structural and functional aspects of the original organ, offer new opportunities for studying organ physiology, disease modeling, and drug testing.
Here, we describe a method to isolate primary human OSE (hOSE) from whole ovaries and establish hOSE organoids. We include a morphological and cellular characterization showing heterogeneity between donors. Additionally, we demonstrate the capacity of this culture method to evaluate hormonal effects on OSE-organoid growth over a 2-week period. This method may enable the discovery of factors contributing to OSE regeneration and facilitate patient-specific drug screenings for malignant OSE.
Introduction
The ovary is considered one of the most dynamic organs in the body, undergoing constant cycles of wound healing and remodeling throughout the reproductive lifespan of the individual. A main player involved in the regeneration of ovarian tissue after each ovulatory cycle is the ovarian surface epithelium (OSE)1. The OSE is a mesothelium-derived single layer containing flat, cuboidal, and columnar epithelial cells that cover the entire ovarian surface2. Prior to ovulation, the ovarian stromal tissue on the surface of the ovulatory follicle undergoes proteolytic disruption to allow the release of the cumulus-oocyte complex. The wounded area, known as the ovulatory stigma, is then repaired, with complete closure of the ovarian surface achieved in less than 72 hours in mice3. The highly efficient capacity of the OSE to proliferate and close the ovulatory wound highlights the putative existence of a resident stem cell population4. Due to the limited availability of human ovaries from donors of reproductive age, most of the knowledge on the mechanisms of OSE repair comes from animal models. However, species-specific features hamper the translation from animal-based ovarian research to humans5.
In vitro studies have predominantly used 2-dimensional (2D) cell culture of human OSE, whereby cells grew in a monolayer attached to the surface of a culture plate, due to its cost-effectiveness and easy culture6,7,8. Nonetheless, this approach has limitations replicating the complexity of the ovarian tissue dynamics9. In this regard, 3D cell culture platforms with a special focus on ovarian organoids have revolutionized ovarian research10. Tissue organoids are miniaturized in vitro representations of the organ they are derived from, exhibiting 3D self-organization capacity and mimicking key functions and structures of their in vivo counterparts11. This technology offers the possibility to shed light on fundamental questions regarding development, regeneration, and tissue repair in the human ovary10. In recent years, researchers have also applied knowledge on ovarian organoids for the generation of patient-specific ovarian cancer (OC) organoids for disease modeling and personalized medicine12,13,14.
Based on different methods used for the generation of mouse OSE organoids and fallopian tube (FT) organoids15,16 as well as human OSE organoids12 and FT organoids17, we describe here a protocol for the derivation of human OSE organoids from human ovaries with potential applications in OSE regeneration studies. This protocol efficiently isolates primary OSE cells from whole human ovaries and includes a step-by-step description of 2D cell expansion and 3D hOSE organoid generation. The hOSE organoids displayed (donor-specific) variability in morphology and growth, highlighting their utility for personalized studies. Additionally, this protocol includes hOSE organoid maintenance, passaging, and immunofluorescence within the same culture plate. Furthermore, it provides a description of the different morphology that hOSE organoids can adopt and characterizes changes in immunophenotype during culture. Lastly, it showcases utility by investigating the influence of environmental cues, such as ovarian hormones, on hOSE organoid formation and growth based on hOSE organoid number and size.
The application of hOSE organoid technology will enhance our understanding of the ovary, with a specific emphasis on the mechanisms responsible for its remarkable regenerative capacity. As 3D human ovarian models continue to evolve, the reliance on animal models in ovarian research will decrease, leading to innovative therapies in the field of regenerative medicine18.
Protocol
The study was conducted according to the guidelines of the Declaration of Helsinki. The study design was submitted to the Medical Ethical Committee of the Leiden University Medical Center (LUMC), and a letter of no objection was obtained (B18.029) prior to the study. Primary human ovarian tissue used was collected from transmasculine people undergoing gender-affirming surgery at the VUmc hospital (Amsterdam, Netherlands). Signed informed consent was obtained from all donors. All materials used in this protocol are listed in the Table of Materials.
1. Human primary OSE cell isolation
- Following oophorectomy, place ovaries in 0.9% NaCl or similar sterile saline solution and transport it to the laboratory on ice.
- Transfer individual ovaries to a 50 mL conical tube containing 2-3 mL of digestion medium (Table 1) or enough to cover the ovary.
CAUTION: If the ovary is not intact (part of the organ has been cut for histological analysis), it is crucial to not cover this part with the digestion medium. - Place tube in pre-warmed bead bath (or water bath) at 37 °C for 30 min.
- Carefully transfer the ovary into a 60 mm Petri dish containing 10 mL of collection medium (Table 1).
- Scrape the ovarian surface containing the hOSE cells gently using a cell scraper. Wash the scrapper in the medium and repeat this step at least three times (Figure 1).
CAUTION: If the ovary is not intact, avoid both scraping and submerging the damaged area to minimize contamination with unwanted cell types. - Transfer the hOSE cells in the collection medium into a 15 mL tube.
- Spin down hOSE cells at 240 x g for 5 min.
- If the pellet shows a red color, indicative of contamination with red blood cells (RBC), resuspend the pellet with 1 mL of RBC lysis buffer. Incubate for 3 min at room temperature (RT) with occasional pipetting, add 4 mL of PBS with calcium and magnesium (PBS+/+), and centrifuge at 240 x g for 5 min. If RBC persists, repeat this step.
- Cryopreserve the hOSE cell pellet (Section 2), use it for 2D culture (Section 3) or 3D organoids (Section 4) (Figure 1).
2. Cryopreservation-thawing of hOSE cells
- Cryopreservation
- Resuspend the hOSE cell pellet in 1 mL of cell freezing media.
- Transfer cell suspension to cryovials (2x cryovials per ovary).
- Place the cryovials in a freezing container and place it at -80 °C overnight.
- Transfer the frozen cryovials to a liquid nitrogen tank for long-term storage.
- Thawing:
- Remove the cryovial from the liquid nitrogen.
- Place the cryovial in a pre-warmed bead bath (or water bath) at 37 °C for 5 min or until only a small frozen core is visible inside the cryovial.
- Pipet the hOSE cell suspension into a 15 mL tube with 10 mL of collection medium (Table 1).
- Centrifuge at 240 x g for 5 min.
- Use the hOSE cell pellet for 2D culture (Section 3) or 3D organoids (Section 4).
3. 2D hOSE culture in monolayer
- Resuspend the hOSE pellet in 1 mL of OSE_2D medium (Table 1) and transfer it into one well from a 12-well plate.
- Add 1 mL of extra of OSE_2D medium into the well and culture at 37 °C in a humidified incubator (5% CO2) for 72 h to ensure the hOSE cells attach before the first media change.
- Refresh media every 2-3 days until the hOSE cells reach 70%-90% confluency (P0) (Figure 2A).
NOTE: If RBCs are still present in the culture, they will be removed during the first media change, and only the hOSE cells will remain attached to the well. - For passaging hOSE cells, follow the steps described below.
- Remove culture media from the well.
- Wash with 1 mL of sterile PBS.
- Remove PBS and add enough 0.05% Trypsin/EDTA to cover the cells.
- Place the plate at 37 °C in a humidified incubator (5% CO2) for 4-7 min until noticing cells rounding up and detaching from the well.
- Stop the enzymatic reaction by adding 1 mL of collection medium.
- Collect the hOSE cells and centrifuge at 240 x g for 5 min.
- Seed cells in new well at desired density, refresh media every 2-3 days until hOSE cells reach 70%-90% confluency, and repeat step 3.4.
NOTE: Primary hOSE cells can be cultured up to three passages. Afterwards most of the cells will become senescent (Figure 2A).
- Use the expanded hOSE cells for further characterization using immunofluorescence (Figure 2B) to test the effects of culture media (Figure 2C) or for 3D organoids (Section 4).
4. 3D hOSE organoid culture
- Pre-warm multi-well chambered slide at 37 °C.
- Count (freshly isolated or cryopreserved-thawed) hOSE cells with an automated cell counter or manually with a hemocytometer.
- Resuspend the desired number of hOSE cells to 1 mL of ice-cold OSE organoid basic medium (Table 1) in a 1.5 mL tube.
- Centrifuge at 240 x g for 5 min.
- Resuspend the hOSE pellet in the desired amount of ice-cold undiluted basement membrane extract (BME) solution to obtain a cell concentration of 1 x 10⁴ cells/10 µL of BME.
- Pipette hOSE-BME solution up and down to ensure homogeneous distribution.
- Make 10 µL of droplets of hOSE-BME solution per well in the pre-warmed multi-well chambered slide.
NOTE: Make sure each droplet is at the center of the well to obtain a drop shape. - Place the plate with the droplets upside-down at 37 °C in a humidified incubator (5% CO2) for 15 min to allow gel solidification.
- Add 100 µL of OSE_3D medium (Table 1) and culture at 37 °C in a humidified incubator (5% CO2).
- Refresh the medium every 3-4 days.
NOTE: hOSE organoids continue to grow at least until 28 days in culture (Figure 3A, B), but passage every 14-28 days (grow rate is donor-dependent, fresh versus cryo hOSE) is advised to stimulate cell proliferation and organoid survival. Three independent hOSE organoid lines were passaged at least 4 times without signs of senescence. hOSE organoids show different morphologies (Figure 3C). - For passaging hOSE organoids:
- Remove the medium and add 100 µL of ice-cold advanced DMEM/F12 to each well.
- Scrape the bottom of the wells with a P1000 pipette tip to detach the gel droplets.
- Transfer each floating gel droplet to a 1.5 mL tube.
- Centrifuge the tubes with the gel droplets at 240 x g for 5 min.
- Remove the supernatant, resuspend the pellet in 300 µL of cell dissociation buffer, and place the tubes in a pre-warmed bead bath (or water bath) at 37 °C for 5-10 min.
NOTE: If some organoids remain intact, pipette up and down a couple of times with fetal bovine serum-coated, ice-cold pipet tip to mechanically disrupt them. Coating pipet tips with fetal bovine serum prevents the organoids from sticking to the tip. - Add 300 µL of hOSE organoid basic medium and centrifuge at 240 x g for 5 min.
- Resuspend the pellet in the desired amount of undiluted BME solution, re-seed them at a suitable ratio (distribute the content of 1 droplet into 1-4 droplets), and culture as aforementioned.
NOTE: The organoids are not dissociated into single cells, and hence, the cells cannot be accurately counted for further passage.
5. Whole-mount immunofluorescence of 3D hOSE organoids
NOTE: Whole-mount immunofluorescence can be performed in the same culture well (in de droplet) if using multi-well chambered slides suitable for microscopy techniques.
- Fix the hOSE organoids in the droplets in 4% paraformaldehyde (PFA) for 20 min at RT.
- Wash twice with PBS for 5 min at RT on a rotating/shaking platform.
- Permeabilize the hOSE organoids in the droplets using 100 µL of permeabilization buffer (Table 1) for 15 min at RT.
- Wash three times with 100 µL of blocking buffer (Table 1) for 15 min at RT and block overnight (o/n) at 4 °C on a rotating/shaking platform.
- Incubate with 100 µL of primary antibody mix diluted in blocking buffer at 4 °C o/n on a rotating/shaking platform.
NOTE: See Table of Materials for a list of primary antibodies used, the cell type marked, and the animal model used to validate expression12,19,20,21,22,23,24,25. - Bring the plate to RT and wash it three times with 100 µL of blocking buffer for 15 min at RT on a rotating/shaking platform.
- Incubate with 100 µL of secondary antibody mix diluted in blocking buffer for 2 h at RT on a rotating/shaking platform, but protected from light.
NOTE: See Table of Materials for a list of secondary antibodies used. To protect from light, either place the plate inside a dark box or cover it with aluminum foil. - Wash three times in 100 µL of PBS for 15 min at RT on a rotating/shaking platform.
- Store the plate at 4 °C covered in aluminum foil until imaging (Figure 4).
6. Quantification of hOSE organoid size
- Take 10x brightfield pictures (TIFF image) on a microscope.
- Download and install Fiji (https://imagej.net/software/fiji/)26.
- Measure hOSE organoids image area with ImageJ software Fiji:
- Load image TIFF files in Fiji.
- Create a threshold for the software to recognize the hOSE organoids (darker area) in the uploaded brightfield image by clicking on Image > Adjust > Threshold. Adjust the values below and above until most of the background is removed and individual organoids are kept.
- Open the ROI tool by clicking on Analyze > Tool > ROI.
- Select the Wand tool and click on the region with a hOSE organoid until seeing a yellow line surrounding the whole organoid perimeter. In the ROI panel, click Add and Measure to obtain the area value of that OSE organoid.
- Repeat step 6.3.4. for every hOSE organoid to be measured.
Results
2D hOSE culture
Freshly isolated hOSE cells were plated on a 12-well plate and cultured for 3 weeks. During this period, cells were passaged three times (Figure 2A). Primary hOSE cells in culture exhibited a cobblestone-like morphology up to passage 3 (P3) but thereafter began to show signs of senescence, in accordance with previous results reporting the limited period hOSE can be passaged27. Moreover, murine OSE has been shown to undergo epithelial-to-mesenchymal transition (EMT) in vitro, displaying fibroblast-like features such as rearrangement of the actin cytoskeleton and deposition of collagen I19. In agreement, ACTA2+CD44+ hOSE showed pronounced upregulation of COL1A1 between P2 and P3 (Figure 2B), suggesting that hOSE cells undergo EMT during culture.
TGF-β signaling is a major regulator of EMT28 able to induce EMT in various epithelial cell types29. Although TGF-β was not added to the OSE_2D media, the added FBS could contain detectable levels of this cytokine30,31. For this reason, we tested whether the addition of the TGF-β inhibitor type I receptor SB-431542 could prevent EMT, allowing prolonged 2D culture. Surprisingly, supplementation of the OSE_2D media with 10 µM of SB-43154232hampered cell proliferation (Figure 2C). We concluded that TGF-β signaling is essential for OSE proliferation, and further 2D culture experiments were performed without the inhibitor.
3D hOSE organoid culture
Based on published culture conditions to grow human OSE organoids12, we derived hOSE organoids embedded in droplets of BME and grown in OSE_3D medium (containing a standard concentration of 100 nM of estradiol) for up to 28 days. Within 7 days, many hOSE organoids derived from freshly isolated OSE cells were cystic with an average diameter of 130 mm (Figure 3A,B). These results were similar to those reported by Kopper and colleagues on the derivation of hOSE organoids from minced and enzymatically digested human ovarian tissue12. Interestingly, hOSE organoids derived from freshly isolated OSE cells grew larger (average diameter of 160 mm) than hOSE organoids from 2D-expanded OSE cells (average diameter of 100 mm) after 14 days in culture (Figure 3B), probably due to the propensity of the 2D-expanded OSE cells to decrease proliferation. Furthermore, while many 3D hOSE organoids consisted of a monolayer of flat epithelial cells (Figure 3C top left panel), some exhibited a cuboidal monolayer of cells (Figure 3C top right panel), others were multi-layered (Figure 3C bottom right panel) or formed a non-lumenized cell cluster (Figure 3C bottom left panel).
To test whether hOSE organoids could also be derived using OSE_2D medium, freshly isolated hOSE cells were embedded in droplets of BME and grown in OSE_2D media for 12 days. After 6 days, spindle-like cells were visible, suggesting that hOSE cells were undergoing EMT in the droplets. Importantly, no hOSE organoids were formed using OSE_2D medium (Figure 3D).
Cellular characteristics of the hOSE organoids
In the human adult ovary, keratin 8 (KRT8) specifically marks the OSE population (Figure 4A), and accordingly, hOSE organoids retained KRT8 expression, validating their cell identity (Figure 4B). In mouse OSE cells, the nuclear localization of Yes1-associated protein (YAP1) was specifically associated with OSE stem/progenitor cells capable of expanding and healing the wounded area after ovulation24,33. YAP showed nuclear localization in the majority of the cells in hOSE organoids independent of their size (Figure 4B). Other markers reported to be expressed in mouse OSE cells, such as CD4420 and LGR522 were also investigated. Interestingly, both CD44 and LGR5 were expressed in small hOSE organoids (<100 µm diameter), whereas in larger organoids, CD44 and LGR5 seemed downregulated (Figure 4B).
Next, we investigated whether hOSE organoids displayed the apical-basal polarity typically observed in BME-embedded organoids (apical-in)34. Basolateral protein integrin beta 1 (ITGB1) and apical protein podocalyxin (PODXL) were used to show the cell polarity in the hOSE organoids, confirming a clear apical-in polarity independent of the hOSE organoid size (Figure 4B).
The human OSE is known to express the mesenchymal marker N-cadherin (CDH2), whereas the expression of epithelial marker E-cadherin (CDH1) is limited to columnar OSE cells (Figure 4A)2. Interestingly, hOSE organoids derived in this work expressed mesenchymal markers CDH2 and vimentin (VIM), and large cystic hOSE organoids with cuboidal/columnar epithelia were both CDH1+ and CDH2+VIM+ (Figure 4C). It remains unclear whether CDH1+ hOSE organoids were derived from primary CDH1+ OSE cells or from CDH1- OSE cells that underwent epithelial differentiation or (neoplastic) transformation in vitro25,35.
Showcasing the use of hOSE organoids: effect of ovulatory cues on hOSE organoids
The hormones follicle-stimulating hormone and human chorionic gonadotropin can be used to induce follicular growth and ovulation, whereas, after ovulation, there is a marked increase in the concentration of ovarian-produced hormones, such as progesterone and estradiol36. To showcase the usability of hOSE organoids as a screening platform, we examined the effect of these hormones on hOSE organoids, using organoids' number and size as quantification output (using Fiji). For this, we derived hOSE organoids in OSE_3D media lacking estradiol (no hormone) and in OSE_3D media containing FSH, hCG, estradiol, or progesterone at different concentrations (Figure 5A).
The number of hOSE organoids derived from cryopreserved-thawed (non-expanded) hOSE cells from 3 different donors (n=3) was quantified per droplet after 7 days of culture (Figure 5A,B). The culture media was changed every 3 days. No significant differences were observed in the total number of hOSE organoids per droplet that formed in medium-containing hormones compared to medium without hormones (Figure 5A,B). To quantify the effect of the hormones on organoid size, after 14 days in culture, each droplet (from each condition) was imaged, and the area of the 4 largest hOSE organoids was measured using Fiji. Interestingly, generating hOSE organoids from two different donors (n = 2) in the presence of progesterone (1000 nM) or estradiol (200 nM) resulted in at least one very large organoid (about 700 µm diameter) per droplet (Figure 5C,D).

Figure 1: Schematic representation of hOSE cells isolation from whole ovaries. Ovaries were incubated in digestion solution for 30 min at 37 °C. hOSE cells were detached from the ovarian surface by gently scraping and subsequently cryopreserved, directly plated on 2D OSE culture in monolayer, or embedded in basement membrane extract (BME) for 3D hOSE organoid culture. Cryopreserved-thawed hOSE cells can be used for 2D culture or 3D organoid formation, and 2D-expanded hOSE cells can be used to generate 3D hOSE organoids. Please click here to view a larger version of this figure.
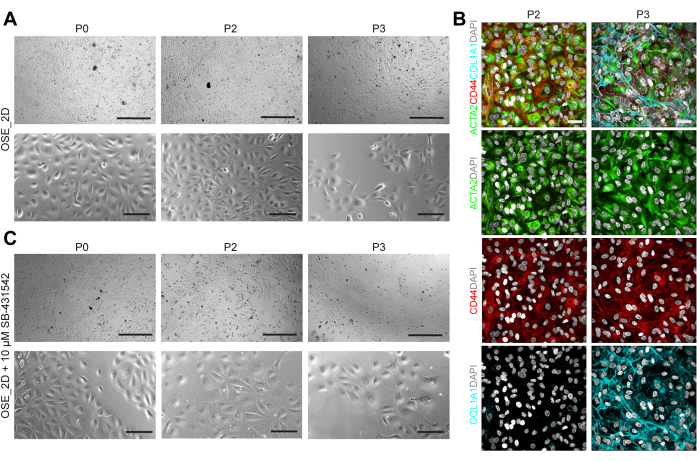
Figure 2: 2D primary culture of hOSE cells. (A) Brightfield images of hOSE cells at passages 0 (P0), 2 (P2), and 3 (P3) depicting typical epithelial cobblestone morphology. Scale bars are 750 µm on top panels and 125 µm on bottom panels. (B) Immunofluorescence for ACTA2, CD44, COL1A1 on 2D hOSE cells at P2 and P3. Scale bars are 50 µm. (C) Brightfield images of hOSE cells cultured with10 µM of SB-431542 at P0, P2, and P3. Cells showed signs of senescence from P2 and did not reach high confluency during culture. Scale bars are 750 µm on top panels and 125 µm on bottom panels. Please click here to view a larger version of this figure.

Figure 3: Morphological characterization of hOSE organoids. (A) Brightfield images of three independent hOSE organoid derivations from three different donors (tOVA86, tOVA87, tOVA88). Images were taken after cell embedding (D0), day 7 (D7), day 14 (D14), and day 28 (D28) of culture. Scale bars are 750 µm at D0 and 50 µm for the rest. (B) Diameter of hOSE organoids derived from freshly isolated hOSE cells (dashed line) and 2D-expanded hOSE cells (solid line). Depicted is average size ± standard deviation measured at D0, D7, and D14. Results from two different donors (tOVA88 and tOVA89) are shown. (C) Brightfield images of hOSE organoids showing different morphologies: single flat layer (top left), single columnar layer (top right), multilayered (bottom right), and non-lumenized cell aggregate (bottom left). Scale bars are 100 µm. (D) Brightfield images of hOSE cells embedded in BME and cultured for 12 days with OSE_2D media. Images were taken after cell embedding (D0), day 6 (D6), day 9 (D9), and day 12 (D12). Fibroblast-like cells overtook the culture, and no organoid-like structures were formed. Scale bars are 750 µm. Please click here to view a larger version of this figure.
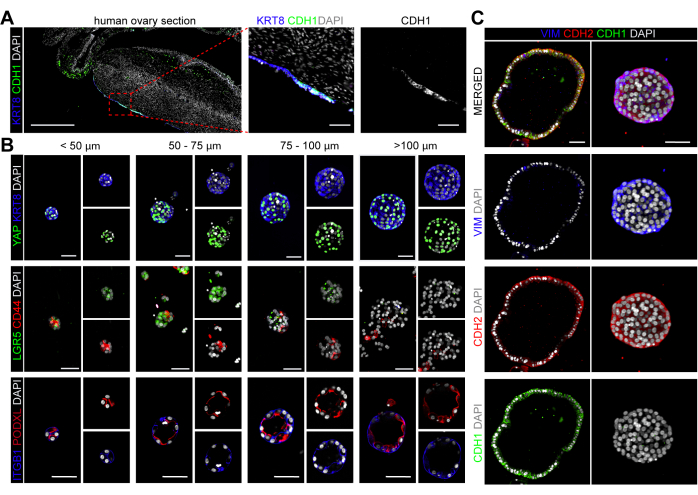
Figure 4: Cellular characterization of hOSE organoids. (A) Immunofluorescence for KRT8 and CDH1 in human ovarian section. Scale bar on the left panel is 500 µm, and the middle and right panels are 50 µm. (B) Immunofluorescence for KRT8 and YAP, LGR5 and CD44, and ITGB1 and PODXL in hOSE organoids of different sizes (<50 µm, 50-75 µm, 75-100 µm, >100 µm). Scale bars are 50 µm. (C) Immunofluorescence for VIM, CDH1, CDH2 in hOSE organoids. Scale bars are 50 µm. Please click here to view a larger version of this figure.

Figure 5: Effect of ovulatory cues on hOSE organoid formation. (A) Total number of hOSE organoids per droplet formed at day 7 in different culture media. The hOSE organoids were derived from three different donors (tOVA77, tOVA79, tOVA83). In bold is the OSE_3D medium used for organoid derivation. (B) Relative organoid formation compared to medium without hormones. Pooled values from hOSE organoids were derived from three different donors (tOVA77, tOVA79, tOVA83). (C) Graph depicting the image area of the 4 largest hOSE organoids at day 14 in each of the experimental conditions tested from two different donors (tOVA77, tOVA83). (D) Brightfield images showing hOSE organoids at day 14 culture with medium with no hormones, 200 nM E2, and 1000 nM P4 from two different donors (tOVA77, tOVA83). Scale bars are 750 µm. Please click here to view a larger version of this figure.
Table 1: Composition of working solutions used in the study. Please click here to download this Table.
Discussion
3D organoid technology is emerging as an indispensable tool for medical research. On the one hand, this in vitro platform offers the possibility to study fundamental mechanistic questions about tissue regeneration, wound healing, and development18. On the other hand, 3D organoids derived from patient samples allow personalized medicine studies, including diagnostics, drug testing, and cell therapy12,13,14,37,38. In the field of ovarian research, the hOSE has gained substantial interest since its implication as the origin of epithelial ovarian carcinomas39. Although it is thought that most high-grade serous ovarian carcinoma (HGSOC), one of the most common epithelial ovarian cancers, arises from the fallopian tubes40, current research on mice 3D ovarian organoids has proposed a potential dual origin of HGSOC from OSE and fallopian tube15,16.
Here, we described a protocol for the derivation of hOSE 3D organoids and outlined its application to bring novel mechanistic knowledge in ovarian tissue regeneration. This protocol includes a step-by-step method to isolate primary hOSE cells from human ovaries and generate 3D hOSE organoids. To ensure efficient hOSE organoid derivation, it is crucial to minimize ovarian manipulation. Due to its location on the ovarian surface and monolayer organization, the hOSE is prone to damage and loss during oophorectomy and organ manipulation. For this reason, we have favored an enzymatic and scraping method applied to the whole ovary to isolate hOSE2,8. In the present protocol, a mild enzymatic treatment was applied to disrupt the hOSE intercellular connections, followed by gentle scraping of the ovarian surface.
Comparing 2D with 3D hOSE culture, it is important to note that despite the initial high proliferation rate of hOSE cells in 2D culture, their cellular characteristics altered due to EMT, suggesting that the applied 2D culture conditions are not suitable to maintain an epithelial morphology. By contrast, 3D hOSE organoids could be passaged at least 4 times without signs of senescence. The OSE_3D organoid culture media used was based on that used by Kopper and colleagues for the derivation of OC and healthy hOSE organoids12 and by Kessler and colleagues for the derivation of human FT organoids17. The main difference was the replacement of human Wnt3a and R-Spondin-1 conditioned media by commercially available recombinant proteins to facilitate reproducibility.
Immunofluorescence techniques typically involve removing the tissue sample from the culture plate and processing it for paraffin- or cryo-sectioning. When working with very small structures, the risk of losing them during sample processing is high. In this protocol, the derivation of hOSE organoids takes place in cell culture plates that allow for direct microscopy imaging without the need to remove the hOSE organoids from the BME matrix. Furthermore, the whole-mount immunofluorescence method used here, described by Rezanejad and colleagues for pancreatic ductal organoids41, enabled in situ observation of protein localization within morphologically intact organoids. We demonstrated that, when performing this immunofluorescence protocol on hOSE organoids derived in multi-well chambered slides, there is highly efficient antibody penetration with a very low background signal.
Although most of the hOSE organoids derived using this method lacked CDH1 expression, some CDH1+ hOSE organoids formed, reaching larger sizes compared to CDH1- hOSE organoids. The expression of CDH1 has been associated with neoplastic hOSE phenotypes2,35. The ovaries used for hOSE isolation were donated by healthy transmasculine donors of reproductive age (27.1 ± 5 years old). These donors were under testosterone treatment for a period of 38 ± 15 months prior to oophorectomy. We cannot discard the possibility that the CDH1+ hOSE cells on the ovarian surface could be attributed to the testosterone treatment. Although androgen treatment has been linked to ovarian changes, such as anovulation42, hyperplasia of the cortical area43, and increased cortical stiffness44, the general ovarian pathology remains benign while using testosterone45.
In summary, this protocol highlights the potential of generating hOSE 3D organoids to decode mechanistic questions about ovarian tissue regeneration. Importantly, this method could also be applied for the detection of malignant cells present in ovarian biopsies from patients at risk of cancer development. Collectively, this method supports potential applications of this innovative in vitro platform for both fundamental ovarian function studies and clinical applications for individualized medical treatments.
Acknowledgements
We would like to thank all patients who donated tissue for this study, the members of the Chuva de Sousa Lopes group for useful discussions, and I. De Poorter for designing the cartoons used in Figure 1. This research was funded by the European Research Council, grant number ERC-CoG-2016- 725722 (OVOGROWTH) for J.S.D.V. and S.M.C.d.S.L.; and the Novo Nordisk Foundation (reNEW), grant number NNF21CC0073729 for J.S.D.V. and S.M.C.d.S.L.
Materials
| Name | Company | Catalog Number | Comments |
|---|---|---|---|
| 0.05% Trypsin/EDTA | Invitrogen | 25200-056 | |
| 12-well Culture Plate | Corning | 3336 | Sterile |
| 15 mL tubes | Greiner | 188271 | Sterile |
| 28cm Cell Scraper | Greiner Bio-One | 541070 | |
| 50 mL tubes | Greiner | 227261 | Sterile |
| 60 mm Petri dish | Greiner Bio-One | 628160 | |
| A83-01 | Stem Cell Technologies | 72024 | |
| Advanced DMEM/F12 | Gibco | 12634-010 | |
| B27 supplement (50x) | ThermoFisher Scientific | 17504-044 | |
| Bead bath | M714 | ||
| Bovine serum albumin (BSA) | Sigma Aldrich | 10735086001 | |
| Cell Dissociation Buffer | ThermoFisher Scientific | 13151014 | |
| Cryo-container "Mr. Frosty" | BD Falcom | 479-3200 | |
| DMEM Medium | ThermoFisher Scientific | 41966-029 | |
| Donkey anti-Goat IgG Alexa Fluor 647 | Invitrogen | A-21447 | |
| Donkey anti-Mouse IgG Alexa Fluor 488 | Invitrogen | A-21202 | |
| Donkey anti-Mouse IgG Alexa Fluor 647 | Invitrogen | A-31571 | |
| Donkey anti-Rabbit IgG Alexa Fluor 488 | Invitrogen | A-21206 | |
| Donkey anti-Rabbit IgG Alexa Fluor 594 | Invitrogen | A-21207 | |
| Donkey anti-Sheep IgG Alexa Flour 647 | Invitrogen | A-21448 | |
| Fetal Bovine Serum (FBS) | ThermoFisher Scientific | A4736401 | |
| Follicle Stimulating Hormone (FSH) | Sigma Aldrich | F4021 | |
| Forskolin | Peprotech | 6652995 | |
| Glutamax (100x) | Gibco | 35050-038 | |
| Goat anti-CDH2 (N/R-cadherin) | Santa Cruz | SC-1502 | Mesenchymal Cells; Wong et al 1999 (human)25 |
| Goat anti-PODXL (podocalyxin of GP135) | R&D Systems | AF1658 | Apical Polarity; Bryant et al 2014 (canine)21 |
| Goat anti-Rat IgG Alexa Fluor 555 | Invitrogen | A-21434 | |
| hEGF | R&D Systems | 263-EG | |
| HEPES | Gibco | 15630-056 | |
| Hydrocortisone | Sigma Aldrich | H0888 | |
| Insulin-Transferrin-Selenium-Ethanolamine (ITS-X; 100x) | ThermoFisher Scientific | 51500-056 | |
| Liberase DH Research Grade | Sigma Aldrich | A4736401 | |
| Luna-II cell counter | Logos Biosystems | L40001 | |
| Matrigel | Sigma Aldrich | 354277 | |
| McCoy’s 5A Medium | ThermoFisher Scientific | 26600-023 | |
| Mouse anti-ITGB1 (integrin beta 1) | Santa Cruz | SC-53711 | Basolateral Polarity; Bryant et al 2014 (canine)21 |
| Mouse anti-KRT8 (cytokeratin 8) | Santa Cruz | SC-101459 | OSE Cells; Kopper et al 2019 (human)12 |
| Mouse anti-VIM (vimentin) | Abcam | AB0809 | Mesenchymal Cells; Abedini et al 2020 (mouse)19 |
| Mycozap Plus-CL | Lonza | V2A-2011 | |
| N-Acetyl-L-cysteine | Sigma Aldrich | A9165 | |
| Nicotinamide | Sigma Aldrich | N0636-100G | |
| OVITRELLE-Choriogonadotropin alfa (hCG) | Merk | G03GA08 | |
| Progesterone (P4) | Sigma Aldrich | P8783 | |
| Rabbit anti-ACTA2 (alpha smooth muscle actin) | Abcam | AB5694 | Mesenchymal Cells; Abedini et al 2020 (mouse)19 |
| Rabbit anti-CDH1 (E-cadherin) | Cell Signaling | CST 3195S | Epithelial Cells; Wong et al 1999 (human)25 |
| Rabbit anti-LGR5 | Abcam | AB75850 | OSE Progenitor Cells; Flesken-Nikitin et al 2013 (mouse)22 |
| Rabbit anti-YAP | Cell Signaling | 14074S | Proliferative OSE; Wang et al 2022 (mouse)24 |
| Rat anti-CD44 PE-conjugated | eBioscience | 12-0441-81 | OSE Progenitor Cells; Bowen et al 2009 (human)20 |
| Recombinant Human Heregulinβ-1 | Peprotech | 100-03 | |
| Recombinant Human Noggin | Peprotech | 120-10C | |
| Recombinant Human Wnt3a | R&D Systems | 5036-WN-010 | |
| Recombinant Rspondin-1 | Peprotech | 120-38 | |
| Red blood cells lysis buffer | eBiosciences | 00-4333-57 | |
| Revitacell Supplement (100x) | ThermoFisher Scientific | A26445-01 | |
| RNAse free DNAse | Qiagen | 79254 | |
| SB-431542 | Tocris Bioscience | 1624/10 | |
| Sheep anti-COL1A1 (pro-collagen 1 alpha 1) | R&D Systems | AF6220 | Mesenchymal Cells; Hosper et al 2013 (human)23 |
| Y-27632 | StemCell Technologies | 72304 | |
| β-Estradiol (E2) | Sigma-Aldrich | E8875 | |
| μ-Slide 18-well culture plate | Ibidi | 8181 | Sterile |
References
- Ng, A., Barker, N. Ovary and fimbrial stem cells: biology, niche and cancer origins. Nat Rev Mol Cell Biol. 16 (10), 625-638 (2015).
- Auersperg, N., Wong, A. S., Choi, K. C., Kang, S. K., Leung, P. C. Ovarian surface epithelium: biology, endocrinology, and pathology. Endocr Rev. 22 (2), 255-288 (2001).
- Tan, O. L., Fleming, J. S. Proliferating cell nuclear antigen immunoreactivity in the ovarian surface epithelium of mice of varying ages and total lifetime ovulation number following ovulation. Biol Reprod. 71 (5), 1501-1507 (2004).
- Carter, L. E., et al. Transcriptional heterogeneity of stemness phenotypes in the ovarian epithelium. Commun Biol. 4 (1), 527(2021).
- Chumduri, C., Turco, M. Y. Organoids of the female reproductive tract. J Mol Med (Berl). 99 (4), 531-553 (2021).
- Edmondson, R. J., Monaghan, J. M., Davies, B. R. The human ovarian surface epithelium is an androgen responsive tissue. Br J Cancer. 86 (6), 879-885 (2002).
- Karlan, B. Y., Jones, J., Greenwald, M., Lagasse, L. D. Steroid hormone effects on the proliferation of human ovarian surface epithelium in vitro. Am J Obstet Gynecol. 173 (1), 97-104 (1995).
- Nakamura, M., Katabuchi, H., Ohba, T., Fukumatsu, Y., Okamura, H. Isolation, growth and characteristics of human ovarian surface epithelium. Virchows Arch. 424 (1), 59-67 (1994).
- Horvath, P., et al. Screening out irrelevant cell-based models of disease. Nat Rev Drug Discov. 15 (11), 751-769 (2016).
- Del Valle, J. S., Chuva de Sousa Lopes, S. M. Bioengineered 3D ovarian models as paramount technology for female health management and reproduction. Bioengineering (Basel). 10 (7), 832(2023).
- Clevers, H. Modeling development and disease with organoids. Cell. 165 (7), 1586-1597 (2016).
- Kopper, O., et al. An organoid platform for ovarian cancer captures intra- and interpatient heterogeneity. Nat Med. 25 (5), 838-849 (2019).
- Maenhoudt, N., et al. Developing organoids from ovarian cancer as experimental and preclinical models. Stem Cell Reports. 14 (4), 717-729 (2020).
- Senkowski, W., et al. A platform for efficient establishment and drug-response profiling of high-grade serous ovarian cancer organoids. Dev Cell. 58 (12), 1106-1121.e7 (2023).
- Lohmussaar, K., et al. Assessing the origin of high-grade serous ovarian cancer using CRISPR-modification of mouse organoids. Nat Commun. 11 (1), 2660(2020).
- Zhang, S., et al. Both fallopian tube and ovarian surface epithelium are cells-of-origin for high-grade serous ovarian carcinoma. Nat Commun. 10 (1), 5367(2019).
- Kessler, M., et al. The Notch and Wnt pathways regulate stemness and differentiation in human fallopian tube organoids. Nat Commun. 6, 8989(2015).
- Kim, J., Koo, B. K., Knoblich, J. A. Human organoids: model systems for human biology and medicine. Nat Rev Mol Cell Biol. 21 (10), 571-584 (2020).
- Abedini, A., Sayed, C., Carter, L. E., Boerboom, D., Vanderhyden, B. C. Non-canonical WNT5a regulates Epithelial-to-Mesenchymal Transition in the mouse ovarian surface epithelium. Sci Rep. 10 (1), 9695(2020).
- Bowen, N. J., et al. Gene expression profiling supports the hypothesis that human ovarian surface epithelia are multipotent and capable of serving as ovarian cancer-initiating cells. BMC Med Genomics. 2, 71(2009).
- Bryant, D. M., et al. A molecular switch for the orientation of epithelial cell polarization. Dev Cell. 31 (2), 171-187 (2014).
- Flesken-Nikitin, A., et al. Ovarian surface epithelium at the junction area contains a cancer-prone stem cell niche. Nature. 495 (7440), 241-245 (2013).
- Hosper, N. A., et al. Epithelial-to-mesenchymal transition in fibrosis: collagen type I expression is highly upregulated after EMT, but does not contribute to collagen deposition. Exp Cell Res. 319 (19), 3000-3009 (2013).
- Wang, J., et al. Selective YAP activation in Procr cells is essential for ovarian stem/progenitor expansion and epithelium repair. Elife. 11, e75449(2022).
- Wong, A. S., et al. Constitutive and conditional cadherin expression in cultured human ovarian surface epithelium: influence of family history of ovarian cancer. Int J Cancer. 81 (2), 180-188 (1999).
- Schindelin, J., et al. Fiji: an open-source platform for biological-image analysis. Nat Methods. 9 (7), 676-682 (2012).
- Shepherd, T. G., Theriault, B. L., Campbell, E. J., Nachtigal, M. W. Primary culture of ovarian surface epithelial cells and ascites-derived ovarian cancer cells from patients. Nat Protoc. 1 (6), 2643-2649 (2006).
- Xu, J., Lamouille, S., Derynck, R. TGF-beta-induced epithelial to mesenchymal transition. Cell Res. 19 (2), 156-172 (2009).
- Miettinen, P. J., Ebner, R., Lopez, A. R., Derynck, R. TGF-beta induced transdifferentiation of mammary epithelial cells to mesenchymal cells: involvement of type I receptors. J Cell Biol. 127 (6 Pt 2), 2021-2036 (1994).
- Danielpour, D., et al. Sandwich enzyme-linked immunosorbent assays (SELISAs) quantitate and distinguish two forms of transforming growth factor-beta (TGF-beta 1 and TGF-beta 2) in complex biological fluids. Growth Factors. 2 (1), 61-71 (1989).
- Oida, T., Weiner, H. L. Depletion of TGF-beta from fetal bovine serum. J Immunol Methods. 362 (1-2), 195-198 (2010).
- Halder, S. K., Beauchamp, R. D., Datta, P. K. A specific inhibitor of TGF-beta receptor kinase, SB-431542, as a potent antitumor agent for human cancers. Neoplasia. 7 (5), 509-521 (2005).
- Wang, J., Wang, D., Chu, K., Li, W., Zeng, Y. A. Procr-expressing progenitor cells are responsible for murine ovulatory rupture repair of ovarian surface epithelium. Nat Commun. 10 (1), 4966(2019).
- Kawata, M., et al. Polarity switching of ovarian cancer cell clusters via SRC family kinase is involved in the peritoneal dissemination. Cancer Sci. 113 (10), 3437-3448 (2022).
- Davies, B. R., Worsley, S. D., Ponder, B. A. Expression of E-cadherin, alpha-catenin and beta-catenin in normal ovarian surface epithelium and epithelial ovarian cancers. Histopathology. 32 (1), 69-80 (1998).
- Skory, R. M., Xu, Y., Shea, L. D., Woodruff, T. K. Engineering the ovarian cycle using in vitro follicle culture. Hum Reprod. 30 (6), 1386-1395 (2015).
- Boretto, M., et al. Patient-derived organoids from endometrial disease capture clinical heterogeneity and are amenable to drug screening. Nat Cell Biol. 21 (8), 1041-1051 (2019).
- Phan, N., et al. A simple high-throughput approach identifies actionable drug sensitivities in patient-derived tumor organoids. Commun Biol. 2, 78(2019).
- Ducie, J., et al. Molecular analysis of high-grade serous ovarian carcinoma with and without associated serous tubal intra-epithelial carcinoma. Nat Commun. 8 (1), 990(2017).
- Lee, Y., et al. A candidate precursor to serous carcinoma that originates in the distal fallopian tube. J Pathol. 211 (1), 26-35 (2007).
- Rezanejad, H., Lock, J. H., Sullivan, B. A., Bonner-Weir, S. Generation of pancreatic ductal organoids and whole-mount immunostaining of intact organoids. Curr Protoc Cell Biol. 83 (1), e82(2019).
- Asseler, J. D., et al. One-third of amenorrheic transmasculine people on testosterone ovulate. Cell Rep Med. 5 (3), 101440(2024).
- Ikeda, K., et al. Excessive androgen exposure in female-to-male transsexual persons of reproductive age induces hyperplasia of the ovarian cortex and stroma but not polycystic ovary morphology. Hum Reprod. 28 (2), 453-461 (2013).
- De Roo, C., et al. Texture profile analysis reveals a stiffer ovarian cortex after testosterone therapy: a pilot study. J Assist Reprod Genet. 36 (9), 1837-1843 (2019).
- Grimstad, F. W., et al. Ovarian histopathology in transmasculine persons on testosterone: A multicenter case series. J Sex Med. 17 (9), 1807-1818 (2020).
Reprints and Permissions
