This protocol describes an improved mouse model for adolescent bone growth plate injuries. Using transgenic mice with tri-lineage fluorescent reporters for collagen types I, II, and X, the primary matrices associated with three different substrata of the growth plate, injury placement is guided by native fluorescence under the microscope.
Method Article
Tricolor Transgenic Murine Model for Studying Growth Plate Injury
In This Article
Summary
Abstract
The cartilage growth plates in the bones of children enable limb lengthening but are weak relative to the bone, making them prone to fracturing when bones are overloaded. Better treatments for severely fractured growth plates are needed because the response to injury is a bony bridge that prematurely fuses the growth plate, leading to stunted and/or crooked limbs. Murine models of growth plate injury are advantageous for mechanistic studies, but are challenging because it is difficult to visualize and precisely injure the small growth plates in young mice. We describe here an improved growth plate injury model using transgenic mice with tri-lineage fluorescent reporters for collagen types I, II, and X.
These mice show native fluorescence associated with the three primary substrata of the growth plate. A growth plate injury similar to a Salter-Harris Type II injury is created reproducibly with a bur using the hypertrophic section of the growth plate as a reference during live imaging under fluorescence stereo microscopy guidance. Frozen histology analysis of the native fluorescence simplifies assessing the cellular response to injury. This methodology represents a substantial leap in growth plate injury research, providing a detailed and reproducible method for investigating pathology and evaluating new therapeutic strategies.
Introduction
Bone growth plates play a pivotal role in the longitudinal growth of long bones during childhood and adolescence1. Situated at the ends of long bones, the growth plate comprises multiple zones, with chondrocytes being the key cellular components responsible for producing and maintaining this dynamic growth area. Endochondral ossification of the growth plate occurs to lengthen and expand the bones through a sequential progression of chondrocyte proliferation, hypertrophy, apoptosis, invasion by blood vessels, recruitment of osteoprogenitor cells, and finally, bone formation2. Since the growth plate is relatively softer than bone, it is highly susceptible to fracture when bones are overloaded during sports or other activities. The Salter-Harris classification outlines five distinct types of growth plate injuries3. The Type II fracture through the hypertrophic zone of the growth plate and the adjacent lower bone tissue is the most prevalent4. A bony bridge often forms in response to injuries of the hypertrophic zone or the adjacent bone and leads to premature fusion of the adjacent long bone sections5. Bony bridges impede the normal expansion of the growth plate. Currently, no preventative treatments are available for the bony bridge formation, and some are left untreated depending on the patient's age and the bony bridge size and location6. When limb malformation is severe, surgical options include removal followed by implanting interpositional materials like fat or silicone rubber or corrective osteotomy and bone lengthening procedures; yet a bony bridge may still reform6. More research is needed to prevent bony bridge formation and to improve the outcomes of children with bone growth plate injuries.
Several animal models have been established to explore the underlying mechanisms and develop new strategies to prevent bony bridge impairment of growth plates post injury7,8,9,10,11,12. These animal models frequently focus on the proximal tibial growth plate and distal femur growth plate as the primary injury site, given this is typically where human injuries occur. The animal bone defects are created either by a lateral approach similar to an actual fracture pathway or an approach from above or below the growth plate leading to a central drill hole in the growth plate. In a previously reported rat model, a growth plate defect is created by inserting a dental bur through a cortical window in the tibial midshaft and drilling upwards through the marrow towards the knee joint to centrally injure the growth plate7,13. Alternatively, a recent mouse model uses a lateral approach with a small-bore needle to create a planar needle track through the growth plate8. In a widely used rat model, the defect is created in the growth plate of the distal femur by drilling through the articular cartilage between the condyles9,14. In larger animals like rabbits and sheep, growth plate defects have been both laterally induced directly in the proximal tibia and the distal femur by drilling or cutting into the growth plate or by approaching from below and creating a central defect leaving the edges of the growth plate unaltered10,11,12,15.
Murine models for growth plate injuries are advantageous for mechanistic studies that can be accomplished with genetically modified mice, such as stem cell lineage tracing studies8. However, a significant challenge in murine or rat animal models is achieving consistent and precise injury to a particular sub-region of the growth plate. Injury of particular zones of the growth plate and adjacent bone is required to mimic one of the clinically relevant fracture paths described by the Salter-Harris classifications. The challenges to date in rodent models are primarily due to the lack of a visual means of identifying the substrata of the growth plate during the surgical creation of the injury. This protocol describes a refined technique for creating growth plate defects in targeted substrata of the murine growth plate by utilizing triple transgenic mice that express collagen I, II, and X fluorescent reporters16,17,18. The different colored fluorescence of these collagens in each of the primary zones of the growth plate allows visual discrimination of the various sections of the growth plate under a fluorescence stereo microscope during the surgical creation of the growth plate injury. The use of these transgenic mice allows for unprecedented injury accuracy in a young mouse at a comparable developmental stage to the children that are injured.
Protocol
The research was performed in compliance with institutional guidelines. All animal procedures were approved by the University of Connecticut Health Center Institutional Animal Care and Use Committee (IACUC) prior to initiating the work. An outline of the protocol is described in the Figure 1 schematic.
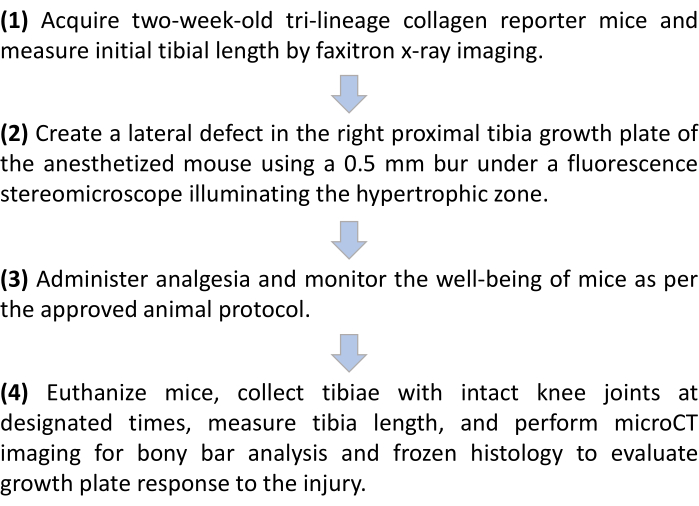
Figure 1: Outline of the growth plate injury protocol in tricolor collagen reporter mice. Please click here to view a larger version of this figure.
1. Mouse breeding and preparation for surgery
- Breed tricolor transgenic collagen reporter mice that express Col1a1-GFPTpz, Col2a1-CFP, and Col10a1-mCherry16,17,18,19,20,21 per standard breeding procedures to obtain eight pups for surgery that are 2 weeks old (± 1 day). Verify the triple transgene expression by genotyping a tail tip fragment under a fluorescence microscope. Only use the mice that are positive for all three colors to maximize the benefit of the reporter system during subsequent histological analysis.
NOTE: This age of 2 weeks old (± 1 day) is selected because their bone growth plates are at a similar stage of development to the human adolescent22. This protocol applies to both sexes of mice. - On the day of surgery or one day before, uniquely identify each mouse used for surgery using an ear punch after disinfecting the ear and ear punch with alcohol antiseptic pads, weigh each mouse, and record the value.
- Shave the entire right hind limb from the hip to the foot with an electric clipper while the mouse is under the effect of isoflurane anesthesia. To induce anesthesia in mice, use a mixture of isoflurane (2-3%) and 100% oxygen, administered at a flow rate of 1 L/min within a 1-2 L induction chamber. Remove the mouse and confirm that the anesthesia depth is sufficient with a toe pinch that should not cause the mouse to move.
NOTE: This depth of anesthesia will last sufficiently long to conduct the shaving without requiring an anesthesia nose cone. - Employ X-ray imaging with a power setting of 26 kV (800 mA) to capture tibial images in live mice under isoflurane-induced anesthesia to record initial limb length.
- Prior to placing the mice in the X-ray cabinet, induce a deep state of anesthesia using a mixture of isoflurane (2-3%) and 100% oxygen, administered at a flow rate of 1 L/min within a 1-2 L induction chamber.
- Place three anesthetized mice at a time in parallel on their abdomens in the X-ray cabinet at a shelf height that allows for one image to be obtained that includes all three mice. Splay the legs so the tibial bones are not obscured under the mouse. For enhanced measurement accuracy, position a radiopaque scale near the mouse during imaging (Figure 2A).
- Return the prepared mice to their housing cage with the dam to await subsequent surgical procedures.
2. Preparation of surgical supplies and sterile work area
- Autoclave the following items: 10-20 gauze pads, cotton-tipped applicator swabs, dental burs (0.5 mm diameter), dental handpieces, Graefe forceps, curved mosquito hemostatic forceps, curved fine scissors, needle holders, periodontal probes, and dental cleoid discoid carvers.
- Collect additional necessary sterile supplies: an injectable suspension of buprenorphine, 20 G needles, 1 mL syringes, towel drapes, 5-0 undyed, braided, coated, vicryl sutures, povidone-iodine, phosphate-buffered saline, alcohol antiseptic pads, #15 scalpels, surgical gloves, environmental surface barrier tube sox, eye lubricant, 70% ethanol spray. Power on a glass bead sterilizer for additional sterilization of items during surgery and the electric heating pad under a clean mouse cage with sterilized bedding.
- Clean and sterilize the fluorescence stereomicroscope stage, adjacent surfaces, and the surgical instrument stand using 70% ethanol. Cover these areas that will become the surgical workspace with sterile towel drapes.
- Assemble the electronic high-speed dental drilling system. Connect the electronic foot controller to the control unit and cover the handpiece cord with a disinfected surface barrier tube sox. Attach the sterile 0.5 mm round dental bur. Turn on the controller and set it at a drive ratio of 1:1 and a max of 30,000 rpm.
- Secure, with tape, the flexible isoflurane machine hose that terminates with the nose cone covered with a disinfected surface barrier tube sox on the fluorescence stereomicroscope stage.
- Power on the fluorescence stereomicroscope and ancillary equipment and open the image acquisition software.
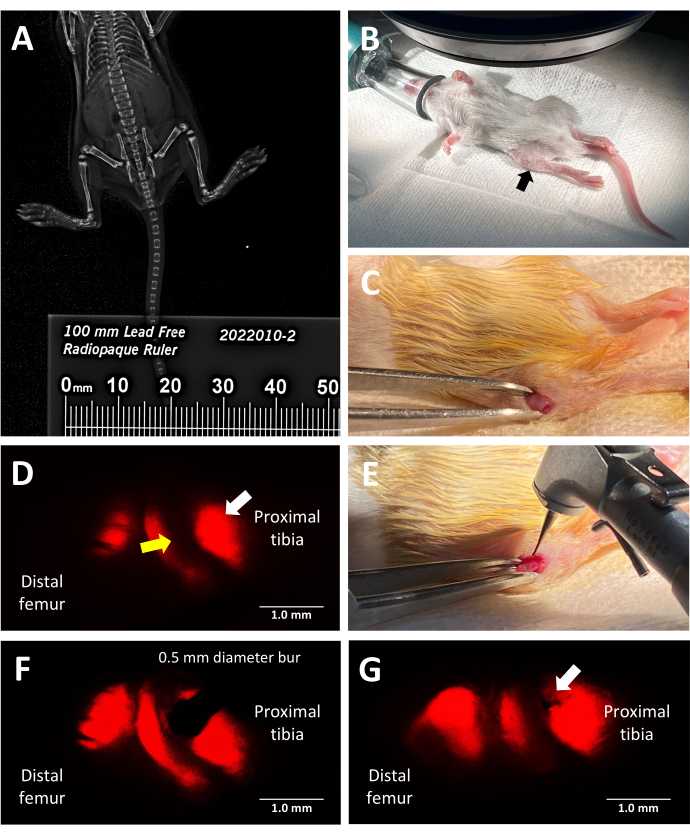
Figure 2: Key steps of the trilineage fluorescent reporter murine growth plate injury procedure. (A) Measuring tibial length by faxitron X-ray imaging using a radiopaque ruler placed alongside the mice in the X-ray cabinet. (B) Proper position of an anesthetized mouse for surgery under a fluorescence stereomicroscope. Proximal tibia indicated by a black arrow. (C) An example of an incision made to access the growth plate. (D) Fluorescence stereo microscopy illuminating the hypertrophic zone of the growth plate (white arrow). The adjacent proliferative zone is indicated by a yellow arrow. (E) Bright light illumination of the surgeon placing the 0.5 mm dental bur against the growth plate. (F) Precise placement of the dental bur is guided by fluorescence stereo microscopy into the hypertrophic zone. (G) An example of a Salter-Harris Type II-like growth plate defect (white arrow). Scale bars = 1 mm. Please click here to view a larger version of this figure.
3. Proximal tibia growth plate injury procedure
- Anesthetize the mouse in the isoflurane anesthesia chamber, adjusting the isoflurane concentration to 2-3% and oxygen flow rate to 1 L/min. Await the induction of a deep anesthetic state, verified by a toe pinch test and the observation of respiratory patterns.
- Administer half the prescribed dose of buprenorphine subcutaneously immediately following removal of the mouse from the chamber. The dosing of extended release buprenorphine is 3.25 mg/kg per mouse.
- Apply ocular lubricant to protect the mouse's eyes from drying out during surgery and transfer the mouse in a supine position to the isoflurane machine nose cone on the stereomicroscope stage (Figure 2B). Adjust the anesthesia flow through the nose cone to 2% and the oxygen flow rate to 1 L/min.
- Disinfect the right hind limb, pelvic region, anterior aspect of the left hind limb, and tail sequentially with povidone-iodine followed by 70% ethanol to ensure sterility during surgical procedures and minimize the risk of contamination or infection at the surgical site or from handling the animal during the procedure.
- Verify a continued stable depth of anesthesia through an additional toe pinch test and observation of respiratory patterns before surgery commencement.
- Under bright light illumination, employ a #15 scalpel to create an incision in the skin just below the knee joint with an initial length of approximately 5 mm, to reveal the proximal end of the right tibia (Figure 2C). Use scissors to extend the cut if necessary. Keep the left contralateral tibia uninjured so that it serves as an internal uninjured control.
- Perform a vertical blunt dissection through the overlying muscle at the proximal tibia using the back side of the #15 scalpel, removing the soft tissue for clear exposure of the growth plate.
- Turn off the operating room lights and select the correct fluorescence channel to illuminate the desired region of the growth plate. Filter sets required to image each of the fluorescent collagen are Col 2 Cyan: ET436/20x (excitation), ET480/40 m (emission), Col 10 mCherry: ET577/20x (excitation), ET640/40 m (emission), Col 1 Topaz: ET500/20x (excitation), ET535/30 m (emission). Position the mouse to observe the proximal tibial growth plate (Figure 2D). Adjust the skin opening slightly more proximal and then, distal to ensure the tibial growth plate is in view and not the femur growth plate.
- Create a Salter-Harris Type II-like lesion while looking through the microscope eyepiece by positioning the 0.5 mm dental drill bur parallel to the tibial axis in the middle of the hypertrophic growth plate zone, employing a lateral approach (Figure 2E,F). To reproducibly make a defect that mimics a Salter-Harris Type II lesion, keep the limb parallel to the work surface so that the bur entry pathway will not angle into the epiphysis. Apply pressure on the drill pedal to initiate bur rotation and gently depress the bur into the growth plate stopping before the defect goes any deeper than the bur diameter (Figure 2G).
NOTE: A second pair of hands assisting in stabilizing the mouse limb is helpful. - Irrigate the lesion site with a drop of sterile PBS to remove any debris.
- Confirm the defect's depth at 0.5 mm using a periodontal probe.
4. Post injury procedures and closure
- For time zero defect characterization, harvest the injured hind limb and control limb prior to tissue closure. Follow the tissue harvesting and preparation for subsequent microcomputed tomography (microCT) and cryo-histology imaging in section 6.
NOTE: For experiments involving the implantation of a therapeutic substance in the growth plate defect, the defect itself can only accommodate a piece of biomaterial that is roughly spherical and 0.5 mm in diameter or 0.082 mm3 (0.082 µL) in volume. - Utilize forceps under microscopic visualization to insert the biomaterial or inject a liquid therapeutic into the defect within the growth plate. Use a larger volume of biomaterial or injected substance if the study design does not require the therapeutic to be limited to only the defect.
- Carefully realign the skin edges, ensuring the implanted material, if any, remains securely within the defect site.
- Employ interrupted suturing techniques with 5-0 polyglycolic acid sutures to seal the skin incision effectively.
- Thoroughly cleanse the areas beyond the surgical region of povidone-iodine residue using swabs with sterile water, applying care to avoid contact with the wound and closely surrounding areas.
- Remove the mouse from the isoflurane nose cone on the microscope stage to a recovery cage, positioning it laterally on fresh bedding over a heating pad.
- Closely observe the mouse's respiratory rate for approximately 5 min, administering the remaining buprenorphine dose for analgesia just as the isoflurane anesthesia's effects diminish, indicated by an increase in respiratory rate, but before the onset of mobility. Maintain the mouse in an isolated recovery cage until it demonstrates full ambulatory capabilities, thereafter, reuniting it with its mother and siblings.
- Conduct daily inspections for the initial 48 h post operation, followed by weekly assessments up to the point of euthanasia. Focus on signs of infection, locomotion efficacy, accessibility to food, and the integrity of sutures.
- Wean the mice at the standard time (i.e., 3 weeks of age).
5. Limb length measurements
- Based on the time points determined by the experimental hypothesis and design, anesthetize the mice with isoflurane and conduct X-ray imaging of the full length of both the injured and uninjured tibiae as shown in Figure 2A and described in section 1.4. Suitable landmarks for making consistent limb length measurements include the top of the tibial epiphysis and the distal end of the tibia at the tibiotalar joint as shown in Figure 3.
NOTE: Imaging is used to assess limb length and limb length discrepancies due to the injury, as well as the development of the bony bridge within the growth plate tissues at specific post-operative intervals.
6. Tissue dissection, fixation, microCT imaging, and embedding
- Euthanize the mouse via CO2 asphyxiation preferably using an automated CO2 induction system with a confirmation of death by an alternate method such as cervical dislocation.
- Isolate both intact hind limbs and remove skin and muscle from the bone and knee capsular area in preparation for histological and microCT analysis.
- Before putting the hind limbs into the fixative, excise the patella carefully by cutting it off using micro-dissecting scissors to facilitate fixative penetration into the knee cavity. Employ a 29 G insulin syringe to thoroughly distribute cold 10% buffered formalin within all areas of the knee cavity. Sever the diaphyseal region of the femur and tibia to improve fixative access to the marrow space. Maintain the joint tissue in a fully extended position within the fixative for 24-36 h at 4 °C by tying it with gauze to a thin dowel.
CAUTION: Formalin is toxic and should be handled in a fume hood while wearing appropriate personal protective equipment.
- Before putting the hind limbs into the fixative, excise the patella carefully by cutting it off using micro-dissecting scissors to facilitate fixative penetration into the knee cavity. Employ a 29 G insulin syringe to thoroughly distribute cold 10% buffered formalin within all areas of the knee cavity. Sever the diaphyseal region of the femur and tibia to improve fixative access to the marrow space. Maintain the joint tissue in a fully extended position within the fixative for 24-36 h at 4 °C by tying it with gauze to a thin dowel.
- After 24-48 h of formalin fixation at 4 °C, conduct high-resolution X-ray microCT of contralateral and injured samples by microCT imaging after transferring samples to PBS, for assessment of bony bridge development. Use a voxel size of 6.0 µm, sample times of 330,000 ms, and energy settings of 55,000 V with an intensity of 145 µA.
- After microCT imaging and an additional 24 h of formalin fixation at 4 °C, rinse the samples in 1X PBS for 3 x 5 min and then, immerse samples in 10% sucrose in 1X PBS for 1 h, 20% sucrose in 1X PBS for 1 h, and 30% sucrose in 1X PBS overnight. Use a 29 G insulin syringe filled with sucrose solution to ensure the sucrose solution permeates all knee cavity regions. Transfer to a -80 °C freezer if not embedding after the overnight sucrose immersion to ensure retention of the GFP reporter and tissue enzymatic activity.
- Remove any residual muscle tissue from the joint region before embedding. Equilibrate the sample with a cryo-embedding medium overnight, facilitating medium penetration into the knee cavity.
- View the microCT images to determine where the defect and bony bridge are located prior to embedding. Apply a thin layer of the cryo-embedding medium into a cryomold and place the dissected and still connected tibia/femur/joint such that the region of interest faces 90° to the surface of the embedding medium.
NOTE: This orientation allows the sectioning to capture the lateral view of the laterally created defect. If the bony bridge is near the edge of the defect, then this orientation will also avoid the possibility of missing the region of interest during the first thicker sections taken through the tissue. - Position the cryomold on dry ice until the cryo-embedding medium solidifies, securing the specimen. Continue to fill the cryomold with the medium while keeping it on dry ice.
- After securing the specimen, immerse the cryomold in 2-methyl-butane chilled with dry ice until fully frozen. Post freezing, remove excess 2-methyl-butane, wrap the cryomolds in cellophane, and store at -20 °C or -80 °C.
NOTE: For prolonged storage beyond 1-2 months in a cryo-embedding medium, -80 °C is recommended to prevent drying out. Tape-assisted cryosectioning and adhesion of the sections to the glass slides are described previously23.
7. Sequential imaging, staining, and reimaging
- Implement a sequential procedure of imaging, staining, and reimaging to facilitate the detection and colocalization of multiple biological signals within the same tissue section as described previously23. Specifically for the growth plate sections from the tricolor collagen reporter mice, the following steps are recommended. This ordered approach ensures comprehensive visualization of both molecular signals and structural details.
- Initially, capture endogenous fluorescent signals for the three collagens in the first round of imaging.
- Apply calcein blue staining and image for mineralized tissue23, followed by the tartrate-resistant acid phosphatase (TRAP) enzymatic activity staining and imaging23.
NOTE: While the TRAP enzymatic activity staining results are not displayed here, this staining step is performed as it is essential for the removal of mineral before the Safranin O/Fast Green staining results presented in the representative results section. - Conduct 4',6-diamidino-2-phenylindole (DAPI) nuclear staining as described below and then image.
- Place slides that have undergone prior imaging into a Coplin jar containing 1x PBS. Leave them submerged until the coverslips detach from the slides. Once detached, remove and thoroughly dry the coverslips.
- Apply DAPI counterstaining solution to the coverslips, utilizing a 1:1,000 dilution of DAPI in a mixture of 50% glycerol and 1x PBS. Proceed with the imaging process post application.
- Conclude with the application of Safranin O/Fast Green stain to accentuate tissue architecture and then image.
NOTE: Perform this as the concluding step to correlate chromogenic images with fluorescent signals.- Prepare Weigert's Iron Hematoxylin solutions. Prepare Solution A by dissolving 1 g of hematoxylin in 100 mL of 95% ethanol and Solution B by combining 4 mL of 29% Ferric chloride solution, 95 mL of deionized water, and 1 mL of concentrated HCl. Mix equal parts of Solution A and B to create Weigert's working hematoxylin solution, stable for approximately 4 weeks.
- Submerge slides in deionized water for 2 x 2 min to hydrate.
- Apply Weigert's working hematoxylin solution for 5 min.
- Wash slides in tap water for 5 min, then briefly in deionized water for 1 min.
- Stain with 0.2% Fast Green solution (0.2 g of Fast Green FCF in 100 mL of deionized water) for 2 min.
- Briefly rinse in 1% acetic acid for 1 min.
- Stain with 0.1% Safranin O solution (0.1 g of Safranin O in 100 mL of deionized water) for 1 min.
- Rinse in deionized water until achieving a visually balanced color, approximately 5 min.
- Mount slides in 30% glycerol in deionized water (avoid PBS) and proceed to imaging immediately to prevent color diffusion from the tissue. To accentuate the resting zone cells of the growth plate conduct image with a Cy5 filter: ET640/30x (EX), ET690/50 m (EM).
Results
This protocol utilizes trilineage fluorescent reporter mice to induce a lateral growth plate defect in the proximal tibia with precision by leveraging the inherent red fluorescence emitted by type X collagen for surgical guidance. The view the surgeon has while looking through the stereomicroscope eyepiece with the mCherry filter set is shown in Figure 2D. The native Type X fluorescence allows the surgeon to place the bur in the hypertrophic zone and create an injury that mimics a common type of growth plate injury leading to a bony bridge (Figure 2F). The fluorescence under the red channel is the brightest and, therefore, recommended for use during bur placement. Alternatively, defect creation could be guided by using other colors of the native fluorescence of the triple transgenic mice if the goal of the experiment is to study injuries to other zones of the growth plate than the hypertrophic zone and adjacent calcified region.
The creation of a Salter-Harris Type II-like defect in the hypertrophic zone of the growth plate and the adjacent lower bone tissue, using a 0.5 mm diameter dental bur, was validated through microCT and cryo-histology imaging of the injured (time 0) proximal tibias compared to the uninjured lateral controls in N = 3 mice (Figure 4). The defects were difficult to see in the 3D microCT images but were detectable in the 2-D cross sections (Figure 3A,B,E,F). Figure 3G displays the distribution of type I collagen-producing bone cells (green fluorescence), type II collagen-producing proliferative chondrocytes (cyan fluorescence), and type X collagen-producing hypertrophic chondrocytes. In the image of the injured mouse (Figure 4G), there is a disruption of the hypertrophic zone, the provisionally calcified layer, and some of the newest formed bone relative to the control with the proliferative zone only slightly disturbed. Safranin O/Fast Green staining (Figure 4H) best illustrates the location of the defect within the injured growth plate since all cells are clearly visible.
X-ray analysis provides some insight into live mice as to the impact of this type of growth plate injury on tibia length and bony bridge formation over time (Figure 3). Comparative imaging between uninjured (Figure 3A) and injured (Figure 3B) tibiae, taken before surgery and 3 weeks post surgery, reveals a large amount of limb growth, thinning of the growth plates, and a distinct opaque region that has developed in the injured growth plate area at 3 weeks. This opacity within the growth plate is not present in the uninjured counterpart nor the mice before surgery. Faxitron is thus one way of observing pathological changes induced by the injury in live mice, such as the formation of a bony bridge and changes in limb length.
MicroCT imaging of dissected bones offers a detailed visualization of bony bridge formation within the injured growth plates three weeks after surgery (Figure 5). As seen in the images from six different injured mice shown in Figure 5, there is consistent bony bridge development in all mice. Utilizing Scanco Medical software, the bony bridge volume was calculated by reviewing each section of the proximal tibial growth plate, delineating the area of the bony bridge (Figure 5B) with the select tool, and then, integrating each section area throughout the entire growth plate volume to get the total volume24. The bony bridge volume calculated this way was 0.0761 mm3 ± 0.0246 (mean ± standard deviation, N = 6). The majority of the bony bridges form near the middle of the growth plate despite the lateral approach, which injures the outer edge as well as the center of the growth plate. This phenomenon can be attributed to the fact that mesenchymal stem cells (MSCs) from the bone marrow, rather than the perichondrium, are responsible for bony bridge formation25.
In these tricolor transgenic mice, cryo-histological analysis of the injured growth plate is enriched by the native collagen fluorescence (Figure 6). It reveals the complex interplay of bone cells and chondrocytes at the injury site. MicroCT images shown in Figure 6J,K were provided to the histology technician to guide the embedding and sectioning. The type I collagen-producing bone cells are seen in Figure 6L,O,P (green fluorescence), while type II collagen-producing proliferative chondrocytes are seen in Figure 6L,O,Q (cyan fluorescence). Type X collagen-producing hypertrophic chondrocytes are seen in Figure 6L,O,R (red fluorescence). This multicolor fluorescence approach enables a detailed examination of postsurgery chondrocyte differentiation within the bony bridge area against a backdrop of mineralized tissue. DAPI staining was used to confirm the distribution of all cell types within the growth plate area (Figure 6M). The Safranin O/Fast Green staining demonstrates the composite and structural organization of cartilage and bone within the injured growth plate (Figure 6N). Imaging these stained sections under a Cy5 filter set notably brightens the resting zone cells at the interface between the epiphyseal bone and cartilage.
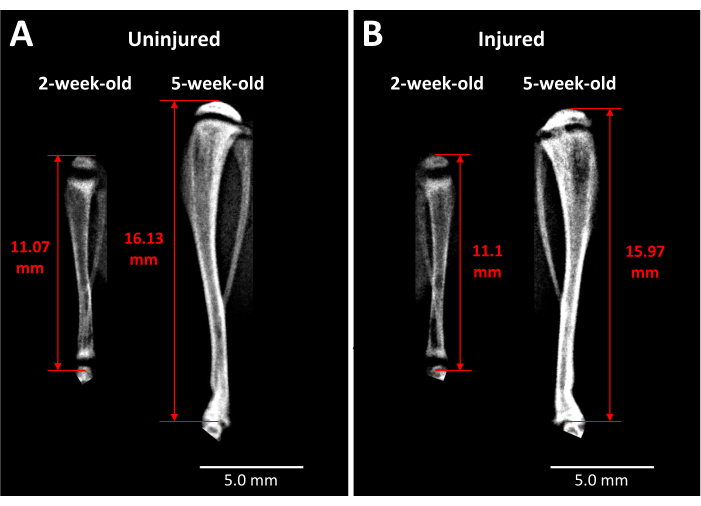
Figure 3: X-ray images of contralateral control and injured mouse tibiae. (A) X-ray images of the contralateral control tibia are taken just before injury when mice are 2 weeks old and at 3 weeks after surgery when the mice are 5 weeks old, demonstrating the extent of growth that occurs during this period. (B) Injured tibia from the same mouse at the same time points as in (A). The landmarks used for tibia length measurements are the apex of the proximal tibia head to the end of the tibia at the ankle joint (red double-headed arrows). The opaque bony bridge is visible in the injured proximal tibia growth plate at 5 weeks. Scale bars = 5.00 mm. Please click here to view a larger version of this figure.
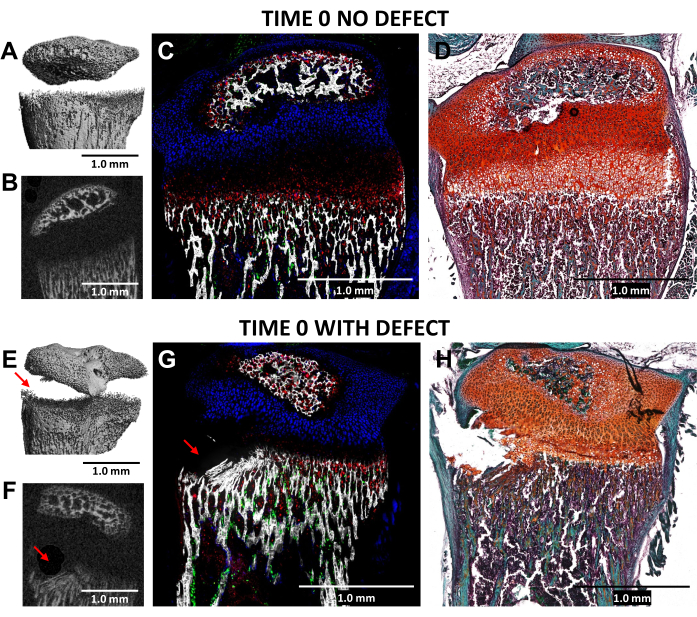
Figure 4: MicroCT and histological images of time zero contralateral control and injured mouse proximal tibiae. (A,E) and (B,F) depict 3D and transverse 2D microCT views, with the defect indicated by red arrows in (E) and (F). (C,G) Composite merged cryo-histological images merging three innate fluorescence layers with a mineralized tissue layer. Green cells (Col3.6GFPtpz) are the type I collagen-producing bone cells, cyan blue colored cells (Col2A1GFPcyan) are type II collagen-producing proliferative chondrocytes, and red cells (Col10A1RFPchry) are type X collagen-producing hypertrophic chondrocytes. (D,H) Safranin O/Fast Green staining of the same region as (C) and (G). Scale bars = 1.0 mm. Please click here to view a larger version of this figure.

Figure 5: MicroCT images of bony bridges formed by this protocol. (A,C,E,G,I,K) Transverse cross-sections of the proximal tibial growth plate of six different mice at 3 weeks after bur defect creation. Bony bridge outlined by a red dotted line in (A). (B,D,F,H,J,L) 3D reconstructions with a longitudinal plane cut away. Bony bridge outlined by a red dotted line in (B). Scale bars = 1.0 mm. Please click here to view a larger version of this figure.

Figure 6: MicroCT and histological images of contralateral control and injured mouse proximal tibia with bony bridge formation. (A,J) and (B,K) depict 3D and transverse 2D microCT views, with the bony bridge indicated by yellow arrows in (J) and (K). (C,L) Composite merged cryo-histological images merging three innate fluorescence layers with a mineralized tissue layer. Green cells (Col3.6GFPtpz) are the type I collagen-producing bone cells, cyan blue colored cells (Col2A1GFPcyan) are type II collagen-producing proliferative chondrocytes, and red cells (Col10A1RFPchry) are type X collagen-producing hypertrophic chondrocytes. The white box indicates the higher magnification shown in panels F and O. (D,M) The mineralized tissue and DAPI staining in the growth plate area of panels C and L. (E,N) Safranin O/Fast Green staining of the same region as (D) and (M) scanned with cy5 fluorescence. (F,O) A higher magnification of the growth plate area in the merged image of panels C and L. (G-I,P-R) Individual channels of the native fluorescence shown with a mineralized tissue backdrop. Scale bars = 1.0 mm (A-E) and (J-N), = 250 µm in (F-I) and (O-R). Please click here to view a larger version of this figure.
Discussion
The innovative use of tricolor collagen reporter mice enables the creation of growth plate defects with a predetermined size and location, significantly enhancing the accuracy of murine experimental models for growth plate injuries. Given the small size of the 2-week-old mice, it is critical to use a small 0.5 mm bur to create the injury to avoid weakening the limb and causing a full-thickness fracture. The surgeon must also apply just enough pressure when creating the defect to avoid drilling too deeply into the bone for the same reason. The use of the perioprobe is critical to confirming a consistent injury depth.
As with any surgery, it is important to confirm an adequate depth of anesthesia, confirmed by an occasional toe pinch and sterility is maintained throughout. Another surgical point of importance is that blunt dissection with a carver has been described because it avoids damaging soft tissue and helps to ensure the mice are able to ambulate immediately after recovery from anesthesia to reach the mother mouse for nutrition and comfort. In our experience, the wounds closed with sutures have remained successfully closed and wound clips are not required. Surgery on mice at 2 weeks of age is recommended to best mimic the young child that experiences growth plate fractures. One downside of this protocol is that given the unpredictable nature of birthing, the use of this mouse model requires the availability of the surgeon at short notice.
Regarding the positioning of the bur to create the defect, the protocol describes creating the injury using a mCherry/Texas red filter set that illuminates the hypertrophic zone within the growth plate because of the brightness of the collagen X fluorescence. To ensure the injury is created within the tibial growth plate, it is beneficial to slightly move the soft tissue opening to the left and right to confirm that the proximal tibial growth plate is in view, and not the femur. Switching between filter set channels to illuminate the proliferative chondrocyte zone or the adjacent bone sections is useful for confirming accurate placement relative to the location of the proliferative zone and adjacent bone sections.
While the proliferative chondrocyte zone and the epiphyseal and metaphyseal bone can be distinguished under fluorescence microscopy in the live mice, the real value of the Type II and Type I collagen reporters are realized during the histological analysis of the growth plate. Given the aqueous nature of cryo-histological processes, traditional chromogenic dye precipitation protocols are unsuitable due to the potential misalignment of color with fluorescent imaging caused by dehydration steps. Although the aqueous protocol yields staining patterns similar to those in paraffin sections, rapid post staining imaging is essential to prevent dye diffusion from the tissue. Utilizing 30% glycerol in distilled water as the mounting medium can decelerate this diffusion, allowing for multiple chromogenic staining on the same section, including cartilage with Safranin O/Fast Green.
The endochondral ossification process is clearly visible with red chondrocytes lining the evolving bony bridge (Figure 6). Additional use of immunohistochemistry techniques, for which there are many murine antibodies available, could further enhance mechanistic studies conducted in these transgenic mice. Altogether, the combination of faxitron, microCT, and cryo-histological imaging techniques in this transgenic mouse model offers a comprehensive understanding of macroscopic and microscopic changes that occur in response to growth plate injuries, paving the way for future therapeutic interventions to mitigate such adverse outcomes. Further genetic manipulations of these transgenic mice could be done to allow lineage tracing studies to understand the origin of the cells that are temporally and spatially involved in healing. Experimentation on mice with additional modifications would allow the study of cartilage diseases such as osteochondroma - an overgrowth of cartilage and bone near the growth plate.
The consistency of our model is demonstrated by the reproducible formation of bony bridges in all mice without needing to discard any mice from the group due to articular cartilage injury. This is an improvement over previous models that approached the growth plate from a cortical window below the growth plate and angled a sharp tool or bur upwards towards the growth plate and occasionally would overshoot into the articular cartilage. An additional injury of the articular cartilage does not mimic the commonly occurring growth plate injuries in children. The more precise injury of this animal model reduces the number of mice required per experiment and that is another improvement. The use of transgenic mice allows the researcher to focus the injury on sub-sections of the growth plate, such as the hypertrophic/provisionally calcified area or the epiphysis/resting zone/proliferative zone area, without affecting the articular cartilage. However, a limitation of this model is the variability in bony bridge volume, which can differ by up to 30% among injured animals. Consequently, detecting a clinically significant effect on bony bridge formation still necessitates a large number of animals to achieve statistical relevance.
Benefits to a mouse model as described here as compared to rat or rabbit growth plate injury models previously published7,9,10,14, include a lower number of animals used, cost reduction, an efficient replicate size due to reproducible bony bar formation, a shorter study time frame, and more precise injury placement due to live imaging of the triple transgenic mice. While not discussed in detail, this mouse model can be used to test tissue-engineered implants or biomaterials delivering growth factors. A notable limitation of this murine method is that the size of an implant used to deliver therapeutic drugs or cells is limited to the defect volume of roughly a 0.5 mm diameter sphere. Only larger animal models can accommodate the volume of test material that would be used in human patients. The bur defect created in this protocol is not the same geometry as a thin fracture and thus differs from actual human injuries. Nonetheless, the benefits of this mouse model are many, and the lateral approach avoids damaging the articular cartilage that would occur when approaching blindly above or below the growth plate in line with the tibial long axis. This methodology represents a substantial leap in growth plate injury research, providing a detailed and reproducible method for investigating pathology and evaluating new therapeutic strategies.
Disclosures
The authors have no conflicts of interest to disclose.
Acknowledgements
This work was supported by a grant from the National Institutes of Health, National Institute of Arthritis and Musculoskeletal and Skin Diseases (NIAMS) 1R21AR079153 and a University of Connecticut Research Enhancement Program (REP) grant. The authors would like to acknowledge the assistance of Renata Rydzik from the University of Connecticut MicroCT Imaging Core facility.
Materials
| Name | Company | Catalog Number | Comments |
|---|---|---|---|
| 2-methyl-butane | Sigma Aldrich | M32631 | |
| Alcohol antiseptic pads | Acme United Corporation | H305-200 | |
| Axio Scan.Z1 | Carl Zeiss AG | Axio Scan.Z1 | |
| AxioVision software | Carl Zeiss AG | ||
| Betadine solution (10% povidone-iodine) | Avrio Health L.P. | 67618-150-01 | |
| Calcein | Sigma Aldrich | C0875 | |
| Calcein Blue | Sigma Aldrich | M1255 | |
| CFP filter set | Chroma Technology Corp. | 49001 | |
| Cryomatrix | Thermo Scientific | 6769006 | |
| Cryomolds | Fisher Scientific | Fisherbrand #22-363-554 | |
| Cryostat | Leica Biosystems | 3050s | |
| Cryostat blades | Thermo Scientific | 3051835 | |
| Cryotape | Section Lab | Cryofilm 2C | |
| Curved fine scissor | Fine Science Tools | 14061-11 | |
| Curved mosquito hemostatic forceps | HuFriedyGroup | H3 | |
| cy5 filter set | Chroma Technology Corp. | 49009 | |
| DAPI | ThermoFisher Scientific | 62247 | |
| DAPI filter set | Chroma Technology Corp. | 49000 | |
| Dental bur (0.5 mm diameter) | |||
| Dental cleoid discoid carver | ACE Surgical Supply Inc. | 6200097A-EA | |
| Dry glass bead sterilizer (Inotech Steri 350) | Inotech Bioscience, LLC | IS-250 | |
| Ear punch | Fine Science Tools | 24212-01 | |
| Electric heating pad | |||
| Electronic foot control | Nouvag AG | 1866nou | |
| Electronic motors 31 ESS | Nouvag AG | 2063nou | |
| Environmental surface barrier (3 x 12 inch tube sox) | Patterson Companies, Inc. | BB-0312H | |
| Ethanol (70%) | |||
| Ethiqa XR (buprenorphine extended-release injectable suspension) 1.3 mg/mL | Fidelis Animal Health | 86084-100-30 | |
| Faxitron x-ray cabinet | Kubtech Scientific | Parameter | |
| Fluorescence Stereomicroscope | Carl Zeiss AG | Lumar V12 | |
| GFP filter set | Chroma Technology Corp. | 49020 | |
| Glacial acetic acid | Sigma Aldrich | ARK2183 | |
| Glass microscope slides | Thermo Scientific | 3051 | |
| Glycerol | Sigma Aldrich | G5516 | |
| Graefe forceps | Fine Science Tools | 11051-10 | |
| Handpiece (contra angle 32:1 push button) | Nouvag AG | 5201 | |
| Implantology/oral surgery system control unit (Straumann) | Nouvag AG | SEM | |
| Instant sealing sterilization pouch with dual internal/external process indicators (3 1/2 x 5 1/4 inch) | Fisher Scientific | 01-812-50 | |
| Instant sealing sterilization pouch with dual internal/external process indicators (5 4/1 x 10 inch) | Fisher Scientific | 01-812-54 | |
| Insulin syringe (29 G) | Exel International | 26028 | |
| Isoflurane | Dechra Pharmaceuticals plc | 17033-091-25 | |
| Isoflurane anesthetic system | |||
| mCherry filter set | Chroma Technology Corp. | 39010 | |
| Micro-dissecting scissor | Fine Science Tools | 14084-08 | |
| NaHCO3 | Sigma Aldrich | S5761 | |
| Needle (20 G) | Becton, Dickinson and Company | 305178 | |
| Needle holder | HuFriedyGroup | NHCW | |
| Neutral buffered formalin (10%) | Sigma Aldrich | HT501128-4L | |
| Non-sterile applicator swabs | Allegro Industries | 205 | |
| Non-woven gauze (3 x 3 inch) | Fisher Scientific | 22028560 | |
| Norland Optical Adhesive, 61 | Norland Optical | Norland Optical Adhesive, 61 | |
| Ophthalmic ointment (Optixcare eye lube) | CLC Medica | ||
| PBS | Sigma Aldrich | P5368 | |
| Periodontal probe | HuFriedyGroup | PQW | |
| Phosphate buffered saline (PBS) pH 7.4 (1x) | Gibco, by Life Technologies | 10-010-023 | |
| Plastic microscope slides | Electron Microscopy Sciences | 71890-01 | |
| Professional clipper/trimmer (Wahl Classic Peanut) | Wahl Clipper Corporation | 8685 | |
| Roller | Electron Microscopy Sciences | 62800-46 | |
| Scanco Medical software | SCANCO Medical | Scanco μCT 50 | |
| Sodium acetate anhydrous | Sigma Aldrich | S2889 | |
| Sodium nitrite | Sigma Aldrich | S2252 | |
| Sodium tartrate dibasic dihydrate | Sigma Aldrich | T6521 | |
| Specimen disc | Leica Biosystems | 14037008587 | |
| Stainless steel #15 surgical blade | Aspen Surgical Products, Inc. | 371615 | |
| Sterile surgical gloves | Cardinal Health, Inc. | 2D72PT65X | |
| Sterile towel drape (18 x 26 inch) | IMCO | 4410-IMC | |
| Sucrose | Sigma Aldrich | S9378 | |
| Syringe (1 mL) | Becton, Dickinson and Company | 309659 | |
| Undyed braided coated vicryl suture (5-0) | Ethicon Inc. | J490G | |
| UV black light | General Electric | F15T8-BLB |
References
- Iannotti, J. P. Growth plate physiology and pathology. Orthop Clin North Am. 21 (1), 1-17 (1990).
- Chung, R., Foster, B. K., Xian, C. J. Injury responses and repair mechanisms of the injured growth plate. Front Biosci (Schol Ed). 3 (1), 117-125 (2011).
- Salter, R. B., Harris, W. R. Injuries involving the epiphyseal plate. JBJS. 45 (3), 587-622 (1963).
- Cepela, D. J., Tartaglione, J. P., Dooley, T. P., Patel, P. N. Classifications in brief: Salter-harris classification of pediatric physeal fractures. Clin Orthop Relat Res. 474 (11), 2531-2537 (2016).
- Macsai, C. E., Hopwood, B., Chung, R., Foster, B. K., Xian, C. J. Structural and molecular analyses of bone bridge formation within the growth plate injury site and cartilage degeneration at the adjacent uninjured area. Bone. 49 (4), 904-912 (2011).
- Shaw, N., et al. Regenerative medicine approaches for the treatment of pediatric physeal injuries. Tissue Eng Part B Rev. 24 (2), 85-97 (2018).
- Xian, C. J., Zhou, F. H., Mccarty, R. C., Foster, B. K. Intramembranous ossification mechanism for bone bridge formation at the growth plate cartilage injury site. J Orthop Res. 22 (2), 417-426 (2004).
- Muruganandan, S., et al. A foxa2+ long-term stem cell population is necessary for growth plate cartilage regeneration after injury. Nat Commun. 13 (1), 2515(2022).
- Coleman, R. M., et al. Characterization of a small animal growth plate injury model using microcomputed tomography. Bone. 46 (6), 1555-1563 (2010).
- Lee, E. H., Gao, G. X., Bose, K. Management of partial growth arrest: Physis, fat, or silastic. J Pediatr Orthop. 13 (3), 368-372 (1993).
- Planka, L., et al. Nanotechnology and mesenchymal stem cells with chondrocytes in prevention of partial growth plate arrest in pigs. Biomed Pap Med Fac Univ Palacky Olomouc Czech Repub. 156 (2), 128-134 (2012).
- Foster, B. K., et al. Reimplantation of growth plate chondrocytes into growth plate defects in sheep. J Orthop Res. 8 (4), 555-564 (1990).
- Erickson, C. B., et al. A rat tibial growth plate injury model to characterize repair mechanisms and evaluate growth plate regeneration strategies. J Vis Exp. (125), e55571(2017).
- Coleman, R. M., Schwartz, Z., Boyan, B. D., Guldberg, R. E. The therapeutic effect of bone marrow-derived stem cell implantation after epiphyseal plate injury is abrogated by chondrogenic predifferentiation. Tissue Eng Part A. 19 (3-4), 475-483 (2013).
- Mccarty, R. C., Xian, C. J., Gronthos, S., Zannettino, A. C., Foster, B. K. Application of autologous bone marrow derived mesenchymal stem cells to an ovine model of growth plate cartilage injury. Open Orthop J. 4, 204-210 (2010).
- Chen, J., et al. Isolation and characterization of murine mandibular condylar cartilage cell populations. Cells Tissues Organs. 195 (3), 232-243 (2012).
- Clearfield, D. S., Xin, X., Yadav, S., Rowe, D. W., Wei, M. Osteochondral differentiation of fluorescent multireporter cells on zonally-organized biomaterials. Tissue Eng Part A. 25 (5-6), 468-486 (2019).
- Dyment, N. A., et al. Response of knee fibrocartilage to joint destabilization. Osteoarthritis Cartilage. 23 (6), 996-1006 (2015).
- Kalajzic, I., et al. Use of type i collagen green fluorescent protein transgenes to identify subpopulations of cells at different stages of the osteoblast lineage. J Bone Miner Res. 17 (1), 15-25 (2002).
- Maye, P., et al. Generation and characterization of col10a1-mcherry reporter mice. Genesis. 49 (5), 410-418 (2011).
- Chokalingam, K., et al. Three-dimensional in vitro effects of compression and time in culture on aggregate modulus and on gene expression and protein content of collagen type ii in murine chondrocytes. Tissue Eng Part A. 15 (10), 2807-2816 (2009).
- Dutta, S., Sengupta, P. Men and mice: Relating their ages. Life Sci. 152, 244-248 (2016).
- Dyment, N. A., et al. multi-image cryohistology of mineralized tissues. J Vis Exp. (115), e54468(2016).
- Chavez, M. B., et al. Guidelines for micro-computed tomography analysis of rodent dentoalveolar tissues. JBMR Plus. 5 (3), e10474(2021).
- Chung, R., Xian, C. J. Recent research on the growth plate: Mechanisms for growth plate injury repair and potential cell-based therapies for regeneration. J Mol Endocrinol. 53 (1), T45-T61 (2014).
Reprints and Permissions
