Here, we describe different multicellular spheroid formation methods to perform follow-up multi-parameter live cell microscopy. Using fluorescence lifetime imaging microscopy (FLIM), cellular autofluorescence, staining dyes, and nanoparticles, the approach for analysis of cell metabolism, hypoxia, and cell death in live three-dimensional (3D) cancer and stem cell-derived spheroids is demonstrated.
A subscription to JoVE is required to view this content. Sign in or start your free trial.
Method Article
Production and Multi-Parameter Live Cell Fluorescence Lifetime Imaging Microscopy (FLIM) of Multicellular Spheroids
* These authors contributed equally
In This Article
Summary
Abstract
Multicellular tumor spheroids are a popular 3D tissue microaggregate model for reproducing tumor microenvironment, testing and optimizing drug therapies and using bio- and nanosensors in a 3D context. Their ease of production, predictable size, growth, and observed nutrient and metabolite gradients are important to recapitulate the 3D niche-like cell microenvironment. However, spheroid heterogeneity and variability of their production methods can influence overall cell metabolism, viability, and drug response. This makes it difficult to choose the most appropriate methodology, considering the requirements in size, variability, needs of biofabrication, and use as in vitro 3D tissue models in stem and cancer cell biology. In particular, spheroid production can influence their compatibility with quantitative live microscopies, such as optical metabolic imaging, fluorescence lifetime imaging microscopy (FLIM), monitoring of spheroid hypoxia with nanosensors, or viability. Here, a number of conventional spheroid formation protocols are presented, highlighting their compatibility with the live widefield, confocal, and two-photon microscopies. The follow-up imaging to analysis pipeline with multiplexed autofluorescence FLIM and, using various types of cancer and stem cell spheroids, is also presented.
Introduction
Multicellular spheroids represent a group of 3D tissue models obtained by the self-aggregation of cells and exhibiting a spherical shape. They are widely used to mimic cell-cell and cell-matrix interaction in vitro and to reproduce a 3D context within a multitude of cancer and stem cell-derived constructs. Several techniques are employed to reduce cell attachment and promote the aggregation. These include the hanging-drop method relying on the surface tension1; cell attachment repelling methods such as ultra-low attachment plates, micro-molds, and microwells2,3; acoustic wave-based approach4; flow-induced aggregation methods (spinner flasks, bioreactor, and microfluidic devices)5; magnetic particles-assisted formation6 and use of the aggregation-promoting synthetic and ECM-based matrices and scaffolds7,8,9.
In cancer research, development, and validation of new drug therapies, spheroids are an attractive model due to their ability to recapitulate the spatial diffusion-limited gradients of nutrients, waste products, and O2, often leading to the formation of a necrotic core, typical to the solid tumors10,11. These more reliable and sophisticated in vitro models challenge the need for extensive use of animal models (Food and Drug Administration [FDA] Modernization Act 2.012), according to the 3Rs principle of animal research (replacement, reduction, and refinement). In addition to cancer, spheroids find their application in stem cell research. For instance, pluripotent stem cells have the capacity to form embryoid bodies (EB), which can be used for the differentiation of induced pluripotent stem cells (iPSCs) towards specialized cell types that are challenging to obtain directly from patients, such as neural precursor cells13 or ovarian granulosa cells13,14. Furthermore, the formation of an EB is often the first step in the development of more complex organoid models, e.g., neural15, retinal16, cardiac17, liver18, stomach19, and intestinal organoids20. Factors including size, reproducibility, throughput, and downstream applications should be considered when choosing an appropriate spheroid formation method for the experiments.
The increased complexity of 3D culture can lead to higher variability compared to 2D culture. Factors such as nutrient composition21, media evaporation22, viscosity23, pH control24, spheroid formation method, and even the time in the culture25,26 can result in obtaining spheroids of varying morphology, sizes, viability, and different chemoresistance27,28. Recent research demonstrated that spheroid oxygen gradients are not always static and are affected by the formation method, spheroid size, and extracellular viscosity, affecting the spheroid heterogeneity29. To improve reproducibility and data accessibility on spheroids, the MISpheroID knowledge base has been developed26, identifying cell line, culture medium, formation method, and spheroids size as the minimal information for a reproducible result. Therefore, a detailed comparison was made of multiple high-throughput (SphericalPlate 5D, lab-made micromolds, and Microtissue molds) and low attachment methods (i.e., Biofloat and Lipidure-coated 96-well plates, both scaffold-free and scaffold-based) (Figure 1 and Table 1), including the well size (given an estimation of the maximum spheroid size), consumables used, preparation time and the possibility of monitoring spheroids without transporting them to microscopy dishes. The latter enables long-term studies, whereas spheroids produced with high-throughput methods often result in endpoint experiments. All methods except for the grids of the 5DspheriPlate do not bring unwanted autofluorescence, hereby enabling their direct use in microscopy.
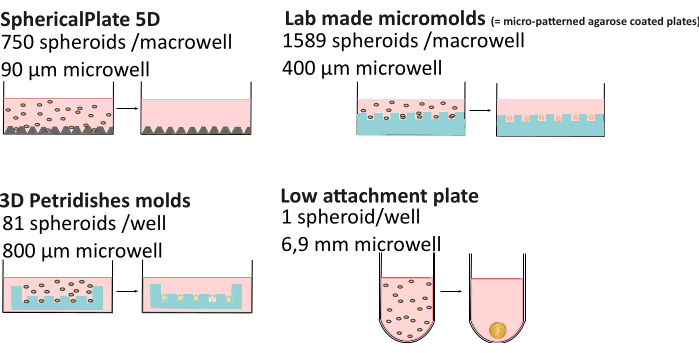
Figure 1: Spheroid formation methods explained. High-throughput methods such as the SphericalPlate 5D, which has integrated patented microwells in the plate, while the lab-produced micromolds and the MicroTissue molds use stamps to make multiple microwells in agarose (blue). Low-attachment plates such as Lipidure (Amsbio) and Biofloat (Sarstedt) use a non-adherent coating inhibiting cell-surface adhesion and promoting cell self-aggregation. Please click here to view a larger version of this figure.
| 5D SpheriPlate | Self-produced micromolds | Microtissue | Low attachment methods | |
| Number of spheroids/well | 750 | 1589 | 81 | 1 |
| Diameter well | 90 µm | 400 µm | 800 µm | 1 mm |
| Culture volume | 1 mL | 5 mL | 1 mL | 200 µL |
| Other consumables | / | 7 mL of 3% agarose | 500 µL of 2% agarose | / * |
| Preparation time | 10 min | 2 h + 3 days media adaptation | 0.5 h + 15 min media adaptation | 10–30 min + 1 h drying |
| Monitoring | Yes | No** | Yes | Yes |
| Autofluorescent | Yes | No | No | No |
| Reusable | No | Yes | Yes | No** |
| Cost | €€ | € | €€€€ | €€€€: Coating and Matrigel |
| €€: Commercial 96-well plate | ||||
| *Some cell lines need addition of ECM (i.e. 2%–5% Matrigel) to form compact spheroids. | ||||
| **The coating is reusable until depleted. However, each plate will consume a small amount of media and dust can accumulate over time. Filter sterilization is regularly needed. | ||||
Table 1: Comparison of multiple spheroid formation methods29. "Monitoring": the ability to monitor spheroid without the need for transfer to a microscopy dish. €: 0-50€, €€: 50-150€ , €€€: 150-500€ , €€€€: >500€
Fluorescence microscopy enables direct monitoring of the key biological aspects within spheroids, including cell death, viability, proliferation, metabolism, viscosity, and even mechanical properties30. Fluorescence lifetime imaging microscopy (FLIM) provides an additional quantitative dimension for studying fluorescent probe interactions within their (micro)environment31,32,33,34, allowing resolving the overlapping emission spectra according to different emission lifetimes35,36 and probing cell metabolism based on intrinsic cellular autofluorescence. Thus, such widespread cellular autofluorescent compounds as nicotinamide adenine dinucleotide phosphate (NAD(P)H), flavin mononucleotide (FMN), flavin adenine dinucleotide (FAD), protoporphyrin IX, and others can be measured with one- and two-photon FLIM and serve as intrinsic 'sensors' of glucose catabolism, oxidative phosphorylation (OxPhos) and provide a general overview of the cell redox state. NAD(P)H exists in free cytoplasmic, or in protein-bound mitochondrial forms37,38. Similarly, the oxidized state of FAD is fluorescent with a longer lifetime of the free form. NAD(P)H and FAD microscopies usually involve two-photon excited FLIM, aiming at preventing sample photodamage39. Frequently, 'optical metabolic imaging' FLIM can be combined with the use of dye-based probes, genetically encoded biosensors, phosphorescence lifetime imaging microscopy (PLIM), and ratiometric intensity-based measurements in order to provide a more complete picture of spheroid or organoid metabolism, oxygenation, proliferation and cell viability29,30,31. In addition, FLIM can also be combined with Förster resonance energy transfer (FRET) method to measure the lifetime variation of the donor fluorophore when in close contact with the acceptor to investigate the binding of a drug with its target domain33,40,41.
The acquired FLIM images are typically analyzed to calculate the lifetime pixel-by-pixel. Currently, there are at least 3 common strategies used to obtain fluorescence lifetime: semi-quantitative 'fast FLIM'42 (sometimes referred to as 'tau sense'43,44), decay curve fitting, using one-, two- or three-exponential fitting, and 'fitting-free' approach with phasor transformation and phasor plot analysis. Depending on the vendor, either provided (LAS X, Symphotime, SPCImage, etc.) or open-source software (e.g., FLIMfit45, FLIMJ46, or others47) can be used to handle measured FLIM data. Typically, vendor-provided software is useful for preliminary data analysis, while open-source solutions can provide for more accurate studies using, e.g., phasor plots and 3D visualization.
Despite the usefulness and attractiveness of FLIM as a method for studying spheroids, very few experimental protocols are available, and there is a general lack of knowledge in choosing the most appropriate formation method for successful live multiparametric microscopy experiments involving FLIM. Here, a detailed comparison of commonly used spheroid formation protocols is presented based on their morphology, viability, and oxygenation with the recently validated and characterized far-red and near-infra-red (NIR) oxygen-sensing nanosensor (MMIR1). The cationic nanoparticle is impregnated with two reporter dyes, the reference O2-insensitive aza-BODIPY (excitation 650 nm, emission 675 nm) and the NIR O2-sensitive metalloporphyrin, PtTPTBPF (excitation 620 nm, emission 760 nm). The MMIR1 enables real-time analysis of oxygen gradients on a conventional fluorescence microscope (using ratiometric analysis) or phosphorescence lifetime microscope (PLIM) without introducing cellular toxicity and allowing for stable signals, long-term monitoring, and multiplexing25,29. Depending on the need to stain with dyes or nanosensors, spheroid throughput, or cell type, the most appropriate formation protocol can be chosen. Since the studies of spheroids viability and oxygenation are relevant for studies of cancer and stem cell-derived spheroids, the presented protocols also include examples and expected typical results of NAD(P)H-FLIM and FAD-FLIM with these models. The presented imaging and analysis pipelines target the most popular time-correlated single photon counting-based FLIM microscopy platforms.
Access restricted. Please log in or start a trial to view this content.
Protocol
1. Generation of multicellular spheroids
- Cell culture
NOTE: Cell cultures can be collected from the American Type Culture Collection (ATCC), Lonza, Sigma-Aldrich, or other vendors. ATCC provides all required handling information, including preferred growth media, subculturing procedures, biosafety level, growth rate, and STR profiles. Here, 500 cells/spheroid of human colon cancer cell line HCT116 is used in McCoy's 5A media (VWR, 392-0420) supplemented with 10% FBS and 1 mM Sodium Pyruvate. For long-term experiments that are monitored daily, 10 mM HEPES, pH 7.2 can be added to the media.- Grow cell culture to reach 70%-90% confluency.
- Rinse cells with prewarmed (37 °C) sterile PBS (5 mL for 25 cm2 or 10 mL per 75 cm2 flask).
- Add 0.05% trypsin - 1 mM EDTA solution (0.5 mL for 25 cm² or 1 mL per 75 cm2 flask) and incubate for 5-10 min at 37 °C in 5% CO2, 95% humidity to reach cell detachment.
NOTE: Control cell detachment under the transmission light (brightfield) microscope. The overexposure of cells to the dissociating enzyme solution can affect their viability. - Neutralize trypsin by adding excess cell culture media containing 10% FBS (at least 5 mL of media per 1 mL of dissociation solution).
NOTE: For cells cultured on low FBS or FBS-free culture media, trypsin neutralization can be done with the addition of 0.5 mL of 100% FBS to the trypsin-treated cell culture, followed by centrifugation to transfer cells to their original culture media. - Dissociate cell aggregates by pipetting to obtain single-cell suspension in media.
NOTE: Pipetting with a serological pipette with a 1000 µL pipette tip on the top highly improves single-cell suspension generation in a big volume of suspension cell culture. - Use a counting chamber (Neubauer ruled hemocytometer or alternatives) to count cell number per 1 mL of the cell suspension.
- Dilute the cell suspension to obtain the desired number of cells per milliliter.
- Add concentrated O2 probe (nanoparticles) solution to the cell suspension at a final concentration of 10 µg/mL for ratiometric analysis of O2.
NOTE: To ensure homogenous cell suspension (with the probe), resuspend multiple times before spheroid formation. If the O2 probe is not required, skip this step and proceed with the formation of the spheroids. A modified protocol should be applied when handling iPSCs. Briefly, iPSCs are grown in colonies on Geltrex-coated plates and passaged using ReLeSR as described in the vendor-provided protocol48. On the day of spheroid formation, colonies should be large, compact, and exhibit multilayered centers with distinct borders. Rinse cells with prewarmed sterile PBS. Add 1 mL of gentle cell dissociation reagent (GCDR) and incubate at 37 °C for 8-10 min. Use a 1000 µL tip to gently detach cells from the well and to obtain a single-cell suspension. Transfer single cell suspension to a sterile 50 mL conical tube and add 4 mL of prewarmed DMEM-F12 medium to neutralize the GCDR. Wash the well with 1 mL of DMEM-F12 and transfer it to the rest of the cell suspension. Centrifuge at 300 x g for 5 min. Resuspend in 1 mL of appropriate media for further experiments. For experiments described in this manuscript, mTeSR + 10 µM Rock Inhibitor was used. Count and dilute the cell suspension to obtain the desired number of cells per milliliter.
- Spheroid formation methods
- 3D Petri dish micro-molds
NOTE: This high throughput method is used to simultaneously generate a high number of spheroids (81 spheroids) in a 9 x 9 micromold array with 800 µm diameter and 800 µm depth.- Rinse micro-molds for casting 3D Petri dishes in dH2O and put in autoclavable container.
- Measure 2 g of electrophoresis-grade agarose powder and place it into a dry 200 mL autoclave-safe glass bottle.
NOTE: Be sure the bottle and agarose powder are dry with no liquid or moisture. - Autoclave micro-molds for casting 3D Petri dishes and bottles with agarose powder for 30 min on a dry cycle.
- Make a 0.9 w/v% saline solution by addition of 0.9 g of NaCl in 100 mL of ultrapure water and sterilize by autoclaving.
NOTE: NaCl is recommended by the manufacturer. It increases the agarose stability. - Prepare the agarose solution by adding the sterile saline to the sterilized agarose powder. Screw on the lid loosely fitted to avoid pressure buildup. Swirl the bottle to mix the agarose powder.
- Boil and dissolve the agarose powder by using a microwave oven. Stop the microwave frequently (~every 10 s). Swirl the bottle and repeat until agarose is dissolved.
CAUTION: The agarose solution is hot and requires careful handling. Shaking immediately following the melting procedure may cause the solution to burst out of the vessel. To avoid accidents, use sufficiently large vessels filled to no more than 50% of capacity and use appropriate personal protection (gloves, oven mitt, eye protection, and lab coat). - Let the dissolved agarose solution cool down to 60-70 °C. Using aseptic techniques and conditions, pipette molten agarose into the micro-mold (500 µL for 12-series or 330 µL for 24-series).
NOTE: Avoid bubble formation while mixing or pipetting agarose. Remove any trapped small bubbles in the small features of the micro-mold by pipetting or gentle scrapping before the agarose solidifies. - Let the agarose solidify for about 2-3 min. Afterwards, carefully flex the micro-mold to remove the 3D Petri dish and transfer to a 12 well tissue culture plate.
NOTE: Overflexing of the micro-mold might lead to the formation of cracks within the agarose mold. - To equilibrate the 3D Petri dish, add 2.5 mL/well cell culture medium. Incubate for 15 min or longer. Remove the culture medium and replace it with fresh medium. Repeat once more to equilibrate the 3D Petri dish with a culture medium.
NOTE: The protocol can be interrupted here until cell seeding. For long-term storage (up to 2 weeks at 4 °C), use PBS solution instead of medium. - Remove the 3D Petri dish surrounding the culture medium (or PBS) completely and accurately remove the media inside the 3D Petri dish by tilting the tissue culture plate.
- Carefully seed 190 µL of cell suspension containing 40,500 cells dropwise into the cell seeding chamber (see step 1.1).
NOTE: The number of micro-wells in agarose stamps determines the number of spheroids produced per stamp. In this case, this agarose mold contains 81 microwells (81 x 500 cells/spheroid). Variation of cell concentration in suspension added to a macrowell allows changing the cell number per spheroid, thus controlling the spheroid's size. - Allow ~10 min for cells to settle into the features of the 3D Petri dsh. Then, add 2 mL of medium to the outside of the 3D Petri dish.
- Place the tissue culture plate in the cell culture incubator and exchange the medium surrounding the 3D Petri Dish as needed.
- Low attachment plate
NOTE: This method is used to generate a single spheroid per well. Coated plates (Lipidure or Biofloat) are commercially available (skip steps 1.2.2.1-1.2.2.4). Alternatively, the coating can be purchased separately and used to coat untreated multi-well plates. It is recommended to fill wells at the edges of 96-well plates with sterile water or PBS due to faster evaporation in these wells, thereby limiting the number of wells for spheroids to 60. In case fewer spheroids are needed, fill the surrounding empty wells with water or PBS. Use dust-free tips for liquid handling to avoid bringing small particles into the wells, as they interfere with the spheroid formation.- Prepare a 0.5 w/v% coating solution by dissolving 0.25 g of the polymer powder in 50 mL of ethanol in a glass bottle container. Filter-sterilize the coating.
NOTE: Filter sterilization and all the next steps have to be carried out in sterile conditions under laminar flow. - Add 200 µL of the coating solution to each well of a 96 U-bottom culture plate.
- Incubate for 1 min and take off excess coating.
NOTE: The coating solution can be used multiple times. Store in a glass container at room temperature (RT). Plastic containers are not advised, as the plastic can get partially dissolved and become a part of the solution. If dust is present, filter sterilize with a 0.22 µm polyethersulfone (PES) or nylon syringe filters. - Let the 96-well plate air dry for about 1 h.
NOTE: If cells need an extracellular matrix, proceed to step 1.2.3. Coated plates can be stored at RT when wrapped in aluminum for up to 1 month. When seeding a lower amount of cells/well, centrifuging the plate for 5 min at 300 g can help pull down the cells.
- Prepare a 0.5 w/v% coating solution by dissolving 0.25 g of the polymer powder in 50 mL of ethanol in a glass bottle container. Filter-sterilize the coating.
- Extracellular matrix-aided formation protocol
NOTE: Some cell lines do not produce enough extracellular matrix (ECM) themselves and need the addition of ECM such as Matrigel, Cultrex, or Geltrex in order to form compact spheroids49,50,51. For such cell types as breast cancer MDA-MB-231, human dermal papilla, prostate cancer cells and others, it is possible to use step 1.2.2 with the following modifications52, requiring the addition of ECM. Preferably use dust-free tips for liquid handling to avoid dust interfering with the spheroid formation. Steps 1 and 4-7 must be carried out under a biological safety cabinet (class II).- Proceed with steps 1.2.2.1-1.2.2.4 (low attachment plates) for surface treatment.
- Pre-chill the 96-well plate at 4 °C in the refrigerator.
- Prepare the centrifuge with the correct adapter for the 96-well plate and prechill it for 4 °C.
- Prepare a 5% solution of basement membrane matrix (BMM) in pre-chilled (4 °C) cell culture media.
NOTE: BMM rapidly crosslinks at RT. When handling, keep stocks and solutions on ice. - Prepare the cell suspension (see step 1.1).
- Add 50 µL of the BMM solution into each well.
- Gently add 50 µL of cell suspension into each well on top of the BMM solution (25,000 cells/well).
NOTE: Do not blast this volume into the well, or else the cells will spread up on the sides of the wells and not collect at the bottom. A lower number of cells per well can be obtained by adjusting the cell density accordingly. Not all cells will form spheroids at all seeding densities; the optimization must be performed cell type and desired dimension-wise. With the provided volumes, the final concentration of BMM is 2.5%. If a different concentration is needed, the stock solution has to be prepared at a lower/higher concentration. - Centrifuge the 96-well plate for 5 min at 300 x g and 4 °C.
NOTE: Without this step, cells do not aggregate properly in the bottom of the well, causing multiple smaller aggregates to form. The centrifuge has to be cooled down to avoid crosslinking at this stage. - Place the plate in the cell culture incubator. Aggregates are considered mature on day 4 after seeding.
NOTE: For additional protocols on spheroid formation, refer to Supplementary File 1.
- 3D Petri dish micro-molds
2. Live microscopy of spheroids
- Preparation of spheroids for live imaging analysis
NOTE: Depending on the experiment design (e.g., long-term monitoring or endpoint analysis, microscope set-up, or spectral properties of the measured fluorescence) or due to incompatibility of the spheroid production method with the microscopy (e.g., sample thickness, autofluorescence of the material, floating of spheroids during imaging) direct monitoring of spheroids in the plate, where they were produced, may not be possible. The protocol explains the preparation of spheroids for imaging, which are suitable for most inverted widefield and confocal microscopes.- Prepare and prewarm (37 °C) imaging media: DMEM supplemented with HEPES-Na, pH 7.2 (10 mM), sodium pyruvate (1 mM), L-glutamine (2 mM), and glucose (5 mM), without phenol red.
NOTE: Sodium bicarbonate alone or in combination with HEPES-Na can be used, if CO2 control is provided during imaging24. Some cell culture types cannot tolerate the presence of HEPES. Depending on the experimental design, pyruvate, glutamine, and glucose content can be modified. - Prepare sterile microscopy dishes (commercially available or lab-made) with coated (for a strong spheroid adhesion) or non-coated (low spheroid adhesion) cover glass surfaces (thickness #1.5).
NOTE: The need and the type of coating depend on the cell type, adhesion properties of spheroids, and the rate of their cell migration from 3D to 2D culture interface. This is important to consider, as the coating can facilitate the loss of 3D organization, changing the shape of micro-gradients in spheroids and, as a result, cell behavior. For some experiments (e.g., imaging analyzed the response to drug stimulation), strong spheroid adherence to the surface is required, and a coating with gelatin, BMM, collagen, collagen / poly-D-lysine, or poly-D-lysine is preferred. - Gently wash out the O2 probe-stained spheroids from the microwells of the micropatterned agarose or 96-well plate and transfer still floating spheroids into a 2 mL vial.
NOTE: To ensure the collection of all spheroids from the high throughput method, rinse the mold 1-3 times with the additional volume of culture media, combining all spheroid suspensions in one vial. For spheroids in a low attachment plate, collect spheroids one by one from individual wells to a vial or directly to a microscopy dish if a small number of spheroids is sufficient for the experiment. When transferring big spheroids, cut the end of the pipet tip to ensure no damage during pipetting. - Leave the vial in a vertical position for up to 5 min to let the spheroids settle down on the bottom of the vial, forming a visible pellet.
- Remove the media from the tube, leaving spheroids undisturbed, and gently resuspend them in a sufficient amount of fresh culture.
NOTE: For the convenience of spheroid handling, transfer of spheroids to the imaging media can be also done at this stage in small batches; see steps 2.1.7 and 2.1.8. Spheroids from the different experimental groups should be treated equally, as the media composition and media preconditioning time can affect their metabolism. - While spheroids are floating, transfer an equal volume of spheroid suspension per well of the microscopy dish.
- Incubate spheroids for 1-2 h at 37 °C in a CO2 incubator to ensure their attachment to the surface of the microscopy dish/ well. For imaging, proceed with step 2.1.9. For staining of spheroids with additional probes proceed with step 2.1.8.
NOTE: The rate of cell migration from the 3D spheroid to the 2D surface interface is a function of time. To avoid a loss of 3D organization, incubation time must be optimized with respect to cell type, surface coating type, and the design of the experiment. For example, HCT116, depending on spheroid size, needs at least 2 h for a proper spheroid attachment to the collagen IV/poly-D-lysine coated surface, while hDPSC attachment and migration to 2D interface is extremely quick, leading to loss of 3D organization in 1-2 h. To avoid imaging '2D spheroids' due to excessive spreading, non-coated glass surfaces are used with the decreased incubation time. - Add fluorescence probe(s) in recommended or empirically optimized concentrations to a known volume of spheroid suspension. Incubate for 1 h at 37 °C CO2 incubator prior to imaging.
NOTE: For live/dead assay, use propidium iodide and Calcein Green-AM in a standard final concentration 1 µg/mL. To avoid the toxic effect of propidium iodide staining on iPSC embryoid bodies, the final propidium iodide concentration was 0.5 µg/mL. The probe loading time can be prolonged if the diffusion of the probe is not efficient due to the big spheroid size. The loading time should always be considered as a part of the total incubation time needed for spheroid attachment to the surface. If a longer time is needed for spheroid attachment, the staining procedure should be arranged at the end of this period. Be aware that longer incubation time might lead to the loss of 3D organization. - Remove cell culture media or media containing fluorescent probes and exchange it for a necessary volume of imaging media. To ensure that no media fluorescence background is on the way of spheroid imaging repeat the media exchange (washing) step up to 5 times.
NOTE: To avoid spheroid removal during media exchange, it is recommended to carefully aspirate media with a 200 µL pipette from the edges of the microscopy dishes and perform the addition of media by the wall or sidewise in the microscopy dish. - Immediately proceed with step 2.2.1 of the imaging protocol.
NOTE: A too long break between preparation to imaging and actual imaging acquisition can influence cell metabolism (e.g., via changed medium composition), viability (some fluorescent probes used for endpoint analysis have toxic effects, which can stimulate cell death after a long incubation period) as well as lead to a loss of 3D organization. If multiple groups of spheroids or experimental conditions must be compared, the experimental design must be developed accordingly to keep the timing of the treatment, preconditioning, and imaging procedures as equal as possible between the analyzed groups.
- Prepare and prewarm (37 °C) imaging media: DMEM supplemented with HEPES-Na, pH 7.2 (10 mM), sodium pyruvate (1 mM), L-glutamine (2 mM), and glucose (5 mM), without phenol red.
- Image acquisition
NOTE: The protocol describes the multiparametric imaging of live spheroids using Stellaris 8 Falcon (Leica) confocal microscope and Leica Application Suite X (LAS X) software version 4.7. However, only minor modifications will be required to perform such an analysis on alternative microscopy platforms.- Turn on the temperature climate control unit 30-60 min prior to imaging. Set the necessary speed of ventilation and temperature (35-37 °C).
NOTE: If in addition to temperature control, gas concentration (e.g., CO2 or O2) must be controlled during the imaging, the corresponding devices should also be started in advance to reach the necessary conditions prior to imaging. - Turn on the microscope and connected devices (i.e., WLL laser, computer, water pump for the water immersion objective, and other operating electronic blocks). Start the microscope control software (e.g., LAS X Machine Mode or Machine Mode with Environmental Control) provided with the exact microscope set-up and initialize the stage calibration.
- Choose the required objective in the software and apply the immersion fluid if required.
NOTE: For live microscopy, it is recommended to use either water or glycerol immersion objectives having sufficient ('long') working distance, e.g., HC Fluotar L 25x/0.95 W VIS IR (2.4 mm working distance), HC PL Apo 40x/1.25 GLYC (0.35 mm working distance) or at least NA = 0.4 or higher for the air objectives. The choice of magnification and working distance depends on the nature and size of the imaged sample and measured fluorescence signals (brightness, quantum yield, staining efficiency, see e.g., discussion on dyes and nanoparticles53). Big objects (spheroids or organoids, >500 µm size), 'bio-reactor' or microfluidic chips require long working distance objectives and lower magnification, while analysis of individual cells or cell organelles requires high magnification, often achieved via 'mosaic' imaging. - Set up the microscopy dish with spheroids on the stage. Adjust the focus and find an object/region of interest (ROI).
NOTE: If small, weakly fluorescent, poor contrast, or rare objects must be found and finding the focus is difficult, it is recommended to pre-focus on the walls of the microscopy dish and 'screening' the surface for the object of interest by serpentine, starting from one of the corners of the well. - Choose the Open Project window and click the corresponding icon, Create a New Project. Give a standard name (e.g., starting from "YY-MM-DD+ description") to the research project file. During the imaging, all produced images will be automatically saved into the created project .lif file.
- Open the Acquisition window. Set the white light laser (WLL) excitation wavelength and the required range of hybrid or resonance scanning detectors (HyD S, HyD X, or HyD R type) based on the known spectral properties of the measured fluorescence (excitation/absorbance and emission spectra). Choose Line or Frame types of scan.
NOTE: For most commercially available fluorescent dyes, the spectral properties can be found (or added) in the LAS X Dye Assistant package. Choose the detector with the appropriate spectra sensitivity range compatible with the probe spectral properties and, in the case of FLIM, compatible with photon counting (i.e., HyD X or HyD R). For multiparametric imaging set the WLL in multiple excitation positions (e.g., for simultaneous imaging of FAD/Flavins and two fluorescence channels of ratiometric MMIR1 O2 probe - reference and sensitive, the excitation/emission settings might be 460 nm/510-590 nm HyD X1 and 614 nm/631-690 HyD X3 and 724-800 nm HyD R accordingly in one or two sequential scan sequences). It is important to assign the appropriate detector to collect the emission, as detectors can have different spectral sensitivity54. - (Optional for FLIM) In the Acquisition window, choose FLIM mode to perform imaging combined with photon counting (decay collection). Immediately, an additional 'FLIM module in LAS X software' will be opened to navigate and analyze FLIM data.
- (Optional for FLIM) Choose the WLL pulse repetition rate based on the expected fluorophore average lifetime.
NOTE: The frequency of the laser pulse must be adjusted to collect the full fluorescence decay. This can be done using a Pulse Picker feature installed on the microscope. The overlapping of the fluorescence decay with the laser pulse will lead to the shortening of the estimated fluorescence lifetime. It is recommended to have pulse intervals of 4-5 times longer than the expected average fluorescence lifetime (e.g., 25 ns/40 MHz for lifetimes up to 5 ns). Many pulsed lasers have a fixed 80 MHz repetition rate (ideal only for a range of up to 2-3 ns). This is important for choosing the correct fluorophores for the experiment. - Start the preview imaging using FAST LIVE mode and adjust the fine focus of the imaging object on a section of interest.
CAUTION: Strictly follow the laser safety rules. Always consider laser safety rules and wait until the imaging has stopped prior to turning the transmission light on, looking into the eyepiece or at the sample.
NOTE: In FAST LIVE mode, a high-speed scan of 600 Hz (corresponds to a maximum frame rate 4.43/s if bidirectional X scanning mode is used), 256 x 256 pixels resolution are applied automatically to the image to keep the fluorescence safe from photobleaching. Open the pinhole (e.g., to 3-4 AU) and/or increase the laser intensity if the fluorescence signal is too weak to focus on the object. Avoid incomplete decay collection. - (Optional for FLIM) By looking at a pixel intensity histogram appearing during the imaging in a FLIM module window (Live mode), adjust the appropriate laser intensity/pinhole size and resolution to achieve the count rate ~1 photon/laser pulse limit (red line). Avoid going significantly higher than 1 to exclude a risk of pile-up effect. If required, adjust the WLL pulse repetition rate to have a full decay collection in a decay window (to avoid incomplete decay collection, see step 2.2.8).
NOTE: If the number of photons (intensity) is not sufficient to reconstruct a reliable decay for fitting analysis or phasor plot cloud, apply several scan repeats (frames or lines, or set up scanning time), increase laser intensity and/ or sacrifice the resolution (scanned ROI size). Be aware that decreasing the laser repetition rate requires more photons to be collected for a reliable decay reconstruction, and an additional correction of the imaging parameters may be required. Be aware of the potential impact of intense light and long continuous illumination on cell viability and metabolism55. The negative impact on viability and metabolism can be different in each individual case, depending on the intensity, duration, and wavelength of the excitation light, as well as imaging modality (e.g., one-photon confocal vs. multiphoton imaging). Adjust the imaging parameters accordingly and, if necessary, control cell viability/death by Calcein Green-AM or propidium iodide intensity in pilot experiments56. Where possible, further optimizations of the fluorescence probe staining protocol should be considered to reach an adequate fluorescence signal during live microscopy. - (Optional for 3D z-stack) While in Fast Live set the coordinates, scan direction, and attribute them to Begin and End in the Z-stack window (XYZ Scan Mode). Choose Z-step size or number of steps.
NOTE: While the software automatically calculates the 'optimal' number of steps, based on used resolution and scan parameters, live 3D reconstruction can normally require a smaller number of steps to achieve fast acquisition, e.g., 1-2 µm step size, 50-100 µm stack size, bi-directional scanning, requiring 2-3 min of the total scan time. Be aware that the subcellular organelles, cells and the 3D cell model can also move during measurements. In addition, due to the light penetration depth and scattering limits, typically only 50-100 µm scanning depth on confocal FLIM can be achieved. - When all necessary settings are applied, start imaging.
- Give the image an appropriate name.
- Search for the next imaging object in transmission light mode and repeat the imaging procedure with previously optimized imaging settings (steps 2.2.8-2.2.12).
NOTE: For the intensity-based comparison or intensity ratio analysis (e.g., MMIR O2 probe-based oxygenation analysis), always keep the same imaging settings for all analyzed objects (magnification and objective lens type, laser intensity, power and pulse frequency, excitation wavelength, detectors range, pinhole, scan speed, pixel dwell time and resolution). However, as fluorescence lifetime does not depend on fluorescence intensity and requires an appropriate number of photons to be collected for reliable calculation, the FLIM imaging parameters can be readjusted through the course of the experiment to keep the collected photon numbers comparable between different treatments or experimental conditions. Therefore, for multiparametric analysis where intensity-based and fluorescence lifetime-based analysis are both needed, optimized universal imaging settings must be applied for all objects in the compared experimental groups. For "FLIM-only" comparison it is possible to compare images acquired with slightly different imaging settings as LAS X software provides calculation of the IRF for individual image measurement42. However, for FLIM-fitting analysis outside LAS X (e.g., FLIMfit45) the instrument response function (IRF) should be measured for each different imaging condition, as it cannot be exported from the imaging software. Thus, for the simplicity of the experimental design and workload, it is recommended to apply the same imaging settings for all images in the dataset. Then, the corresponding IRF measurements can be done with the use of quenched or fast-fluorescence lifetime fluorophores (within ps range) with the emission properties of the measured spectral channel57,58,59, by gold nanoparticles luminescence60 or by second-harmonic generation signal for multiphoton FLIM61. In LAS X software, the previously optimized imaging parameters can be loaded for a new project by a right click on the file of interest and choosing Apply Image Settings. - When the imaging session is finalized, save the imaging project. To finalize the imaging session, remove the sample from the microscopy stage and clean the objective from the immersion liquid (if used) according to the standard procedure implemented in the imaging facility. Close the project and the software. Switch off the microscope, lasers, and all the connected devices.
- Proceed with imaging data analysis (step 2.3).
- Turn on the temperature climate control unit 30-60 min prior to imaging. Set the necessary speed of ventilation and temperature (35-37 °C).
- NAD(P)H/FAD-FLIM phasor image processing with LAS X FLIM module and FIJI
NOTE: The protocol describes a fluorescence lifetime analysis of imaged spheroids for frequency domain data on examples of NAD(P)H and FAD/Flavins autofluorescence FLIM. NAD(P)H autofluorescence measurement became a gold standard for metabolic analysis, where short and longer NAD(P)H autofluorescence lifetime components are associated with glycolysis or oxidative phosphorylation (OxPhos), respectively. This can be analyzed by the shift on a phasor plot along the metabolic trajectory toward the measured standards of free-NAD(P)H or protein-bound NAD(P)H31,62. To analyze the trajectory of the metabolic shift, as well as to compare the position of phasor clouds (see the NOTE below step 2.3.6) on a plot between experimental groups, a simplified phasor coordinates analysis, based on the calculation of geometrical center (centroid) of the phasor cloud was implemented29. The described protocol demonstrates the calculation of centroid coordinates in FIJI and measuring the distance between two points on a phasor plot using coordinates (e.g., the distance from a centroid of the spheroid NAD(P)H autofluorescence phasor cloud to a "free NAD(P)H" theoretical point). Similarly, FAD and other autofluorescence signals can be analyzed. A dataset 1 with .lif (LAS X software required) or .ptu file formats for learning this procedure is provided (Supplementary File 2, Supplementary File 3, Supplementary File 4, Supplementary File 5, Supplementary File 6, Supplementary File 7, Supplementary File 8, Supplementary File 9, and Supplementary File 10).- Open the FLIM module in LAS X, select Open Project, and load the spheroid image file (.lif) for autofluorescence NAD(P)H/FAD analysis.
NOTE: Due to potential bugs and intermediate data loss in the FLIM module, use a copy of the original spheroid image file (.lif) for NAD(P)H/FAD analysis, keeping the raw file unchanged. - Select a single image and navigate to the FLIM analysis interface. Click Phasor to access the phasor plot and activate the phasor analysis mode. Apply filter (Median or Wavelet) and set Threshold to minimize the noise and improve the data visibility for all phasor analyses. Choose the harmonics. For analysis of the metabolic shift based on NAD(P)H data, proceed with steps 2.3.3-2.3.5. For the general comparison of phasor plots, proceed from step 2.3.6.
NOTE: Apply analysis settings (filter type, harmonics, threshold, binning, and phasor ROIs) equally to all images in a compared data set. - (Optional for NAD(P)H analysis) Choose any dataset-related image and use the Draw Ratio Cursor for Two Components option to accurately locate the position of 0.45 ns on a universal circle of a standard phasor plot space. This position will be assigned to an average fluorescence lifetime of a pure homogeneous solution of free-NAD(P)H, which normally is close to the mono-exponential decay62.
NOTE: Free-NADH and free-NAD(P)H have similar spectral properties and similar values of fluorescence lifetime in water solution, with two short lifetime components, 0.3 ns and 0.7 ns63. Thus, for the simplicity of the phasor-based analysis and due to a small difference between lifetime components their fluorescence decay is accepted to be mono-exponential, which allows allocation of the phasor cloud on a universal circle. The reference average lifetime of a free-NAD(P)H form can also be measured and plotted in a phasor space for a similar analysis. The reference lifetime was chosen based on the literature62; note that in other sources, slightly different value of a free-NAD(P)H in solution can be found (0.4 ns64). - (Optional for NAD(P)H analysis) Export the phasor plot with allocated free-NAD(P)H lifetime (see step 2.3.3) by right-clicking on the plot and selecting Export Data. Export the phasor plot as a .tiff format file to a designated storage folder.
NOTE: The original pixel size of the exported phasor plot image from the LAS X FLIM module is always 1024 x 600 pixels. If another software is used for data export and pre-analysis, be sure that all phasor plot images are exported with the same size and resolution. - To export spheroid-related phasor cloud, utilize the Draw Cursor tool in the LAS X FLIM module to choose the spheroid ROI on the image. Export generated phasor plot as outlined in step 2.3.4.
NOTE: The corresponding g and s (similar to x and y) coordinates of the phasor space will be assigned to every pixel of the chosen ROI, according to their lifetimes, transformed into a frequency domain data set64,65. The cluster of pixels with similar values of tf (phase lifetime) and tm (modulation lifetime) will form a cloud pattern (phasor cloud) on a plot, where color coding (with a range from deep blue to red) will reflect the abundance of lifetime values. By the position of the cloud on a universal circle or inside, the mono- or multi-exponential decays can be distinguished. Some measurement media exhibit strong (auto)fluorescence, leading to the appearance of a corresponding cloud on a phasor plot, which cannot be simply removed with the means of intensity threshold. This pattern will influence centroid coordinates calculation and must be excluded from the exported phasor plot. Working with the spheroid ROI allows the exclusion of the non-related pixels from further phasor analysis. - Repeat the phasor plot export procedure for all spheroid ROIs in a data set (see steps 2.3.4 and 2.3.6). Additionally, check the exported set of .tiff images to guarantee the full set of data for further comparative analysis and ensure that all exported images have the same pixel size (see NOTE in step 2.3.4).
NOTE: At this stage of the protocol, the image set must include phasor with the free-NAD(P)H location (based on literature or empirically obtained data) and all spheroid ROI (or alternative ROI patterns if needed for the specific analysis) phasor plots. From this step, further analysis will be done in FIJI and afterward in a spreadsheet. Using the Analyze tool window, Set Scale option in FIJI, and ensure all phasor plot images are calibrated with the same unit type, e.g., only in pixels. If not, set the unit length in the Set Scale window for the chosen one (e.g., for pixel-based scale, put 1 in the Distance in Pixels field and set the unit of length to Pixel). For further comparison, measure all exported data using the same unit type. - (Optional for NAD(P)H analysis) Determine the pixel point position of a free-NAD(P)H average fluorescence lifetime on the corresponding exported phasor plot image (see step 2.3.3): Open the phasor image with FIJI, magnify the image to clearly visualize with a pixel resolution the intersection between universal semi-circle and the Ratio Cursor for Two Components line; use Rectangle ROI tool to select the intersection.
NOTE: Ensure that the rectangular selection is a small area around the point of intersection for accurate determination of its coordinates in the next step (step 2.3.9). - (Optional for NAD(P)H analysis) Open the Analyze tool, choose Set Measurements window, and select Centroid as a measurement parameter. Click on Measure in the Analyze tool window to determine the centroid coordinates of the free-NAD(P)H reference point. Export these coordinates to a spreadsheet.
NOTE: Free-NAD(P)H coordinates will be used as the reference point to compare the distances from this point to the spheroid phasor cloud position in a data set (the way to characterize the metabolic shift between glycolysis and OxPhos in NAD(P)H FLIM autofluorescence analysis) - Using FIJI, open the image of the spheroid phasor cloud. Open the Image window tool, choose Adjust, and select Color Threshold in the toolbar. Select the Thresholding Method of choice (e.g., Otsu), and set the Hue Value and Brightness Value to narrow the parameters for the selection of a phasor cloud part with the most abundant pixel coordinates. Click Select to define the cluster area.
NOTE: Keep the same threshold parameters for all phasor plot images, which must be analyzed. For the presented NAD(P)H-FLIM data, the thresholding method Otsu with set Hue Value 9 and Brightness Value 160 was chosen and applied to all phasor images. Alternatively, the selected area can be copied to ROI Manager (follow the path Edit > Selection > Add to Manager) to create a library of phasor ROIs for further analysis. - While keeping the selection, calculate the centroid coordinates of the selected area following the procedure described in step 2.3.9. Export these coordinates to the spreadsheet file.
- Repeat steps 2.3.9 and 2.3.10 to determine centroid coordinates for all ROI phasor images to create a data set in the spreadsheet.
NOTE: Using ROI Manager ROI library helps to simplify and organize the ROI analysis (see step 2.3.10) - (Optional for NAD(P)H analysis) Open the spreadsheet with exported reference free-NAD(P)H and spheroid ROIs coordinates from different comparison groups. Calculate the distance between each individual Spheroid phasor centroid to reference free-NAD(P)H position using determined coordinates and the following equation:

Where, Xc and Yc are centroid coordinates, Xf and Yf are the reference coordinates.
NOTE: Application of centroid parameter for determination of the shift toward the reference lifetime is appropriate only in case all centroids from a data set are lying on the same linear trajectory toward the reference point. To check this, all centroid points from the data set have to be plotted together with the reference point in the same coordinate space, and the linear trend alignment should be performed. If the R2 coefficient of the linear trend line drawn through all points is close to 1 (e.g., R2 is 0.8-0.99), the distance analysis is assumed to be appropriate. - Organize all data accordingly for comparison and perform statistical analysis with the use of any corresponding software (e.g., Origin, MatLab). Choose the appropriate statistical test according to the data set characteristics (distribution normality, statistical units' number, etc.).
NOTE: For NAD(P)H analysis, compare distance values to characterize the metabolic shift depending on experimental conditions. For comparison of any phasor plots between experimental groups, perform the comparison of ROI phasor cloud centroids coordinates.
- Open the FLIM module in LAS X, select Open Project, and load the spheroid image file (.lif) for autofluorescence NAD(P)H/FAD analysis.
Access restricted. Please log in or start a trial to view this content.
Results
Choosing the appropriate spheroid formation method
The selected spheroid formation method can greatly influence spheroids' size, shape, cell density, viability, and drug sensitivity (Figure 2). Previously, the effects of multiple high-throughput (SphericalPlate 5D, lab-made micromolds, and MicroTissue molds) and the 'medium throughput' low attachment (Biofloat and Lipidure-coated 96-well plates) methods were compared on spheroids viability and oxygenation
Access restricted. Please log in or start a trial to view this content.
Discussion
Multicellular spheroids are becoming a method of choice in the studies of tumor and stem cell niche microenvironments, drug discovery, and development of the 'tissue building blocks' for biofabrication. Spheroids' heterogeneous internal architecture, gradients of nutrients and oxygenation can mimic those of in vivo tissues and tumors in a relatively simplified and accessible setting. With the need for more methodological transparency26,28 and...
Access restricted. Please log in or start a trial to view this content.
Disclosures
Nothing to disclose.
Acknowledgements
This work was supported by the Special Research Fund (BOF) grants of Ghent University (BOF/STA/202009/003; BOF/IOP/2022/058), Research Foundation Flanders (FWO, I001922N) and the European Union, fliMAGIN3D-DN Horizon Europe-MSCA-DN No. 101073507.
Access restricted. Please log in or start a trial to view this content.
Materials
| Name | Company | Catalog Number | Comments |
|---|---|---|---|
| 0.05% Trypsin-EDTA | Gibco | 25300-054 | Also available from Sigma |
| 10 mL serological pipets | VWR | 612-3700 | Similar products are also available from Sarstedt, Corning, VWR and other companies |
| 12 well cell-culture plates, sterile | Greiner bio-one | 665-180 | Similar products are also available from Sarstedt, Corning and other companies. |
| 12 Well Chamber slide, removable | Ibidi | 81201 | Also available from Grace Bio-Labs, ThermoFisher Scientific and others |
| 15 mL centrifuge tubes | Nerbe plus | 02-502-3001 | Similar products are also available from Sarstedt, Corning, VWR and other companies |
| 3D Petri Dish micromolds | Microtissue | Z764000-6EA | |
| 6 well cell-culture plates, sterile | Greiner bio-one | 657160 | Similar products are also available from Sarstedt, Corning, VWR and other companies |
| 70% ethanol | ChemLab | CL02.0537.5000 | |
| Biofloat | Sarstedt | 83.3925.400 | Commercial available coated 96-well plate for spheroid formation |
| Calcein Green-AM | Tebubio | AS-89201 | Apply in dilution 1:1000 |
| CellSens Dimension software | Olympus | version 3 | |
| Collagen from human placenta, type IV | Sigma | C5533 | For the preparation of 0.07 mg/mL Collagen and 0.03 mg/mL Poly-D-lysine coated microscopy dishes |
| Confocal FLIM Microscope | Leica Microsystems | N/A | Stellaris 8 Falcon inverted microscope with white-light laser, HyD X detectors, climate / T control chamber (OkoLab), 25x/0.95 W objective |
| D(+)-Glucose | Merck | 8342 | Prepare 1 M stock solution, 1:100 for preparation of imaging medium (final concentration 10 mM) |
| Dulbecco's modified Eagle's medium (DMEM), phenol red-, glucose-, pyruvate- and glutamine-free | Sigma-Aldrich | D5030-10X1L | For preparation of imaging medium |
| Fetal Bovine Serum (FBS) | Gibco | 10270-098 | Also available from Sigma. Needs to be heat-inactivated before use. |
| HEPES (1M) | Gibco | 15630-080 | Dilution 1/100 for preparation of imaging medium (final concentration 10 mM) |
| Human colon cancer cells HCT116 | ATCC | ||
| ImageJ | NIH | version 1.54f | |
| Leica Application Suite X (LAS X) | Leica Microsystems | version 4.6.1.27508 | |
| L-glutamine | Gibco | 25030 | Also available from Sigma. Apply in dilution 1:100. |
| Lipidure-CM5206 | Amsbio | AMS.52000034GB1G | |
| McCoy's 5A, need addition of 1 mM Sodium Pyruvate and 10 mM HEPES | VWR | 392-0420 | Standard growth medium for HCT116 cells |
| micro-patterned 3D-printed PDMS stamps | N/A | N/A | Provided by the Centre for Microsystems Technology, Professor Dr. Jan Vanfleteren, Ghent University |
| NaCl | Chemlab | CL00.1429.100 | |
| Neubauer couting chamber | Fisher Scientific | 15980396 | |
| O2 probes: MMIR1 | N/A | N/A | Full characterization, validation and some applications can be found at: https://www.biorxiv.org/content/10.1101/2023.12.11.571110 v1 |
| PBS | Fisher scientific | Gibco18912014 | Dissolve PBS tablet in 500 mL of distilled water. |
| Pen Strep :Penicillin (10,000 U/mL) / streptomycin (10,000 μg/mL) 100x solution | Gibco | 15140-122 | Also available from Sigma. Apply in dilution 1:100. |
| Poly-D-lysine | Sigma | P6407-5mg | For the preparation of 0.07 mg/mL Collagen and 0.03 mg/mL Poly-D-lysine coated microscopy dishes |
| Propidium Iodide | Sigma-Aldrich | 25535-16-4 | Cell death staining, use 1 µg/mL at 1h incubation |
| PVDF syringe filter 0.22 µm | Novolab | A35149 | Similar products are also available from Sarstedt, Corning, VWR and other companies |
| Sodium pyruvate (100 mM) | Gibco | 11360-070 | Dilution 1/100 for preparation of imaging medium (final concentration 1mM) |
| SphericalPlate 5D 24-well | Kugelmeiers | SP5D-24W | |
| sterile petridish | Greiner bio-one | 633181 | Similar products are also available from Sarstedt, Corning, VWR and other companies |
| Tissue culture flask (25 cm² ) | VWR | 734-2311 | Similar products are also available from Sarstedt, Corning, VWR and other companies |
| Tissue culture flask (75 cm²) | VWR | 734-2313 | Similar products are also available from Sarstedt, Corning, VWR and other companies |
| U-bottom 96-well plate | VWR | 10062-900 | Similar products are also available from Sarstedt, Corning, Greiner Bio-one and other companies |
| Ultrapure Agarose | Invitrogen (Life Technologies) | 16500-500 | Other types of Agarose such as Agarose low melting point (A-9414, Sigma), Agarose for routine use (A-9539, Sigma) |
| Widefield fluorescence inverted microscope | Olympus | N/A | Inverted fluorescence microscope IX81, with motorised Z-axis control, CoolLED pE4000 (16 channels, 365-770 nm), ORCA-Flash4.0LT (Hamamatsu) cMOS camera, glass warming plate Okolab, CellSens Dimension v.3 software and air objectives 4x/0.13 UPlanFLN and 40x/0.6 LUCPlanFLN. (Optional, for high-resolution imaging) 60x/1.0 LUMPLFLN water |
References
- Foty, R. A simple hanging drop cell culture protocol for generation of 3d spheroids. J Vis Exp. (51), e2720(2011).
- Moskovits, N., et al. Establishing 3-dimensional spheroids from patient-derived tumor samples and evaluating their sensitivity to drugs. J Vis Exp. (190), e64564(2022).
- Griner, L. M., et al. Generation of high-throughput three-dimensional tumor spheroids for drug screening. J Vis Exp. (139), e57476(2018).
- Qian, Y., Wei, X., Chen, K., Xu, M. Three-dimensional acoustic assembly device for mass manufacturing of cell spheroids. J Vis Exp. (200), e66078(2023).
- He, H., et al. Dynamic formation of cellular aggregates of chondrocytes and mesenchymal stem cells in spinner flask. Cell Prolif. 52 (4), e12587(2019).
- Perez, J. E., Nagle, I., Wilhelm, C. Magnetic molding of tumor spheroids: Emerging model for cancer screening. Biofabrication. 13 (1), 015018(2020).
- Kingsley, D. M., et al. Laser-based 3d bioprinting for spatial and size control of tumor spheroids and embryoid bodies. Acta Biomater. 95, 357-370 (2019).
- Guillaume, O., et al. Hybrid spheroid microscaffolds as modular tissue units to build macro-tissue assemblies for tissue engineering. Acta Biomater. 165, 72-85 (2023).
- Danilevicius, P., et al. laser-made 3D microscaffolds for tissue spheroid encagement. Biointerphases. 10 (2), 021011(2015).
- Jamieson, L. E., Harrison, D. J., Campbell, C. Chemical analysis of multicellular tumour spheroids. Analyst. 140 (12), 3910-3920 (2015).
- Dmitriev, R., Borisov, S., Jenkins, J., Papkovsky, D. Multiparametric imaging of tumor spheroids with ultra-bright and tunable nanoparticle O2 probes. SPIE BiOS. 9328, (2015).
- Zushin, P. -J. H., Mukherjee, S., Wu, J. C. FDA Modernization Act 2.0: transitioning beyond animal models with human cells, organoids, and AI/ML-based approaches. J Clin Invest. 133 (21), e175824(2023).
- Kim, D. -S., et al. Robust enhancement of neural differentiation from human es and ips cells regardless of their innate difference in differentiation propensity. Stem Cell Rev Rep. 6 (2), 270-281 (2010).
- Hart, D., Gutiérrez, D. R., Biason-Lauber, A. Generation of a human ovarian granulosa cell model from induced pluripotent stem cells. bioRxiv. , 2022(2022).
- Chiaradia, I., et al. Tissue morphology influences the temporal program of human brain organoid development. Cell Stem Cell. 30 (10), 1351-1367 (2023).
- Wagstaff, E. L., Ten Asbroek, A. L., Ten Brink, J. B., Jansonius, N. M., Bergen, A. A. An alternative approach to produce versatile retinal organoids with accelerated ganglion cell development. Sci Rep. 11 (1), 1101(2021).
- Thavandiran, N., et al. Design and formulation of functional pluripotent stem cell-derived cardiac microtissues. Proc Natl Acad Sci U S A. 110 (49), E4698-E4707 (2013).
- Harrison, S. P., et al. Scalable production of tissue-like vascularized liver organoids from human pscs. Exp Mol Med. 55 (9), 2005-2024 (2023).
- Noguchi, T. -A. K., Kurisaki, A. Formation of stomach tissue by organoid culture using mouse embryonic stem cells. Methods Mol Biol. 2017, 217-228 (2017).
- Takahashi, J., et al. Suspension culture in a rotating bioreactor for efficient generation of human intestinal organoids. Cell Reports Methods. 2 (11), 100337(2022).
- Lagziel, S., Gottlieb, E., Shlomi, T. Mind your media. Nat Metab. 2 (12), 1369-1372 (2020).
- Das, V., Fürst, T., Gurská, S., Džubák, P., Hajdúch, M. Reproducibility of uniform spheroid formation in 384-well plates: The effect of medium evaporation. J Biomol Screen. 21 (9), 923-930 (2016).
- Bera, K., et al. Extracellular fluid viscosity enhances cell migration and cancer dissemination. Nature. 611 (7935), 365-373 (2022).
- Michl, J., Park, K. C., Swietach, P. Evidence-based guidelines for controlling ph in mammalian live-cell culture systems. Commun Biol. 2, 144(2019).
- Okkelman, I. A., Vercruysse, C., Kondrashina, A. V., Borisov, S. M., Dmitriev, R. I. Affordable oxygen microscopy-assisted biofabrication of multicellular spheroids. J Vis Exp. (182), e63403(2022).
- Peirsman, A., et al. Mispheroid: A knowledgebase and transparency tool for minimum information in spheroid identity. Nat Methods. 18 (11), 1294-1303 (2021).
- Raghavan, S., et al. Comparative analysis of tumor spheroid generation techniques for differential in vitro drug toxicity. Oncotarget. 7 (13), 16948(2016).
- Froehlich, K., et al. Generation of multicellular breast cancer tumor spheroids: Comparison of different protocols. J Mammary Gland Biol Neoplasia. 21 (3-4), 89-98 (2016).
- Debruyne, A. C., et al. Live microscopy of multicellular spheroids with the multimodal near-infrared nanoparticles reveals differences in oxygenation gradients. ACS Nano. 18 (19), 12168-12186 (2024).
- Debruyne, A. C., Okkelman, I. A., Dmitriev, R. I. Balance between the cell viability and death in 3D. Semin Cell Dev Biol. 144, 55-66 (2023).
- Barroso, M., Monaghan, M. G., Niesner, R., Dmitriev, R. I. Probing organoid metabolism using fluorescence lifetime imaging microscopy (flim): The next frontier of drug discovery and disease understanding. Adv Drug Deliv Rev. 201, 115081(2023).
- Becker, W. Fluorescence lifetime imaging-techniques and applications. J Microsc. 247 (2), 119-136 (2012).
- Dmitriev, R. I., Intes, X., Barroso, M. M. Luminescence lifetime imaging of three-dimensional biological objects. J Cell Sci. 134 (9), 1-17 (2021).
- Sarder, P., Maji, D., Achilefu, S. Molecular probes for fluorescence lifetime imaging. Bioconjug Chem. 26 (6), 963-974 (2015).
- Alfonso-Garcia, A., et al. Mesoscopic fluorescence lifetime imaging: Fundamental principles, clinical applications and future directions. J Biophotonics. 14 (6), e202000472(2021).
- Datta, R., Heaster, T. M., Sharick, J. T., Gillette, A. A., Skala, M. C. Fluorescence lifetime imaging microscopy: Fundamentals and advances in instrumentation, analysis, and applications. J Biomed Opt. 25 (7), 1-43 (2020).
- Yellen, G. Fueling thought: Management of glycolysis and oxidative phosphorylation in neuronal metabolism. J Cell Biol. 217 (7), 2235-2246 (2018).
- Heikal, A. A. Intracellular coenzymes as natural biomarkers for metabolic activities and mitochondrial anomalies. Biomark Med. 4 (2), 241-263 (2010).
- Kolenc, O. I., Quinn, K. P. Evaluating cell metabolism through autofluorescence imaging of nad (p) h and fad. Antioxid Redox Signal. 30 (6), 875-889 (2019).
- Verma, A., et al. Fluorescence lifetime imaging for quantification of targeted drug delivery in varying tumor microenvironments. bioRxiv. , 2024(2024).
- Smith, J. T., et al. In vivo quantitative fret small animal imaging: Intensity versus lifetime-based fret. Biophys Rep. 3 (2), 100110(2023).
- Alvarez, L. A., et al. Application Note: SP8 Falcon: A novel concept in fluorescence lifetime imaging enabling video-rate confocal flim. Nat Methods. , (2019).
- Roberti, M. J., et al. TauSense: A fluorescence lifetime-based tool set for everyday imaging. Nat. Methods. , https://www.nature.com/articles/d42473-020-00364-w.pdf (2020).
- Auer, J. M. T., Murphy, L. C., Xiao, D., Li, D. U., Wheeler, A. P. Non-fitting flim-fret facilitates analysis of protein interactions in live zebrafish embryos. J Microsc. 291 (1), 43-56 (2023).
- Warren, S. C., et al. Rapid global fitting of large fluorescence lifetime imaging microscopy datasets. PLoS One. 8 (8), e70687(2013).
- Gao, D., et al. Flimj: An open-source imagej toolkit for fluorescence lifetime image data analysis. PloS One. 15 (12), e0238327(2020).
- Tullis, I. D. C., Ameer-Beg, S. M., Barber, P. R., Rankov, V., Vojnovic, B. Mapping femtosecond pulse front distortion and group velocity dispersion in multiphoton microscopy. Proc. SPIE 6089, Multiphoton Microscopy in the Biomedical Sciences VI. , 60890(2006).
- Zhou, Y., et al. One-step derivation of functional mesenchymal stem cells from human pluripotent stem cells. Bio Protoc. 8 (22), e3080(2018).
- Benton, G., Arnaoutova, I., George, J., Kleinman, H. K., Koblinski, J. Matrigel: From discovery and ECM mimicry to assays and models for cancer research. Adv Drug Deliv Rev. 79-80, 3-18 (2014).
- Badea, M. A., et al. Influence of matrigel on single-and multiple-spheroid cultures in breast cancer research. SLAS Discov. 24 (5), 563-578 (2019).
- Lang, S., Sharrard, R., Stark, M., Villette, J., Maitland, N. Prostate epithelial cell lines form spheroids with evidence of glandular differentiation in three-dimensional matrigel cultures. Br J Cancer. 85 (4), 590-599 (2001).
- Barra, J., et al. DMT1-dependent endosome-mitochondria interactions regulate mitochondrial iron translocation and metastatic outgrowth. Oncogene. 43 (9), 650-667 (2024).
- Dmitriev, R. I., Papkovsky, D. B. Intracellular probes for imaging oxygen concentration: How good are they. Methods Appl Fluoresc. 3 (3), 034001(2015).
- Schweikhard, V., et al. Application Note: The power HyD family of detectors for confocal microscopy. Nat Methods. , https://www.nature.com/articles/d42473-020-00398-0 (2020).
- Alam, S. R., Wallrabe, H., Christopher, K. G., Siller, K. H., Periasamy, A. Characterization of mitochondrial dysfunction due to laser damage by 2-photon flim microscopy. Sci Rep. 12 (1), 11938(2022).
- Bush, P. G., Wokosin, D. L., Hall, A. C. Two-versus one photon excitation laser scanning microscopy: Critical importance of excitation wavelength. Front Biosci. 12, 2646-2657 (2007).
- Liu, M., et al. Instrument response standard in time-resolved fluorescence spectroscopy at visible wavelength: Quenched fluorescein sodium. Appl Spectrosc. 68 (5), 577-583 (2014).
- Szabelski, M., et al. Collisional quenching of erythrosine b as a potential reference dye for impulse response function evaluation. Appl Spectrosc. 63 (3), 363-368 (2009).
- Chib, R., et al. Standard reference for instrument response function in fluorescence lifetime measurements in visible and near infrared. Meas Sci Technol. 27 (2), 027001(2015).
- Talbot, C. B., et al. Application of ultrafast gold luminescence to measuring the instrument response function for multispectral multiphoton fluorescence lifetime imaging. Opt Express. 19 (15), 13848-13861 (2011).
- Becker, W. Recording the instrument response function of a multiphoton flim system. Becker & Hickl. , Available from: https://www.becker-hickl.com/literature/application-notes/recording-the-instrument-response-function-of-a-multiphoton-flim-system/ (2007).
- Leben, R., Köhler, M., Radbruch, H., Hauser, A. E., Niesner, R. A. Systematic enzyme mapping of cellular metabolism by phasor-analyzed label-free nad (p) h fluorescence lifetime imaging. Int J Mol Sci. 20 (22), 5565(2019).
- Blacker, T. S., Duchen, M. R. Investigating mitochondrial redox state using nadh and nadph autofluorescence. Free Radic Biol Med. 100, 53-65 (2016).
- Gottlieb, D., Asadipour, B., Kostina, P., Ung, T. P. L., Stringari, C. FLUTE: A python gui for interactive phasor analysis of flim data. Biol Imaging. 3, e21(2023).
- Malacrida, L., Ranjit, S., Jameson, D. M., Gratton, E. The phasor plot: A universal circle to advance fluorescence lifetime analysis and interpretation. Annu Rev Biophys. 50, 575-593 (2021).
- Okkelman, I., Vandenberghe, W., Dmitriev, R. Role of preconditioning with oxygen and glucose deprivation in promoting differentiation of dental pulp stem cells in 3D culture. Mol Biol Cell. 34 (2), 1212(2022).
- Park, J. H., et al. The effect of bmp-mimetic peptide tethering bioinks on the differentiation of dental pulp stem cells (DPSCs) in 3D bioprinted dental constructs. Biofabrication. 12 (3), 035029(2020).
- Pașca, S. P. The rise of three-dimensional human brain cultures. Nature. 553 (7689), 437-445 (2018).
- Dmitriev, R. I., Zhdanov, A. V., Nolan, Y. M., Papkovsky, D. B. Imaging of neurosphere oxygenation with phosphorescent probes. Biomaterials. 34 (37), 9307-9317 (2013).
- Bryanskaya, E. O., et al. High levels of FAD autofluorescence indicate pathology preceding cell death. Biochim Biophys Acta Gen Subj. 1868 (1), 130520(2024).
- Han, S. J., Kwon, S., Kim, K. S. Challenges of applying multicellular tumor spheroids in preclinical phase. Cancer Cell Int. 21 (1), 152(2021).
- Okkelman, I. A., Neto, N., Papkovsky, D. B., Monaghan, M. G., Dmitriev, R. I. A deeper understanding of intestinal organoid metabolism revealed by combining fluorescence lifetime imaging microscopy (flim) and extracellular flux analyses. Redox Biol. 30, 101420(2020).
- Gstraunthaler, G., Seppi, T., Pfaller, W. Impact of culture conditions, culture media volumes, and glucose content on metabolic properties of renal epithelial cell cultures: Are renal cells in tissue culture hypoxic. Cell Physiol Biochem. 9 (3), 150-172 (1999).
- Glickman, R. D. Phototoxicity to the retina: Mechanisms of damage. Int J Toxicol. 21 (6), 473-490 (2002).
- Golub, A. S., Pittman, R. N. Monitoring Parameters of Oxygen Transport to Cells in the Microcirculation. Quenched-Phosphorescence Detection of Molecular Oxygen: Applications in Life Sciences. , The Royal Society of Chemistry. (2018).
- Nishigaki, T., Wood, C. D., Shiba, K., Baba, S. A., Darszon, A. Stroboscopic illumination using light-emitting diodes reduces phototoxicity in fluorescence cell imaging. Biotechniques. 41 (2), 191-197 (2006).
- Penjweini, R., Loew, H. G., Hamblin, M. R., Kratky, K. W. Long-term monitoring of live cell proliferation in presence of pvp-hypericin: A new strategy using ms pulses of led and the fluorescent dye cfse. J Microsc. 245 (1), 100-108 (2012).
- Carrasco Kind, M., et al. flimview: A software framework to handle, visualize and analyze flim data. F1000Research. 9, 574(2020).
- Schrimpf, W., Barth, A., Hendrix, J., Lamb, D. C. Pam: A framework for integrated analysis of imaging, single-molecule, and ensemble fluorescence data. Biophys J. 114 (7), 1518-1528 (2018).
- Chen, S. -J., Sinsuebphon, N., Barroso, M., Intes, X., Michalet, X. Optical Molecular Probes, Imaging and Drug Delivery. , Optica Publishing Group. (2021).
Access restricted. Please log in or start a trial to view this content.
Reprints and Permissions
