Bacteriophages, ubiquitous and diverse on Earth, infect and replicate within bacterial hosts, playing a crucial role in microbial ecosystems. Despite their importance, their presence may disrupt industrial processes. We have developed a method using bacterial lipopolysaccharides to eliminate bacteriophages from Salmonella cultures.
Method Article
Bacteriophage Removal from Infected Salmonella Cultures
In This Article
Summary
Abstract
Bacteriophages, or simply phages, play a vital role in microbial environments, impacting bacterial populations and shaping their evolution and interactions. These organisms are viruses that infect and replicate within bacterial hosts. Phages are ubiquitous on Earth, highly diverse, and very abundant. While bacteriophages have valuable roles in different environments and are a key area of research in microbiology and ecology, their presence can be undesirable in certain industrial processes or products. Considering the abundance and ubiquity of bacteriophages on Earth, the design of procedures for the removal of bacteriophages from bacterial cultures is crucial in diverse laboratory and industrial applications to preserve the integrity of the cultures and ensure accurate experimental results or product quality. Here, we have fine-tuned a protocol to eliminate the bacteriophages from infected Salmonella enterica cultures, using a strategy based on the use of lipopolysaccharides (LPS) located in the outer membrane of Gram-negative bacteria. Bacterial LPS plays an important role in host recognition by phages, and we make use of this property to design an effective procedure for the removal of phages, which use LPS as a receptor, in Salmonella bacterial cultures.
Introduction
Microbial populations are faced with multiple challenges in natural environments, and an especially severe threat is the potential of infection by bacteriophages, the viruses that infect bacteria1. These viruses are widespread on the planet, exhibiting great diversity and abundance2,3,4,5. Although bacteriophages are diverse in size, morphology, and genomic organization, all share the same structure: a DNA or RNA genome enveloped by a capsid formed by phage-encoded proteins6. Bacteria have evolved a diverse array of defense mechanisms against them7. A key aspect of bacteriophage infection, which is relevant for characterization as well as for detection, is the receptor binding domains present on tail fibers. Bacteriophages have proteins on their surface called receptor-binding proteins or tail fibers for recognizing and binding to specific receptor sites on the surface of the bacterial cell. In the case of Gram-negative bacteria, the recognition of surface structures, such as lipopolysaccharides (LPS), outer membrane proteins, pili, and/or flagella, are involved in phage-bacteria interaction8. This interaction between bacteriophages and bacteria is highly specific and depends mainly on their ability to attach to host surfaces. The O-antigen of lipopolysaccharide is a commonly used receptor9.
The investigation of bacteriophage-bacteria interactions is not only fascinating from a biological standpoint but also has practical applications in areas such as phage therapy and biotechnology. While bacteriophages have valuable roles in various contexts, for example, altering microbial populations10, their presence can be undesirable in certain industrial processes. In pharmaceuticals, biotechnology, and food production, the presence of bacteriophages can impact the quality and safety of the final products, making their removal essential to meet quality standards. In bioprocessing and biomanufacturing, where bacterial cultures are used to produce various compounds (e.g., proteins, enzymes, or antibiotics), the presence of bacteriophages can lead to the disruption of production processes due to their ability to balance the bacterial population in every shared environment. Phages can occasionally turn the industrial microbiologist's professional life into a nightmare11. The design of effective procedures to remove phages is critical to ensure consistent and reliable production, enhancing process efficiency. Apart from these industrial aspects, in a research laboratory setting, where precision and reproducibility are crucial, the elimination of bacteriophages is essential for obtaining accurate and reliable results. Furthermore, the removal of phages can also be used to simulate varying environments to test different hypotheses12. Removing phages can also be very useful in the research environment since many phage-based studies, such as the enumeration of bacteria following phage application, would benefit from a step to remove phages in order to produce much more reliable viable counts.
Phage removal based on colony isolation would take several days to ensure that colonies are phage-free, whereas the procedure described here allows the generation of phage-free cultures in hours. This protocol permits us to follow the evolution of bacterial cultures without stopping them from isolating colonies. In this sense, it is possible to simulate fluctuating environments (presence and/or absence of phages) to test different hypotheses. Furthermore, this protocol permits the qualitative and quantitative analysis of the presence of phages in a bacterial culture.
In summary, designing cost-effective procedures for the removal of bacteriophages is crucial for maintaining product quality, safety, and process efficiency in various industries and for advances in basic and applied research. Here, we describe a highly effective protocol based on the use of LPS for the removal of bacteriophages, which use LPS as a receptor, from infected Salmonella cultures, which is both time-efficient and requires minimal equipment.
Protocol
NOTE: Prior to performing the procedure of elimination of phages, we describe the preparation of a Salmonella culture infected with 9NA bacteriophages. In Figure 1, a general representation of the complete procedure for bacteriophage removal in bacterial cultures is illustrated.
1. Preparation of Salmonella cultures infected with bacteriophages
- Bacterial culture preparation
NOTE: In this study, Salmonella enterica subsp. enterica serovar Typhimurium strain ATCC 14028 opvAB::lacZ (SV8011)13 was used.- Slowly thaw the vial retrieved from -80 °C that contains the S. enterica strain of interest by placing it on ice.
- Streak out the S. enterica strain from the thawed dimethyl sulfoxide stock onto a Lennox broth (LB) plate (10 g/L tryptone, 5 g/L NaCl, 5 g/L yeast extract, and 15 g/L agar, see Table of Materials). Incubate the plate at 37 °C for 24 h.
- Using an inoculation needle, transfer a colony from the S. enterica plate and inoculate it into 5 mL of liquid LB in a glass tube. Incubate at 37 °C for 24 h with aeration by shaking at 200 rpm.
- Bacteriophage preparation
NOTE: Bacteriophage 9NA, which belongs to the family Siphoviridae (order Caudovirales)14, was used in this protocol. Notably, other Salmonella enterica bacteriophages that use the O-antigen of the lipopolysaccharide as a receptor can be used.- Prepare the bacteriophage broth by adding 0.1 mL of concentrated bacteriophage lysate to a mixture of 100 mL of nutrient broth (NB; 5 g/L peptone and 3 g/L yeast extract), 2 mL of 50x E salts (38.78 mM MgSO47 H2O, 520.5 mM Citric acidH2O, 2.87 M K2HPO4 anhydrous and 829 mM NaNH4HPO44 H2O) and 0.4 mL of 50% glucose. Mix thoroughly by inversion.
- A representative example of bacteriophage concentration could be 109 PFU/mL (Plaque Forming Units/mL), but lower concentrations can be used with similar results (see Table of Materials). Estimate bacteriophage concentration following step 1.2.3.
- Prepare lysate by following the steps described below.
- Prepare the S. enterica inoculum in 5 mL of LB (10 g/L tryptone, 5 g/L NaCl, and 5 g/L yeast extract). Incubate at 37 °C and 200 rpm for 24 h.
- Mix 4 mL of bacteriophage broth with 1 mL of the overnight culture of S. enterica. Incubate the mix at 37 °C and 200 rpm for 8 h.
- To discriminate between bacteria and bacteriophages, centrifuge the mix at 2,377 x g for 20 min. Recover the supernatant in a glass tube, add 800 µL of chloroform (see Table of Materials), and vortex it. Make sure to only transfer the upper phase when a mixture with chloroform is used.
NOTE: It is important to prevent the transfer of residual chloroform, which could affect the efficiency of the procedure. The chloroform step is common in both isolation and propagation protocols as a way of maximizing released phages. However, chloroform may inactivate some phages or destroy their infectivity15. Therefore, this step is only applicable to phages resistant to chloroform. - Maintain the lysates at room temperature for 2 h and then store them at 4 °C.
- Titrate the lysate to quantify the number of bacteriophages/number of PFU per mL present in the prepared lysate. To do this, perform the overlay technique described below.
- Prepare 5 mL of LB of inoculum for S. enterica. Incubate at 37 °C for 24 h with aeration by shaking at 200 rpm.
- Perform serial dilutions of the lysate into LB to reach a countable number of PFU/mL. To determine the necessary dilution factors, identify the initial bacteriophage lysate concentrated. For a representative example of bacteriophage concentration at around 109 PFU/mL, the dilution factors that result in a countable number of plaques are between 106-1010.
- Add 100 µL of the appropriate lysate dilution and 60 µL of the overnight culture of S. enterica prepared the day before to 5 mL of LB soft agar, prepared by mixing liquid LB and LB-agar in a proportion 1:1 and maintaining at 56 °C to avoid solidification. Mix carefully, avoiding bubbles.
- Pour each mix into the top of an LB plate and keep on the bench until the medium solidifies.
- Incubate plates for 24 h at 37 °C. Count the number of plaques on each plate. To determine the number of PFU/mL, multiply the number of plaques of each plate by the dilution factor (FD). To ensure efficient phage infection, 109-1012 PFU/mL are necessary.
PFU/mL= No. plaques in the plate x FD
- Prepare the bacteriophage broth by adding 0.1 mL of concentrated bacteriophage lysate to a mixture of 100 mL of nutrient broth (NB; 5 g/L peptone and 3 g/L yeast extract), 2 mL of 50x E salts (38.78 mM MgSO47 H2O, 520.5 mM Citric acidH2O, 2.87 M K2HPO4 anhydrous and 829 mM NaNH4HPO44 H2O) and 0.4 mL of 50% glucose. Mix thoroughly by inversion.
- Infection of Salmonella cultures with bacteriophages
- Dilute an overnight culture of S. enterica to 1:100 in a final volume of 5 mL of LB and add 0.1 mL of lysate (concentrated at 109-1012 PFU/mL). Incubate at 37 °C and 200 rpm for 24 h.
- Determination of phage titer as PFU in plate assay
- To quantify the number of bacteriophages in the infected culture, perform plate assays to determine the phage titer as PFU/mL as described below.
- Transfer 1 mL of the culture to a tube. Centrifuge at 17,115 x g for 2 min and pour the supernatant into a new labeled vial.
- Add 100 µL of chloroform to the vial and vortex to remove bacterial debris from the solution. Follow step 1.2.3.
- To quantify the number of bacteriophages in the infected culture, perform plate assays to determine the phage titer as PFU/mL as described below.
2. Bacteriophage removal from infected Salmonella enterica cultures (see Figure 2)
NOTE: To monitor the bacteriophage removal process, different aliquots are taken throughout the cleaning protocol for titration. In total, there are eight aliquots to confirm that the number of PFU/mL is decreasing throughout the cleaning process until complete elimination.
- Removal of bacteriophage in suspension
- Dilute the bacterial culture containing phages to 1:100 in 5 mL of 0.22 µm-filtered LB in a 50 mL conical centrifuge tube. Titration point 1: This is the first aliquot for titration (the starting infected Salmonella culture).
- Centrifuge the suspension for 10 min at 2,377 x g. Carefully remove the supernatant. Do not use a pipette; pour the tube. Try to leave some volume at the bottom of the conical centrifuge tube to ensure the presence of cells.
- Wash bacterial cells with 10 mL of 0.22 µm-filtered LB medium. Repeat centrifugation and washing steps 3x. Resuspend the pellet in 5 mL of 0.22 µm-filtered LB. Titration point 2: This is the second aliquot for titration.
- Transfer 50 µL of the above bacterial suspension through a sterile 0.45 µm filter (see Table of Materials) using a vacuum filtration system. Rinse the filter with 100 mL of 0.22 µm-filtered LB.
NOTE: The head size of bacteriophage 9NA is 0.067 µm. In contrast, Salmonella is 2-5 µm long and 0.5-1.5 µm wide. Thus, if 0.45 µm membranes are used, most bacteria will not pass because they are larger than 0.45 µm, while most phages will pass through the 0.45 µm filter pores.
- Removal of bacteriophage contained inside Salmonella cells
- To facilitate phage release from bacteria cells, incubate the 0.45 µm filter containing cells for 2 h at 37 °C inside the incubator without disassembling the system.
NOTE: This step of incubation is required to promote the lysis of the infected bacteria and the release of intracellular phages into the filter. - Wash the 0.45 µm filter using a vacuum filtration system, rinsing the filter with 100 mL of 0.22 µm-filtered LB.
- Recover bacterial cells from the filter in 2 mL of 2x LB (20 g/L tryptone, 10 g/L NaCl, 10 g/L yeast extract; see Table of Materials). To do this, transfer the 0.45 µm filter to a flask using sterile forceps. Then, add 2 mL of 2x LB over the filter and pipette several times to release cells from the filter.
- Centrifuge 1 mL of this suspension for 2 min at 10,354 x g. Discard the supernatant and wash bacterial cells 3x with 1 mL of filtered LB medium. Resuspend cells in 1 mL of 2x LB. Titration point 3: This is the third aliquot for titration.
NOTE: The use of a more concentrated LB (2x LB) is highly recommended because, as described below, commercial lipopolysaccharide (LPS) will be added, and this LPS dissolves in water, thus diluting the medium.
- To facilitate phage release from bacteria cells, incubate the 0.45 µm filter containing cells for 2 h at 37 °C inside the incubator without disassembling the system.
- Avoid reinfection by deceiving the bacteriophages released from bacterial cells with commercial lipopolysaccharide as described below.
- Incubate 20 µL of the bacterial suspension in the presence of a commercial S. enterica lipopolysaccharide (LPS; see Table of Materials) to a final concentration of 3.75 mg/mL in 1 mL of 0.22 µm-filtered LB for 2 h at 37 °C with shaking at 200 rpm.
NOTE: Phages released from cells into the medium may bind to the commercial S. enterica LPS instead of bacterial LPS. - After 2 h of incubation, transfer 1 mL of culture to a microcentrifuge tube and centrifuge the suspension for 2 min at 10,354 x g. Titration point 4: Use the supernatant as the fourth aliquot for titration.
- Wash pellet 3x with 1 mL of filtered LB medium.
- After washing, resuspend the pellet in 1 mL of 2x LB. Incubate 20 µL of this mix in 1 mL of 0.22 µm-filtered LB with 0.8 mg/mL of commercial LPS for 2 h at 37 °C with shaking at 200 rpm. Titration point 5: Use the rest of the bacterial suspension for the fifth titration.
- After 2 h of incubation, transfer 1 mL of culture to a microcentrifuge tube and pellet by centrifugation for 2 min at 10,354 x g. Titration point 6: Use the supernatant as the sixth aliquot for titration by pouring the supernatant into a new vial.
- Wash bacterial cells 3x with filtered LB. After washing, resuspend collected cells in 1 mL of 0.22 µm-filtered LB.
- Pass 1 mL of bacterial suspension through a sterile 0.45 µm filter using a vacuum filtration system. Rinse the filter using 100 mL of 0.22 µm-filtered LB.
- Recover cells from the 0.45 µm filter in 2 mL of 2x LB medium. To that end, transfer the 0.45 µm filter to a flask using sterile forceps. Then, add 2 mL of 2x LB over the filter and pipette several times to try to release cells from the filter.
- Pellet 1 mL of cells by centrifugation for 2 min at 10,354 x g. Wash 3x with 0.22 µm-filtered LB. After washing, resuspend collected cells in 1 mL of 2x LB. Titration point 7: This is the seventh aliquot for titration. This aliquot will inform about the efficiency of removal of phages in bacterial cultures.
- Incubate 20 µL of the bacterial suspension in the presence of a commercial S. enterica lipopolysaccharide (LPS; see Table of Materials) to a final concentration of 3.75 mg/mL in 1 mL of 0.22 µm-filtered LB for 2 h at 37 °C with shaking at 200 rpm.
3. Preparation of bacteriophage-free Salmonella culture after bacteriophage removal
- Prepare the phage-free inoculum. Add 100 µL of cells from the bacterial suspension to 900 µL of LB containing 0.45 mg/mL LPS. Incubate at 37 °C for 24 h with shaking at 200 rpm.
- Titration point 8: Prepare the eighth aliquot for titration (the final potential un-infected culture). This point is to confirm the absence of phage re-infection.
Results
Salmonella enterica and other Gram-negative bacteria have an outer membrane containing LPS. The O-antigen of LPS is a commonly used receptor by bacteriophages 9NA to infect Salmonella cultures16,17.
Given the specific affinity of bacteriophages for the O-antigen or core polysaccharide regions of LPS, we wanted to examine whether Salmonella enterica commercial LPS could be used as a decoy to exclude 9NA bacteriophages. To do it, we mixed known concentrations of the commercial LPS and 9NA lysate, followed by a titration. Commercial LPS and 9NA bacteriophages were mixed in a total volume of 200 µL and incubated for 2 h at 37 °C without shaking. For titration, 100 µL of the LPS-9NA mixture and 60 µL of an overnight culture were added to 5 mL of LB soft agar and poured onto the top of an LB plate. Plates were incubated for 24 h at 37 °C. As displayed in Figure 3, the lysate titer decreases proportionally when the concentration of S. enterica commercial LPS increases. These results indicate that the commercial LPS functions correctly as a decoy for 9NA bacteriophages.
Interestingly, the time required for phage 9NA to lyse Salmonella cells and release phages is facilitated by the number of bacteria and phages (Figure 4). In order to study how this aspect could affect the phage removal protocol, we tested different bacteria: phage ratios (1:1, 1:10, 1:100, and 1:1000). As seen in Figure 4, there is a drop in OD600 nm of the culture at 1.5-2.5 h after the addition of 9NA phage. OD600 nm values nearing zero are indicative that the bacterial culture is being lysed18. For this reason, incubation times in this protocol were defined as 2 h in order to ensure sufficient time for phage contained inside Salmonella cells to lyse bacteria and be released. This time should be estimated for each host-phage system prior to performing this protocol.
Once we determined that commercial LPS works as a decoy and the lysis time for 9NA infected bacteria, we performed the protocol described for cleaning infected Salmonella cultures of the bacteriophages (Figure 1 and Figure 2). In order to monitor the presence of bacteriophages along each step of the protocol, we did plaque assays to calculate the infectivity of the resulting cultures in 100 µL of the resulting mixture at different points (Figure 5). We can observe that repeated washing and filtering are not sufficient for the elimination of bacteriophages from cultures (titration points 1-3); however, the number of phages decreases as soon as we employ a step of incubation with commercial LPS (titration point 4). The crucial step for the complete removal of bacteriophages in a bacterial culture is the second incubation with commercial LPS (titration point 6). This step is essential for successful removal of 9NA bacteriophage in Salmonella cultures.
An interesting aspect of this protocol would be to know the level of phage resistance after phage removal steps. A procedure that separates phages from phage-resistant bacteria has no utility. For this reason, it is crucial to reveal that the bacteria remaining in the culture is phage-susceptible. To demonstrate that susceptible-phage cells remain in the cultures after the procedure, we used Evans Blue Uranine (EBU) plate assay to screen for phage contamination19. EBU plates were made of LB medium supplemented with 10 mL/L K2HPO4 25%, 5 mL/L glucose 50%, 2.5 mL/L fluorescein 1%, 1.25 mL/L Evans Blue 1%, and 15 g/L agar. Cross-streaking on EBU plates with 9NA phage was used to discriminate phage-resistant and phage-sensitive isolates (Figure 6). The bacterial cultures obtained at the end of the cleaning protocol were used to get isolated colonies, which were checked for phage contamination (Figure 6B). We can observe the existence of both resistant and sensitive cells. This protocol does not favor the selection of phage-resistant cells; it only eliminates bacteriophages.
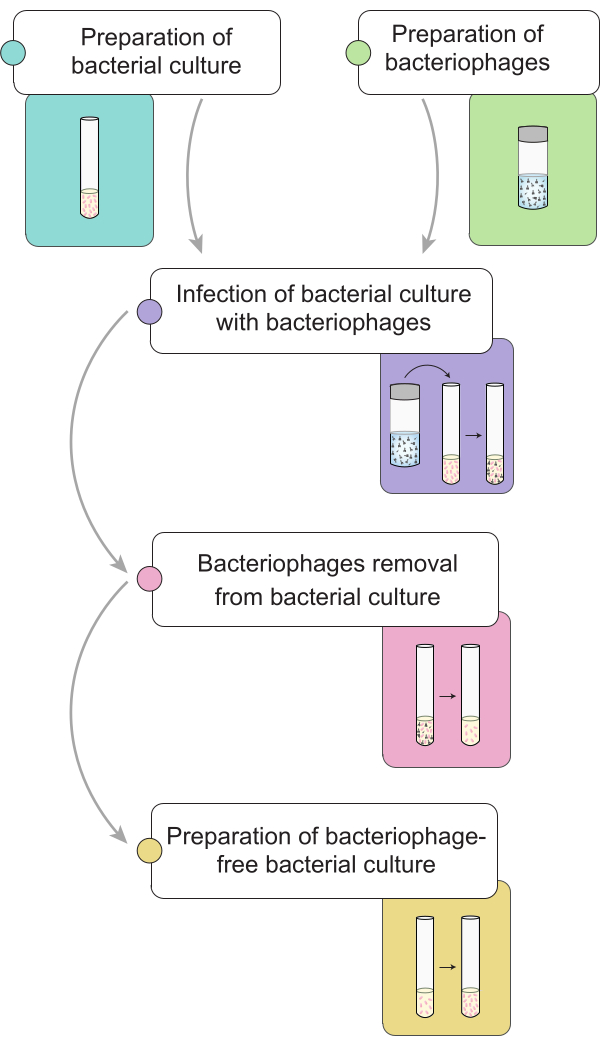
Figure 1: Brief outline of the procedure for elimination of bacteriophages in Salmonella cultures. The workflow is divided into different stages: preparation of bacterial culture and lysate, infection of the bacterial culture with bacteriophages, removal of bacteriophages from infected bacterial cultures, and preparation of a phage-free bacterial inoculum. Please click here to view a larger version of this figure.

Figure 2: Procedure for bacteriophage removal from infected Salmonella enterica cultures. The process consists of three phases: 1) Removal of bacteriophages in suspension, 2) Removal of phages contained inside bacterial cells, and 3) Avoidance of reinfection. Please click here to view a larger version of this figure.
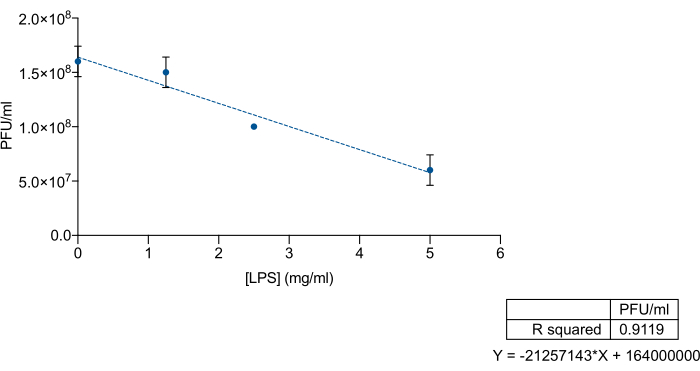
Figure 3: LPS-decoy assay to measure the efficiency of Salmonella enterica commercial LPS to bind bacteriophages. Titration of a 9NA lysate (PFU/mL) at increasing concentrations of Salmonella enterica commercial LPS. The experiment was carried out in triplicate. Mean and standard deviation are presented. Please click here to view a larger version of this figure.
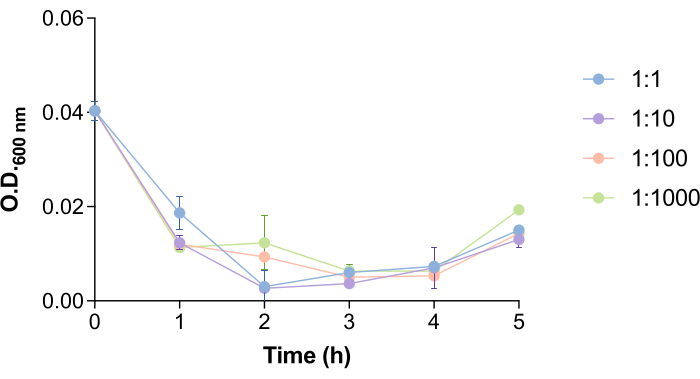
Figure 4: Bacteriophage 9NA lysis time in Salmonella cultures. Growth curves of the Salmonella enterica cultures in the presence of bacteriophage 9NA at bacteria:phage ratios of 1:1, 1:10, 1:100, and 1:1000. The experiment was carried out in triplicate. Mean and standard deviation are presented. Please click here to view a larger version of this figure.
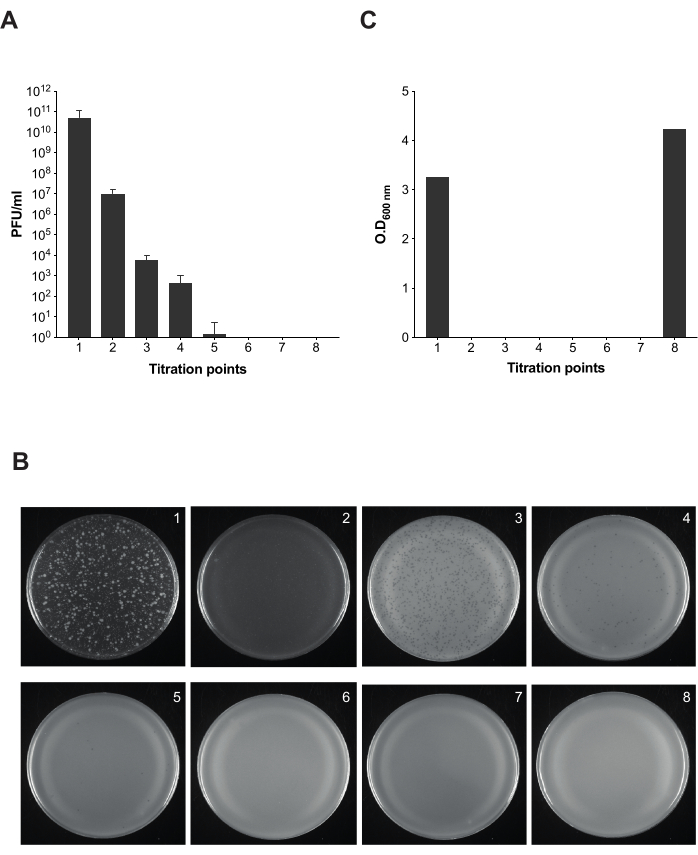
Figure 5: Plaque assay for infectivity testing during bacteriophage removal in Salmonella cultures. (A) Titration of eight aliquots was taken at different points of the protocol (titration points 1-7 are marked in Figure 2). For this experiment, Salmonella enterica serovar Typhimurium strain ATCC 14028 opvAB::lacZ (SV8011) and bacteriophage 9NA were used. Experiments were performed in triplicate, and the mean and standard deviations are shown. (B) Soft agar plates with Salmonella enterica were obtained following the overlay technique using aliquots from eight titration points. The plates correspond from the left to the right with titration points 1-8. (C) Optical density at 600 nm of bacterial culture at different times of the phage-remove protocol. Please click here to view a larger version of this figure.
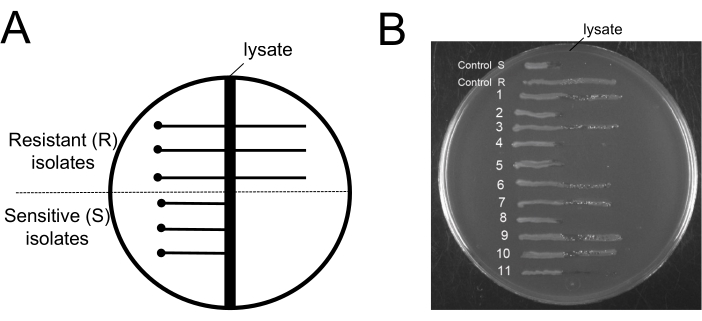
Figure 6: Testing for phage-resistant bacteria after bacteriophage removal procedure. (A) Schematic diagram of a typical EBU agar plate used for the cross-streak agar assay: the vertical dark region at the center represents the zone of 9NA lysate. The dot represents the location where the tested cells are inoculated at a safe distance from the lysate zone, and the horizontal solid lines represent either the phage-resistant cells that are growing across the lysate zone or the phage-sensitive cells that are not growing beyond the lysate zone. (B) EBU plate assays for testing 11 colonies were obtained at the end of the removal protocol. Control R and S are examples of phage-resistant and phage-sensitive isolates, respectively. Please click here to view a larger version of this figure.
Discussion
Diverse strategies are employed by bacteriophages to recognize and infect bacterial hosts. Different molecular structures on the surface of bacteria can act as phage receptors: protein, polysaccharide, lipopolysaccharides (LPS), and carbohydrate moieties20. In Gram-negative bacteria, LPS is a common receptor for phages. In addition, other receptors are outer membrane proteins, pili, and flagella21.
The specific interaction between bacteriophages and bacteria based on the recognition of LPS8 has been exploited in this work for the development of a highly efficient protocol for the elimination of bacteriophages in infected bacterial cultures (Figure 1 and Figure 2). Our protocol does not favor the selection of phage-resistant cells; it only eliminates bacteriophages (Figure 6). Both phage-susceptible and phage-resistant cells remain in bacterial culture after performing this protocol of phage removal.
The traditional standard practice when a phage infection occurs is to attempt to eliminate all the contaminated material, followed by cleaning and sterilization22. The decontamination procedure involves exposing the bacterial culture to stressful conditions, such as high temperatures, in order to partially or completely eliminate the bacterial cells. As described in representative results, the crucial step in this protocol is the incubation of phages-infected bacterial cultures with commercial LPS, a non-harmful substance for bacterial cultures. This helps to preserve the viability of bacterial cultures and offers significant advantages for industrial applications in fermenters and bioreactors.
The incubation time in this protocol is 2 h to ensure sufficient time for phage lysis of bacterial cells. If different bacterial strains and bacteriophages are to be used, this parameter should be considered and defined by the user. In this case, an assay similar to that described in Figure 4 should be performed prior to the experiment.
Interestingly, the efficacy of this cleaning protocol could also be analyzed by employing an assay that monitors the phage content of a given sample. In this sense, epigenetic biosensors are a novel tool for bacteriophage detection23. A well-known phage biosensor able to detect coliphages, which use LPS as a receptor, is the opvAB::gfp system13,18,23,24. This phage biosensor detects an increase in the OpvABON subpopulation in the presence of phages that use O-antigen as a receptor. In this sense, we could use an opvAB::gfp fusion to monitor LPS-binding phages in various steps of this protocol and/or diverse media and conditions. These approaches could be valuable in determining the timing and locations at which an effective protocol may be necessary.
While LPS recognition is common, phages can also utilize a variety of other surface receptors on bacterial cells for attachment and infection. Here, we have used the Gram-negative Salmonella as a representative enterobacteria and the bacteriophage 9NA that uses LPS as a receptor and genome ejection trigger. Other enterobacteria phages (e.g., Escherichia coli T5) bind loosely to LPS and require an outer membrane protein for genome injection. The protocol described is applicable for bacteriophages that recognize and need the O-antigen of LPS for successful infection, such as 9NA, Det7, and P2213,25,26,27. Accordingly, the successful implementation of this protocol for the phage decontamination of bacterial cultures involves determining whether the source of the phage infection requires recognizing LPS in the host.
In conclusion, and despite the potential limitations of the protocol, our representative results clearly demonstrate that this method is a powerful tool to clean bacterial Salmonella cultures of bacteriophages that use LPS as a receptor and genome ejection trigger.
Disclosures
The authors have nothing to disclose.
Acknowledgements
We thank Dr. Carmen R. Beuzón and Rocío Carvajal-Holguera for helpful discussions and suggestions. This work was supported by the grant PID2020-116995RB-I00 funded by MICIU/AEI/ 10.13039/5011100011033 and the VI Plan Propio de Investigación y Transferencia from the Universidad de Sevilla.
Materials
| Name | Company | Catalog Number | Comments |
|---|---|---|---|
| 20 mL syringe | BD Discardit II | 300296 | No special requirements |
| 50 mL conical tubes | Avantor | 525-0610 | No special requirements |
| 90 x 14 mm Petri dishes | Deltalab | 200209 | No special requirements |
| Agar | Sigma-Aldrich | A1296 | No special requirements |
| Bacteriophage lysate | Minimal concentration: 109 PFU/mL | ||
| Centrifuge | Eppendorf | No special requirements | |
| Chloroform | Panreac | 131252 | No special requirements |
| Citric acid · H2O | Merck | 1.00247 | |
| Colony counter | No special requirements | ||
| Evans Blue | Sigma-Aldrich | E-2129 | |
| Flasks | No special requirements | ||
| Fluorescein sodium salt | Sigma-Aldrich | F-6377 | |
| Forceps | No special requirements | ||
| Glass tubes | No special requirements | ||
| Glass tubes for lysate | No special requirements | ||
| Glucose | Sigma-Aldrich | G7021 | |
| K2HPO4 | Merck | 1.05104.1000 | |
| K2HPO4 anhydrous | Merck | 1.05104 | |
| Lipopolysaccharide from Salmonella enterica serotype Typhimurium | Sigma-Aldrich | L6511-25 mg | Dissolved in sterile water |
| Membrane 0.45 µm | MF-Millipore | HAWP02500 | No special requirements |
| MgSO4 · 7 H2O | Merck | 1.05886 | |
| NaCl | Sigma-Aldrich | S9888 | No special requirements |
| NaNH4HPO4 · 4 H2O | Sigma-Aldrich | S9506 | |
| Peptone | iNtRON | Ba2001 | No special requirements |
| Syringe Filter 0.22 µm | Millex | SLGSR33SB | No special requirements |
| Toothpicks | No special requirements | ||
| Tryptone | Panreac | 403682.1210 | No special requirements |
| Vacuum pump | Thermo Scientific | No special requirements | |
| Yeast extract | iNtRON | 48045 | No special requirements |
References
- Kasman, L. M., Porter, L. D. Bacteriophages. , StatPearls Publishing. (2024).
- Lawrence, D., Baldridge, M. T., Handley, S. A. Phages and human health: More than idle hitchhikers. Viruses. 11 (7), 587(2019).
- Beller, L., Matthijnssens, J. What is (not) known about the dynamics of the human gut virome in health and disease. Curr Opin Virol. 37, 52-57 (2019).
- Roux, S., Hallam, S. J., Woyke, T., Sullivan, M. B. Viral dark matter and virus-host interactions resolved from publicly available microbial genomes. eLife. 4, 08490(2015).
- Wommack, K. E., Colwell, R. R. Virioplankton: Viruses in aquatic ecosystems. Microbiol Mol Biol Rev. 64 (1), 69-114 (2000).
- Louten, J. Virus structure and classification. Essentl Human Virol. , 19-29 (2016).
- Egido, J. E., Costa, A. R., Aparicio-Maldonado, C., Haas, P. J., Brouns, S. J. J. Mechanisms and clinical importance of bacteriophage resistance. FEMS Microbiol Rev. 46 (1), 048(2022).
- Rakhuba, D. V., Kolomiets, E. I., Dey, E. S., Novik, G. I. Bacteriophage receptors, mechanisms of phage adsorption and penetration into host cell. Polish J Microbiol. 59 (3), 145-155 (2010).
- Lindberg, A. A. Bacteriophage receptors. Ann Rev Microbiol. 27 (1), 205-241 (1973).
- Koskella, B., Meaden, S. Understanding bacteriophage specificity in natural microbial communities. Viruses. 5 (3), 806-823 (2013).
- Marcó, M. B., Moineau, S., Quiberoni, A. Bacteriophages and dairy fermentations. Bacteriophage. 2 (3), 149-158 (2012).
- Fernández-Fernández, R., et al. Evolution of a bistable genetic system in fluctuating and non-fluctuating environments. bioRxiv. , 2024.01.22.576666 (2024).
- Cota, I., Blanc-Potard, A. B., Casadesús, J. STM2209-STM2208 (opvAB): a phase variation locus of Salmonella enterica involved in control of O-antigen chain length. PloS one. 7 (5), e36863(2012).
- Kropinski, A. M., Mazzocco, A., Waddell, T. E., Lingohr, E., Johnson, R. P. Enumeration of bacteriophages by double agar overlay plaque assay. Methods Mol Biol. 501, 69-76 (2009).
- Ackermann, H. W. Tailed bacteriophages: The order Caudovirales. Adv Virus Res. 51, 135-201 (1998).
- Wilkinson, R. G., Gemski, P., Stocker, B. A. D. Non-smooth mutants of Salmonella typhimurium: Differentiation by phage sensitivity and genetic mapping. J Gen Microbiol. 70 (3), 527-554 (1972).
- Casjens, S. R., Leavitt, J. C., Hatfull, G. F., Hendrix, R. W. Genome sequence of Salmonella Phage 9NA. Genome Announc. 2 (4), e00531(2014).
- Cota, I., et al. Epigenetic control of Salmonella enterica O-antigen chain length: A tradeoff between virulence and bacteriophage resistance. PLoS Genet. 11 (11), e1005667(2015).
- Chan, K., Botstein, D., Watanabe, T., Ogata, Y. Specialized transduction of tetracycline resistance by phage P22 in Salmonella typhimurium. Virology. 50, 883-898 (1972).
- Bertozzi Silva, J., Storms, Z., Sauvageau, D. Host receptors for bacteriophage adsorption. FEMS Microbiol Lett. 363 (4), 002(2016).
- Sørensen, M. C. H., et al. Bacteriophage F336 recognizes the capsular phosphoramidate modification of Campylobacter jejuni NCTC11168. J Bacteriol. 193 (23), 6742-6749 (2011).
- Ogata, S., Hongo, M. Bacteriophages of the Genus Clostridium. Adv Appl Microbiol. 25, 241-273 (1979).
- Olivenza, D. R., Casadesús, J., Ansaldi, M. Epigenetic biosensors for bacteriophage detection and phage receptor discrimination. Environ Microbiol. 22 (8), 3126-3142 (2020).
- Olivenza, D. R., et al. A portable epigenetic switch for bistable gene expression in bacteria. Sci Rep. 9 (1), 862(2019).
- Walter, M., et al. Structure of the receptor-binding protein of bacteriophage Det7: a Podoviral tail spike in a Myovirus. J Virol. 82 (5), 2265-2273 (2008).
- Davies, M. R., Broadbent, S. E., Harris, S. R., Thomson, N. R., vander Woude, M. W. Horizontally acquired Glycosyltransferase operons drive Salmonellae lipopolysaccharide diversity. PLoS Genet. 9 (6), e1003568(2013).
- Wahl, A., Battesti, A., Ansaldi, M. Prophages in Salmonella enterica: a driving force in reshaping the genome and physiology of their bacterial host. Mol Microbiol. 111 (2), 303-316 (2019).
Reprints and Permissions
