The present protocol describes procedures used to study and characterize cell wall-related enzymes, mainly β-1,3-glucanase and peroxidase, in wheat plants. Their activity levels increase during wheat-RWA interaction and are involved in the plant defense response through cell wall reinforcement, which deters aphid feeding.
Method Article
Elucidating β-1,3-Glucanase and Peroxidase Physicochemical Properties of Wheat Cell Wall Defense Mechanism Against Diuraphis noxia Infestation
In This Article
Summary
Abstract
Wheat plants infested by Russian wheat aphids (RWA) induce a cascade of defense responses, including the hypersensitive responses (HR) and induction of pathogenesis-related (PR) proteins, such as β-1,3-glucanase and peroxidase (POD). This study aims to characterize the physicochemical properties of cell wall-associated POD and β-1,3-glucanase and determine their synergism on the cell wall modification during RWASA2-wheat interaction. The susceptible Tugela, moderately resistant Tugela-Dn1, and resistant Tugela-Dn5 cultivars were pregerminated and planted under greenhouse conditions, fertilized 14 days after planting, and irrigated every 3 days. The plants were infested with 20 parthenogenetic individuals of the same RWASA2 clone at the 3-leaf stage, and leaves were harvested at 1 to 14 days post-infestation. The Intercellular wash fluid (IWF) was extracted using vacuum filtration and stored at -20 °C. Leaf residues were crushed into powder and used for cell wall components. POD activity and characterization were determined using 5 mM guaiacol substrate and H2O2, monitoring change in absorbance at 470 nm. β-1,3-glucanase activity, pH, and temperature optimum conditions were demonstrated by measuring the total reducing sugars in the hydrolysate with DNS reagent using β-1,3-glucan and β-1,3-1,4-glucan substrates, measuring the absorbance at 540 nm, and using glucose standard curve. The pH optimum was determined between pH 4 to 9, temperature optimum between 25 and 50 °C, and thermal stability between 30 °C and 70 °C. β-1,3-glucanase substrate specificity was determined at 25 °C and 40 °C using curdlan and barley β-1,3-1,4-glucan substrates. Additionally, the β-1,3-glucanase mode of action was determined using laminaribiose to laminaripentaose. The oligosaccharide hydrolysis product patterns were qualitatively analyzed with thin-layer chromatography (TLC) and quantitatively analyzed with HPLC. The method presented in this study demonstrates a robust approach for infesting wheat with RWA, extracting peroxidase and β-1,3-glucanase from the cell wall region and their comprehensive biochemical characterization.
Introduction
Russian wheat aphids (RWA) infest wheat and barley, causing significant yield loss or grain quality reduction. Wheat responds to infestation by inducing several defense responses, including increasing the β-1,3-glucanase and peroxidase activity levels in the resistant cultivars, while susceptible cultivars reduce the activity of these enzymes at early infestation period1,2,3,4. The key functions of β-1,3-glucanase and POD in the wheat plant included regulating callose accumulation in the resistant cultivar and reactive oxygen species (ROS) quenching at the cell wall and apoplastic regions during RWA infestation1,3,5,6,7. Mafa et al.6 demonstrated that there was a strong correlation between the increased POD activity and increased lignin content in the resistant wheat cultivar upon RWASA2 infestations. In addition, increased lignin content indicated that the cell wall of the infested resistant wheat cultivar was reinforced, leading to reduced RWA feeding.
Most researcher groups extracted and studied apoplastic β-1,3-glucanase and POD during the wheat/barley-RWA interaction; in addition, most of these studies claimed that these enzymes influence the cell wall of the wheat plant infested with RWA without measuring the enzyme presence in the cell wall region. Only a few studies have used microscopic techniques to show that β-1,3-glucanase activity levels were linked to callose regulation7,8,9 or extracted major cell wall components to demonstrate the correlation between POD activities and cell wall modification in the resistant6,10. The lack of probing the β-1,3-glucanase and POD association to the cell wall indicates a need to develop methods that allow researchers to measure the cell wall-bound enzymes directly.
The current method proposes that removing the apoplastic fluid from the leaf tissue before extracting the cell wall-bound enzymes is necessary. The extraction procedure of apoplastic fluid must be performed twice from the leaf tissue, which is used for extracting the cell wall-bound enzymes. This process reduces contamination and confusion of the apoplastic enzymes with those found in the cell wall regions. Thus, in this study, we extracted cell wall-bound POD, β-1,3-glucanase, and MLG-specific β-glucanase and performed their biochemical characterization.
Protocol
The study was conducted with the approval and permission of the Environmental and Biosafety Research Ethics Committee of the University of the Free State (UFS-ESD2022/0131/22). The details of the reagents and the equipment here are listed in the Table of Materials.
1. Plant growth conditions
- Germinate 250 seeds of each wheat cultivar, i.e., susceptible Tugela, moderately resistant Tugela-Dn1, and resistant Tugela-Dn5, in separate Petri dishes.
- Add 5 mL of distilled water in each Petri dish, seal with a paraffin film, and incubate in the germination chamber set at 25 °C for 2 days.
- Transplant the germinated seeds of each cultivar in 15 cm pots containing 1:1 soil and peat moss (15 plants per pot) under controlled greenhouse conditions.
- Set the temperature regimes at 18 °C and 24 °C during night and day, respectively.
- Irrigate the plants every 3 days using tap water and supply them with 2 g/L fertilizer 14 days after germination.
- Place the plants in cages encased in nets and allow them to grow to the third leaf stage2,6 (with four biological replicates of each cultivar).
2. Wheat cultivars infestation with RWASA2
- Infest Tugela, Tugela-Dn1, and Tugela-Dn5 wheat cultivars with RWASA2 according to Jimoh et al.11 and Mohase and Taiwe12.
- Keep the plants in two separate sets in cages; infest one set with 20 parthenogenetic individuals of the same RWASA2 clone per plant in each pot in the growth chambers covered with nets. Keep another set of wheat plants in a separate room under the growth chamber with clean nets and treat them as controls.
NOTE: Keep the two treatments in separate rooms and cover the plants in cages encased in nets. Also, in a case where two different RWA biotypes are used in a study, keep the plants infested with one RWA biotype from those infested with the second biotype as far as possible or in separate rooms under growth chambers covered with nets to avoid any possible cross-contamination of the RWASA2. - For harvesting, select the second and third leaves at two different time regimes, short-term feeding period (1, 2, and 3 days) and long-term feeding period (7 and 14 days), and wrap them in moist paper towels.
- Immediately transfer the harvested leaves to a box containing ice to reduce leaf metabolisms before intercellular wash fluid (IWF) extraction.
3. Extraction of intercellular wash fluid (IWF) from the apoplast
- Cut the harvested leaves of about three wheat cultivars into 7 cm pieces.
- Rinse the leaf pieces twice in distilled water to remove any cytosolic contamination from the cut ends6,13.
- Insert the leaf pieces into a thick-walled glass tube and submerge the samples in extraction buffer (50 mM Tris-HCl, pH 7.8).
- Apply vacuum infiltration for 5 min using a water jet pump to impregnate leaves with the extraction buffer.
- Thereafter, remove the leaf pieces from the glass tube and blot dry them with a paper towel.
- Insert the dried leaf pieces vertically into pre-cooled centrifuge tubes fitted with perforated disks and centrifuge at 500 x g for 10 min at 4 °C.
- Use a 100 µL pipette to collect the supernatant into pre-cooled 1.5 mL microcentrifuge tubes.
- Repeat the entire extraction procedure with the same leaf material.
- Combine the collected supernatant and store it at −20° C.
NOTE: The supernatant aliquots are treated as the source of apoplast content or IWF. The IWF was not used in the current study, but it was important to remove it from the leaf tissues before we extracted the cell wall-bound β-1,3-glucanase and Peroxidase (POD).
4. Extraction of the cell wall-associated β-1,3-glucanase and POD
NOTE: The leaf residues left after IWF extraction were used to extract total cell wall protein.
- Crush the leaf residues to a fine powder with liquid nitrogen using a mortar and pestle.
- Transfer approximately 200 mg of the powdered leaf tissue into a mortar containing 4 mL of extraction buffer (50 mM sodium phosphate with 1% (w/v) polyvinylpolypyrrolidone (PVPP); pH 5.0) followed by grinding with a pestle to a smooth paste, which is then transferred to microcentrifuge tubes.
- Incubate the mixture in the microcentrifuge tubes for 3 min on ice and then centrifuge at 10,000 x g for 15 min at 4 °C.
- Collect the supernatant (total protein extracts) in microcentrifuge tubes (aliquots of 2 mL) and use it as a source of β-1,3-glucanase and POD for the entire study.
5. Determination of the protein standard
- Determine the total protein concentration of the extracts following the Bradford method14.
- Prepare the bovine serum albumin (BSA) solutions at the concentrations of 0.0 mg/mL, 0.1 mg/mL, 0.2 mg/mL, 0.3 mg/mL, 0.4 mg/mL, 0.5 mg/mL, 0.6 mg/mL, 0.7 mg/mL, 0.8 mg/mL, 0.9 mg/mL and 1.0 mg/mL dissolved in 50 mM sodium phosphate buffer to generate the protein standard.
- Prepare the standard by adding 10 µL of each BSA solution into the 96-well microplate with 190 µL (0.25% v/v) of Bradford reagent (see Table of Materials).
- Incubate at 25 °C for 20 min and measure the absorbance at 595 nm using the microplate reader and use the absorbance values to prepare the standard curve for quantifying protein concentration.
- Quantify the protein concentration
- Add 10 µL of the extracted enzyme (step 4) into a 96-well microplate with 190 µL (0.25% v/v) of Bradford reagent in triplicates.
- Incubate at room temperature (25 °C) for 20 min.
- Measure the absorbance at 595 nm using the spectrophotometer with a microplate reader and use the absorbance values to determine the protein concentration using BSA as the protein standard (prepared in step 5.4).
6. Prepare glucose standard for β-1,3-glucanase activity
- Prepare the standard solutions with concentrations between 0.00 mg/mL and 1.0 mg/mL (0.0 mg/mL, 0.1 mg/mL, 0.2 mg/mL, 0.3 mg/mL, 0.4 mg/mL, 0.5 mg/mL, 0.6 mg/mL, 0.7 mg/mL, 0.8 mg/mL, 0.9 mg/mL, 1.0 mg/mL) with glucose dissolved in distilled water.
- Add 300 µL of each glucose solution and 600 µL of 3,5-Dinitrosalicylic acid (DNS) reagent at a 1:2 ratio into 1.5 mL microcentrifuge tubes and incubate the reactions at 100 °C for 5 min (see Table of Materials for DNS reagents) (Miller et al.15).
- Allow the mixture to cool at room temperature before measuring the absorbance at 540 nm using the spectrophotometer.
- Use the average absorbance values to develop the standard curve for determining β-1,3-glucanase enzyme activity.
7. Determining β-1,3-glucanase activity assay
NOTE: The enzyme activity of the cell wall-bound β-1,3-glucanase extracted from Tugela, Tugela-Dn1, and Tugela-Dn5 was determined by the amount of released total reducing sugars released from hydrolysis of 0.5% (w/v) mixed linked β-1,3-1,4-glucan (MLG) and 0.4% (w/v) β-1,3-glucan substrates using a modified method as described by Miller et al.15. Always keep the tubes with protein aliquots on the ice. If the samples were frozen, thaw them on ice and proceed immediately after thawing.
- Add 200 µL of the enzyme extract (keep the protein concentration between 20 µg/mL to 90 µg/mL in all reactions, unless stated otherwise) and 300 µL of the substrate dissolved in 50 mM sodium citrate buffer (pH 5.0) into the 1.5 mL microcentrifuge tubes.
NOTE: Run a parallel blank reaction without the enzyme extract for all substrates (first blank), and the enzyme blank consists of enzyme extract without substrate (second blank). Both the substrate and enzyme extract were replaced with the buffer in the first and second blacks, respectively. - Incubate the reactions at 37 °C for 24 h and terminate the reaction by heating at 100 °C for 5 min, then centrifuge at 10,000 x g for 10 min at 4 °C.
- Mix 300 µL of the supernatant with 600 µL DNS reagent (1:2 ratio) into new 1.5 mL microcentrifuge tubes and boil at 100 °C for 5 min.
- Allow the solution to cool to room temperature and measure the absorbance at 540 nm using the spectrophotometer.
NOTE: If the concentration of total reducing sugars is high in the mixture, it will result in a dark-brown solution, which is difficult to read using the spectrophotometer. Therefore, further dilution of the samples is necessary before reading the absorbance. - Use the glucose standard curve developed in step 6.4 above to determine the enzyme activity in the SI units of the standard curve.
- To convert the activity to a specific activity that is expressed in µmol glucose/h/mg protein, use the equation below:
Specific activity = [(enzyme activity/180.16)*1000]/time/protein concentration
NOTE: Convert enzyme activity in mg/mL to g/mL; 180.16 g/mol is the molecular weight of glucose, 1000 is a factor that converts M to micromoles, time is the period of reaction, and protein extract concentration is represented in mg/mL. One unit of β-1,3-glucanase activity is defined as 1 µmol of glucose released from the substrate within a 1 h reaction period.
8. Determining Peroxidase (POD) activity
NOTE: The cell wall-bound peroxidase activity of Tugela, Tugela-Dn1, and Tugela-Dn5 wheat cultivars was determined by quantifying the formation of the tetra-guaiacol produced per unit time from guaiacol16.
- Add 30 µL of the enzyme extract, 30 µL 1% (v/v) H2O2, and 970 µL of 5 mM guaiacol into the cuvettes at 25 °C.
NOTE: Make the blank reaction without the enzyme extract (First blank), and another blank for enzyme samples without substrate (second blank). The enzyme or substrate samples were replaced by 50 mM Sodium Phosphate buffer in the first and second blanks, respectively. - Use the kinetic mode of the spectrophotometer to monitor the change in absorbance at 470 nm.
- Determine the slope where the graph was linear and use it as the absorbance value.
- Calculate the average absorbance and use it in calculating POD activity.
- Calculate peroxidase activity using the molar extinction coefficient of guaiacol (26.6 mM-1cm-1) and express the activity in µmol tetra-guaiacol/min/mg protein.
- Calculate POD activity using the equation used by Mafa et al.6:
POD ACTIVITY = [(ΔABS × DF) ÷ Protein concentration] × 26.6 mM-1cm-1 × 1 cm
NOTE: Where ΔABS = average absorbance; DF = Dilution factor; 26.6 mM-1cm-1 = Guaiacol extinction coefficient.
9. POD characterization
NOTE: POD characterization assays were conducted using 3 days post-infestation (dpi) enzyme extracts of Tugela, Tugela-Dn1, and Tugela-Dn5 following similar methods described in step 8, with minor changes in the reaction buffers and temperatures. The enzyme samples were always kept on ice while the experiments were being conducted. Run the reactions in quadruplicates with a parallel blank reaction.
- For optimum pH assays, perform the following steps.
- Dissolve guaiacol substrate in 50 mM buffers (sodium citrate, pH 4 and 5), sodium phosphate (pH 6 and 7), and Tris-HCl (pH 8 and 9) (see Table of Materials).
- Run the reactions at 25 °C as described in step 8.
- For optimum temperature assays, perform the following steps.
- Run the reactions at 25 °C, 30 °C, 40 °C, and 50 °C, respectively.
- Use guaiacol substrate dissolved in the buffer pH 5 (pH optimum) and run the reactions as described in step 8.
- For thermostability assays, perform the following steps.
- Before starting the reactions, incubate the enzyme at 37 °C, 50 °C, and 70 °C for 30 min.
- Run the reactions according to the methods described in step 8 using 50 mM sodium citrate buffer (pH 5) and at 40 °C (temperature optimum).
10. β-1,3-glucanase characterization
NOTE: Conduct the characterization assays following the method described in step 7 using 3 dpi enzyme extracts, with some modifications in the reaction buffers and temperatures. Run the reactions in quadruplicates, with a parallel blank reaction for each substrate.
- For optimum pH assays, proceed as follows:
- Dissolve MLG and β-1,3-glucan substrates in 50 mM buffers (sodium citrate, pH 4 and 5), sodium phosphate (pH 6 and 7), and Tris-HCl (pH 8 and 9).
- Run the reaction as described in step 7.
- For optimum temperature assays, proceed as follows:
- Run the reactions at 25 °C, 30 °C, 40 °C, and 50 °C, respectively.
- Use MLG and β-1,3-glucan substrates dissolved in the 50 mM sodium citrate buffer (pH 5) with optimum pH (obtained in step 10.1) and run the reactions as described in step 7.
- For thermostability assays, proceed as follows:
- Before starting the reactions, incubate the enzyme at 37 °C, 50 °C, and 70 °C for 30 min.
- Run the reactions using substrates dissolved in 50 mM sodium citrate buffer (pH 5) and incubate at 25 °C and 40 °C for 24 h.
11. Assessing β-1,3-glucanase mechanism of action on different glucan substrates
NOTE: Glucan substrates contain the same glucose residue in their backbone, but the glycosidic linkages between glucopyranose units are diverse and can take the α or β orientation17. The glycosidic bonds can form between several carbon atoms of glucose molecules, defining their chemical structure, e.g., β-1,3-glucan, β-1,4-glucan, and mixed linked-β-1,3-1,4-glucan (MLG)18,19,20. The β-1,3-glucanase mechanism of action was determined using RWASA2-infestated Tugela, Tugela-Dn1, and Tugela-Dn5 samples (enzyme sources) and the following substrates β-1,3-glucan (CM-curdlan), MLG (from barley), and β-1,4-glucan (AZO-CM-Cellulose). The mechanism of action is determined under optimal assay conditions (25 °C and 40°C, pH 5.0), using 0.1% (w/v) β-1,4-glucan, 0.4% (w/v) β-1,3-glucan, or 0.5% (w/v) MLG substrates.
- Dissolve the substrates in 50 mM sodium citrate buffer (pH 5).
- Add 200 µL of the enzyme extract and 300 µL of the substrate into the 1.5 mL microcentrifuge tubes.
- Incubate the reactions at two separate temperatures, 25 °C and 40 °C for 8 h.
- Termination of the reactions by heating at 100 °C.
- Centrifuge the reaction mixture of β-1,3-glucan and MLG at 10,000 x g for 10 min at 4 °C and proceed as described in step 7.3.
- For β-1,4-glucan, after terminating the reaction at 100 °C, dilute the mixture with 800 µL of absolute ethanol and centrifuge at 4 °C for 10 min at 10,000 x g.
- Transfer the supernatant into the curvets, measure the absorbance at 590 nm with the spectrophotometer, and calculate the β-1,3-glucanase activity on β-1,4-glucan using the manufacturer's procedure (see Table of Materials) and express the activity in Units/mg protein.
12. Determining β-1,3-glucanase mode of action
NOTE: The RWASA2-infested Tugela, Tugela-Dn1, and Tugela-Dn5 induced β-1,3-glucanase mode of action were assayed with laminarin-oligosaccharides (LAMs) with the degree of polymerization (DP) between 5 and 2. Use Thin layer chromatography (TLC), liquid chromatography-mass spectrometry (LC-MS), and glucose oxidase peroxidase (GOPOD) kit to determine the DP required for β-1,3-glucanase to hydrolyze the substrate. The TLC was used for qualitative analysis, and the LC-MS was used for quantitative analysis, which determined the concentration of the oligosaccharides in the hydrolysate after the reaction21.
- Prepare the reactions of β-1,3-glucanase mode of action
NOTE: Prepare the concentrated protein extract with a 10 kDa centrifuge concentrating membrane filter, and thus have concentrated and non-concentrated RWASA2 infested protein extracts for the experiment.- For concentrating the enzymes extracted from each cultivar, transfer 5 mL of the extracts into the 10 kDa centrifuge concentrating membrane filters.
- Centrifuge the membrane filter tubes containing extract at 15,000 x g for 30 min at 4 °C.
- Dissolve Laminaripentaose (LAM5), Laminaritetraose (LAM4), Laminaritriose (LAM3), and Laminaribiose (LAM2) (see Table of Materials) in 50 mM sodium citrate (pH 5) to make 10 mg/mL.
- To start the reaction, add 20 µL of the protein extract and 40 µL of Laminaripentaose (LAM5), Laminaritetraose (LAM4), Laminaritriose (LAM3), and Laminaribiose (LAM2).
- Incubate the reaction at 40 °C for 16 h and terminate by boiling at 100 °C for 5 min.
- Perform thin layer chromatography (TLC)
- Cut 4 silica plates into 10 cm2 pieces and draw one line across the surface of the plate, leaving 1 cm space from the bottom of one edge.
- Mark the dots over the line and mark them according to different cultivars and DP of the Laminarin-oligosaccharides, 1 cm apart and. Take 2 silica plates for concentrated protein extract and the other 2 for non-concentrated extracts.
- Add 3 µL of the reaction mixtures 3 to 5 times over the corresponding marked spots on the silica plate and allow the spots on the plate to dry completely before repeating the process.
- Gently put the silica plates in the TLC tank containing the mobile phase of n-butanol: acetic acid: water (2:1:1 v/v/v) with the side containing the samples' spots at the bottom.
- Allow the mobile phase to move from the bottom to the top of the plate.
NOTE: This step may take approximately 2 h. Do not move or disturb the tank while samples are separating. - Remove the plates from the mobile phase and allow them to dry at room temperature.
- Add the staining solution into the small container, gently submerge the silica plate in the staining solution of 0.3% (w/v) Naphthol in 95% (v/v) ethanol using 5% (v/v) sulfuric acid for 5 s, remove it, and then allow it to dry at room temperature.
NOTE: At this step, switch on the heating block/oven and set the temperature to 100 °C. - Put the dried silica plates on the heating block and heat at 100 °C for 7-10 min or until the blue-violet spots appear. Take photos of the silica plates showing the blue-violet spots and document them.
- Quantify the concentration of laminarin-oligosaccharides hydrolysates
NOTE: The concentration of the LAM hydrolysates will be quantified for both concentrated and non-concentrated protein extracts21.- Add 20 µL of each sample on a C18 (Carbohydrate 4.6 × 250 mm) column and allow to separate at a flow rate of 500 µL/min using a water (solvent A) and acetonitrile (solvent B) gradient from 100% B to 60% B over 10 min followed by column re-equilibration steps with a total run time of 20 min to allow for column re-equilibration.
- Ionise the eluting analytes in negative electrospray mode in the mass spectrometry ion source with a 400 °C heater temperature to evaporate the excess solvent, 30 psi nebulizer gas, 30 psi heater gas, and 20 psi curtain gas.
- Set the declustering potential at 350 V.
- Analyse the eluting analytes on the mass spectrometer in a Q1 scan mode ranging from 150 Da to 1000 Da with a dwell time of 3 s.
- Record the concentrations of the analytes on the spreadsheet.
- Quantify the concentration of glucose
- Analyze the glucose concentration produced by laminarin hydrolysis using GOPOD reagent following the manufacturer's instructions22,23.
- Measure the absorbance at 510 nm in a fixed mode of the spectrophotometer.
13. Data collection and analysis
- Randomize all experiments to avoid bias during infestation or sample collection and conduct the analysis in quadruplicates.
- Unless stated otherwise, use the means ± standard deviation to represent the values in the graphs and tables generated from the collected experimental data.
- Use Microsoft Excel to analyze all the data and to generate graphs.
- Perform statistical analysis with compatible software.
NOTE: Perform Multifactorial Analysis of variance (ANOVA) to test for significance between treatments and Fisher's LSD to test for homogenous groups at an alpha value of 0.05.
Results
Four biological replicates of wheat cultivars (Tugela, Tugela-Dn1, and Tugela-Dn5) were infested with RWASA2 at the 3-leaf growth stage. After infestation, the leaves were harvested at 1-, 2-, 3-, 7-, and 14 dpi. The control treatments were not infested with RWASA2 to make the experiment results comparable to wheat plants not exposed to stress. The experiments were conducted in quadruplicates, and the results were presented as the mean values.
The protein concentrations of both RWASA2-infested and control extracts were quantified using BSA as a protein standard. This was useful when determining the enzyme activity for β-1,3-glucanase and POD and to ensure that the protein concentrations used in every reaction were known for every sample; the differences were negligible. The data can be presented in a graph or table format. The first graph format was used to express the enzyme-specific activities (y-axis) plotted against days post-infestation (x-axis) for both enzyme activity and characterization assay results. The increased specific activity of β-1,3-glucanase, MLG-specific β-glucanase, and POD in RWASA2-infested resistant Tugela-Dn5 samples showed that the enzymes played a role in the defense response (Figure 1 and Figure 2). In addition, both enzymes significantly lost activity over time in the susceptible Tugela infested with RWASA2.
The biochemical characterization of the cell wall-associated β-1,3-glucanase and POD were determined by expressing the activity in percentages relative-activity or specific enzyme activity, which were represented by line and bar graphs, respectively (Figure 3). The result showed that both β-1,3-glucanase and POD had pH-similar optimum conditions (pH 5) corresponding to the acidic cell wall conditions (Figure 3). It is important to note that the MLG-specific β-glucanase also showed a specific activity at pH 5. However, it was more stable at basic conditions than the β-1,3-glucanase, which lost up to 80% relative activity in the same condition. The results confirmed that two enzymes that catalyzed the MLG and β-1,3-glucan substrates were successfully extracted from the cell wall region based on the pH optimum. This claim was validated by thermostability assay results (Figure 4), which confirmed that β-1,3-glucanase could only tolerate temperatures up to 50 °C and lost more than 80% relative activity at 70 °C (POD had the same profiles). In contrast, the MLG-specific β-glucanase enzyme displayed the highest activity at 25 °C followed by a gradually decreased activity, but this enzyme retained more than 50% relative activity at 50 °C and 70 °C. The observations confirmed that the MLG-specific β-glucanase displayed unique biochemical properties compared to β-1,3-glucanase and POD extracted from Tugela, Tugela-Dn1, and Tugela-Dn5.
The β-1,3-glucanase mode of action was demonstrated with laminarin-oligosaccharides with a DP between 5 and 2 (referred to as LAM5 to LAM2). The TLC results showed infested Tugela, Tugela-Dn1, and Tugela-Dn5 had a β-1,3-glucanase enzyme that mostly hydrolyzed longer oligosaccharides (LAM5 and LAM4) compared to shorter ones (LAM3). The intensity of the blue-violet spots visualized on the TLC plate showed that LAM5 and LAM4 had less intense bands, followed by LAM3 in the resistant and moderately resistant cultivars (Figure 5). The susceptible Tugela cultivar showed that β-1,3-glucanase hydrolyzed the LAM5 better than other oligosaccharides (LAM4-LAM2), which showed higher intense bands. The mode of action is also expressed as the concentrations of the hydrolysates, presented in a table with a heat map showing efficient hydrolysis of Laminarin oligosaccharides with higher DP and moderate activity during the hydrolysis of shorter oligosaccharides (LAM3 and LAM2) (Table 1).
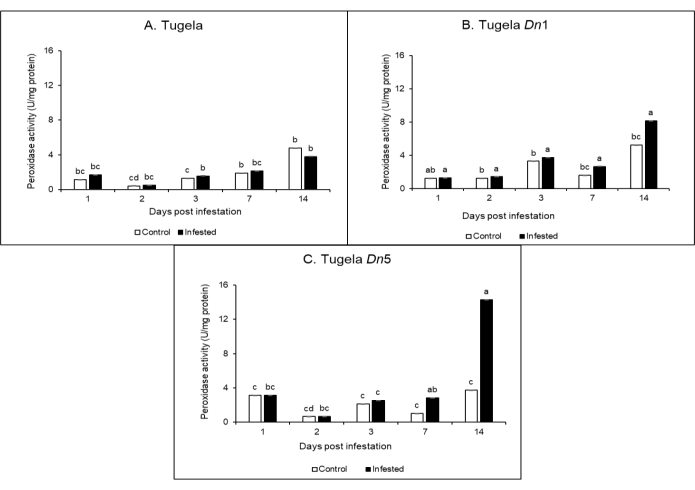
Figure 1: The specific activity of peroxidase extracted from RWASA2-infested Tugela (A), Tugela-Dn1 (B), and Tugela-Dn5 (C) 14 days after infestation. The experiments were performed in quadruplicates; the values and error bars represent means ± SD, respectively. U in U/mg protein represents µmol tetra-guaiacol/min. Please click here to view a larger version of this figure.
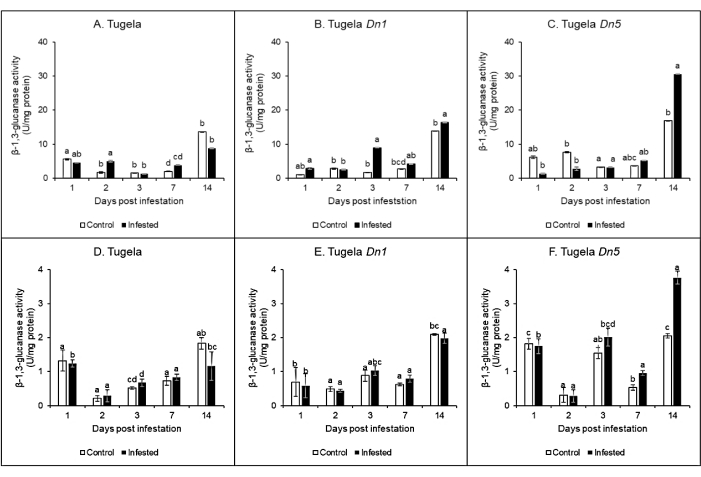
Figure 2: The β-1,3-glucanase specific activity measured in RWASA2-infested Tugela, Tugela-Dn1, and Tugela-Dn5 cultivars. The enzyme activity was conducted using two chemically distinct glucan substrates, i.e., mixed-linked β-1,3-1,4-glucan (A-C) and curdlan (D-F). The experiments were performed in quadruplicates; the values and error bars represent means ± SD, respectively. U in U/mg protein represents µmol/h. Please click here to view a larger version of this figure.
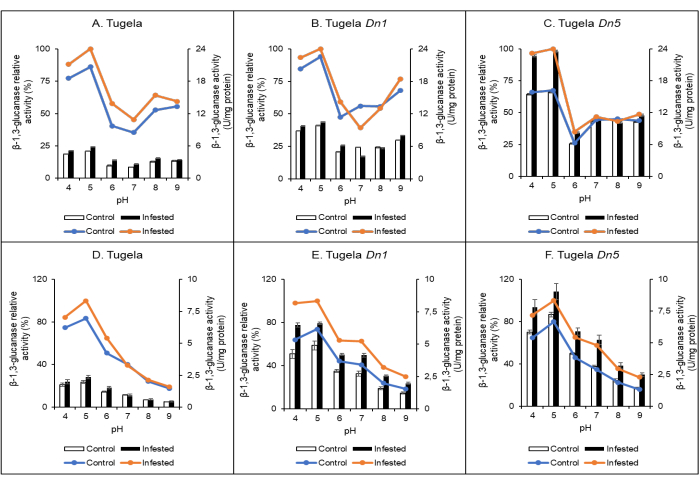
Figure 3: The pH optimum assays of β-1,3-glucanase enzyme extracted from RWASA2 infested Tugela, Tugela-Dn1, and Tugela-Dn5 at 3 days after infestation. The experiments were conducted using mixed-linkage-β-1,3-1,4-glucan (A-C) and curdlan (D-F) substrates. The experiments were performed in quadruplicates; the values and error bars represent means ± SD, respectively. U in U/mg protein represents µmol/h. Please click here to view a larger version of this figure.
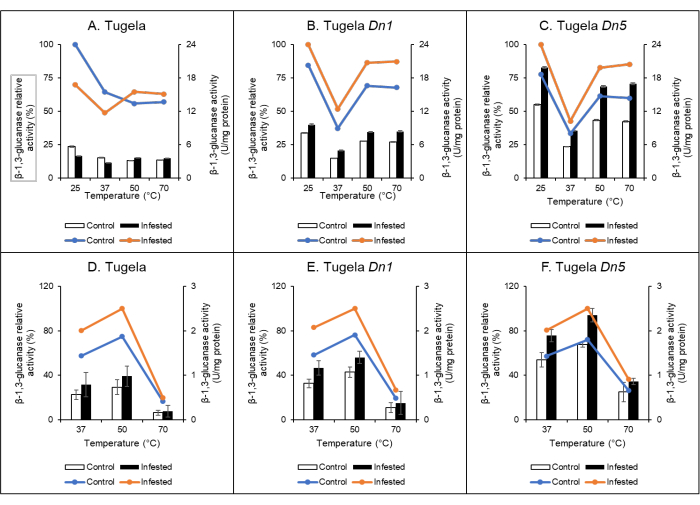
Figure 4: Thermostability assay. The thermostability assays of β-1,3-glucanase sourced from RWASA2 infested Tugela, Tugela-Dn1, and Tugela-Dn5 3 days after infestation, investigated on β-1,3-1,4-glucan (A-C) and β-1,3-glucan (D-F). The experiments were performed in quadruplicates; the values and error bars represent means ± SD, respectively. U in U/mg protein represents µmol/h. Please click here to view a larger version of this figure.
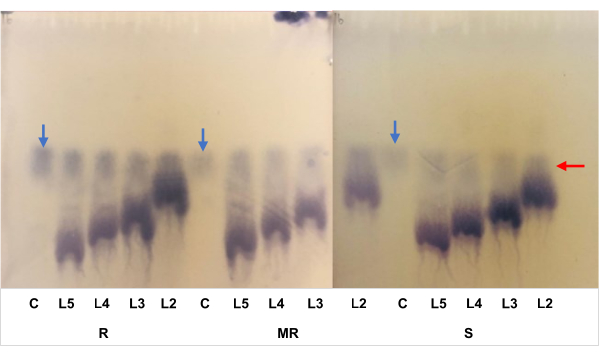
Figure 5: Analysis of β-1,3-glucanase mode of action on laminarin oligosaccharides. Laminarin oligosaccharides were represented by L5, L4, L3, and L2, which were equivalent to Laminaripentaose (LAM5), Laminaritetraose (LAM4), Laminaritriose (LAM3), and Laminaribiose (LAM2), respectively. The red arrow shows the glucose (GLU), and the blue arrow shows the profiles of the enzyme without the oligosaccharides. Please click here to view a larger version of this figure.
Table 1: Laminarin-oligosaccharides produced with concentrated β-1,3-glucanase extracted from wheat cultivars infested with RWASA2 for 3 days. The concentrations of the oligosaccharides in the hydrolysate were determined with LC-MS. LAM5, LAM4, LAM3, LAM2 and GLU represent laminaripentaose, laminaritetraose, laminaritriose, laminaribiose and glucose, respectively. Please click here to download this Table.
Discussion
Wheat and barley are cereal crops frequently infested by aphid species, including Russian wheat aphids (Diuraphis noxia)7,24. Resistant wheat plants induce the upregulation of POD and β-1,3-glucanase activities as defense responses throughout the infestation period to modify the cell wall by regulating callose and lignin accumulation6,25,26,27. It is important to note that most studies extracted the POD and β-1,3-glucanase enzymes from the apoplast3,12,28, making their cell wall functions highly speculative. The current study developed a method that extracted the cell wall-bound β-1,3-glucanase, MLG-specific β-glucanase, and POD as part of the total protein. These enzymes were highly active in the resistant wheat cultivars compared to the control, while their activity was delayed in the susceptible cultivars. Using the controls in the experiments helped with understanding the infestation's effects on the wall-bound enzymes' activity levels. Sampling the third and second leaf tissues for infested or control samples is important because it brings consistency. Also, sample the infested and the control with the same period because the POD, β-1,3-glucanase, and MLG-specific β-glucanase activity increase the wheat seedlings' growth.
The curdlan substrate used in this study has a chemical structure similar to that of callose, a polymer deposited in the cell wall region during the wheat-RWA interaction7,24. The barley MLG substrate represents the part of the cell wall hemicellulose present in low proportion compared to xylan in most monocots. The substrates were dissolved in sodium citrate pH 5 buffer to mimic the acidic condition of the plant cell wall region29. If the β-1,3-glucanase and MLG-specific β-glucanase were removed with the IWF, the total protein extracted from the remaining leaf tissue would not have activity on the MLG and curdlan substrates. Also, if the protein extracts were sourced from the cytoplasmic region, they would show activity at the neutral pH range. Interestingly, both enzymes were present in the total protein extract because they successfully hydrolyzed the MLG and curdlan substrates. The hydrolysis of the MLG and curdlan by the respective enzymes produced the reducing sugars, which were detected by the DNS reagent following a modified method by Mafa et al.6. When samples have higher total reducing sugars concentration, the DNS reagent color changes from yellow to dark brown or color changes from yellow to light brown (looks dark orange) when reducing sugars concentration is low.
Guaiacol substrate was used to measure POD activity. Due to POD's high catalytic efficiency, we measured its activity using the kinetic mode of the spectrophotometer. POD is activated by the low concentration of H2O2 in the presence of the substrate (Guaiacol). The activity of this enzyme converts guaiacol to form tetra-guaiacol, which is a brown-orange color compound. The production of the tetra-guaiacol confirms that POD cross-links phenolic compounds to produce oligomers or incorporates phenolic compounds into lignin. POD showed higher activity levels in the RWASA2-infested resistant Tugela-Dn5, followed by moderately resistant Tugela-Dn1 compared to controls. However, POD activity levels were significantly reduced over time in the infested susceptible Tugela. The findings of this study were supported by the claim that RWASA2-infested resistant wheat cultivars use POD to strengthen their cell wall by cross-linking the lignin or lignin-hemicellulose connections6. POD required H2O2 to function, which indicates that it reduced oxidation or bleaching of the cell wall structural carbohydrates by regulating levels of H2O2 in the cell wall region.
Different pH and temperature conditions were used to determine biochemical optimum conditions for these cell wall-bound enzymes. The optimum conditions showed that the enzymes have optimum activities at acidic pH ranges (pH 5), which suggests they were associated with the cell wall region. The optimum temperature for β-1,3-glucanase was obtained at 25 °C and 40 °C when hydrolyzing β-1,3-1,4-glucan and β-1,3-glucan substrates, respectively. This observation confirmed that the β-1,3-glucanases and MLG-specific β-glucanase were two different enzymes induced in the cell wall region of resistant wheat cultivars during RWASA2 infestation. Even though biochemical characterization is a promising method for discovering or identifying different enzymes with similar substrates, we still recommend using other laborious but accurate methods, including western blotting and zymogram assays. Lastly, we could not quantify the mode of enzyme activity for MLG-specific β-glucanase due to a lack of MLG-oligosaccharides. However, the β-1,3-glucanases extracted from the RWASA2-infested Tugela-Dn5 and Tugela-Dn1 displayed higher activity on LAM5, LAM4, and LAM3, while the one sourced from susceptible Tugela displayed higher activity on LAM5 and LAM4. This confirms that studying the mode of enzyme activity can also pick up subtle differences between the β-1,3-glucanases induced in the RWA-infested resistant and susceptible cultivars.
The current study gives a detailed procedure for extracting the cell wall-bound enzymes from wheat leaf tissue. After extraction, we identified three cell wall-bound enzymes, namely β-1,3-glucanase, MLG-specific β-glucanase, and POD. The activity levels of these enzymes were significantly higher in the RWASA2-infested moderately resistant Tugela-Dn1 and resistant Tugela-Dn5 cultivars than controls. These confirmed that the cell wall-bound enzymes contributed to the defense response in the resistant cultivars. The characterization findings give an insight that cell wall POD and β-1,3-glucanase function under the same conditions, suggesting they synergistically reinforce the cell wall during the wheat-RWASA2 interaction.
Some limitations have been identified that interfere with the current protocols discussed. The shortage of wheat plants can limit the leaf material available to extract the enzyme samples. If the IWF from the apoplast is not successfully extracted from the leaf samples before extracting the cell wall enzymes, it can lead to the combination of both apoplast and cell wall enzymes. The combination of the IWF and the cell wall region enzymes makes it difficult to study the cell wall-bound enzymes that are bound in the cell wall. No other limitations were identified in the current protocol.
Disclosures
The authors declare no conflict of interest involved in this work.
Acknowledgements
M. Mafa received funding from the NRF-Thuthuka (Reference Number: TTK2204102938). S.N. Zondo received the National Research Foundation Postgraduate Scholarship for his MSc degree. The authors are grateful to the Agricultural Research Council - Small Grain (ARC-SG) Institute for providing the seeds used in this study. Any opinion, findings, and recommendations expressed in this material are those of the author(s), and therefore, the funders do not accept any liability in regard thereto.
Materials
| Name | Company | Catalog Number | Comments |
|---|---|---|---|
| 10 kDa Centrifuge concentrating membrane device | Sigma-Aldrich | R1NB84206 | For research use only. Not for use in Diagnostic procedures. For concentration and purification of biological solutions. |
| 2 g Laminaribiose | Megazyme (Wicklow, Ireland) | O-LAM2 | High purity laminaribiose for use in research, biochemical enzyme assays and in vitro diagnostic analysis. |
| 3 g Laminaritriose | Megazyme (Wicklow, Ireland) | O-LAM3 | High purity laminaritriose for use in research, biochemical enzyme assays and in vitro diagnostic analysis. |
| 3,5 Dinitro salicylic acid | Sigma-Aldrich | D0550 | Used in colorimetric determination of reducing sugars |
| 4 g Laminaritetraose | Megazyme (Wicklow, Ireland) | O-LAM4 | High purity laminaritetraose for use in research, biochemical enzyme assays and in vitro diagnostic analysis. |
| 5 g Laminaripentaose | Megazyme (Wicklow, Ireland) | O-LAM5 | High purity laminaripentaose for use in research, biochemical enzyme assays and in vitro diagnostic analysis. |
| 95% Absolute ethanol | Sigma-Aldrich | 107017 | Ethanol absolute for analysis |
| acetic acid | Sigma-Aldrich | B00063 | Acetc acid glacial 100% for analysis (contains acetic acid) |
| Azo-CM-Cellulose | Megazyme (Wicklow, Ireland) | S-ACMC | The polysaccharide is dyed with Remazolbrilliant Blue R to an extent of approx. one dye molecule per 20 sugar residues. |
| Beta glucan (barley) | Megazyme (Wicklow, Ireland) | G6513 | A powdered substrate, less soluble in water. Used in determining β-1,3-glucanase activity. |
| Bio-Rad Protein Assay Dye | Bio-Rad Laboratories, South africa | 500-0006 | Colorimetric assay dye, concentrate, for use with Bio-Rad Protein Assay Kits I and II |
| Bovine serum albumin (BSA) | Gibco Europe | 810-1018 | For Laboratory use only |
| Citrate acid | Sigma-Aldrich | C0759 | For Life Science research only. Not for use in diagnostic procedures. |
| CM-curdlan | Megazyme (Wicklow, Ireland) | P-CMCUR | Powdered substrate for determining β-1,3-glucanase activity. Insoluble in water. |
| D-Glucose | Sigma-Aldrich | G8270 | For Life Science research only. Not for use in diagnostic procedures. |
| Guaiacol | Sigma-Aldrich | G5502 | Oxidation indicator. Used for determining peroxidase activity. |
| Hydrogen peroxide | BDH Laboratory Supplies, England | 10366 | Powerful oxidising agent. |
| Mikskaar Professional Substarte | Mikskaar (Estonia) | NI | Peat moss-based seedling substrate. |
| Multifeed fertiliser (5.2.4 (43)) | Multifeed Classic | B1908248 | A water soluble fertiliser for young developing plants and seedlings with a high phosphorus (P) requirement to ensure optimum root development. |
| Naphthol | Merck, Germany | N2780 | Undergoes hydrogenations in the presence of a catalyst. |
| Phenol | Sigma-Aldrich | 33517 | Light sensitive. For R&D use only. Not for drug, household, or other uses. SDS available |
| Potassium sodium tartrate tetrahydrate (Rochelle salt) | Sigma-Aldrich | S2377 | used in the preparation of 3,5-dinitrosalicylic acid solution used in the determination of the reducing sugar. |
| Silica plate (TLC Silica gel 60 F254) | Sigma-Aldrich | 60778-25EA | Silica gel matrix, with fluorescent indicator 254 nm |
| Sodium hydroxide | Sigma-Aldrich | S8045 | For R&D use only. Not for drug, household, or other uses. |
| Sodium metabisulfite | Sigma-Aldrich | 31448 | Added as an antioxidant during the preparation of 3,5-dinitrosalicylic acid solutions. |
| Sodium phosphate dibasic heptahydrate | Sigma-Aldrich | S9390 | Used as a buffer solution in biological research to keep the pH constant. |
| Sodium phosphate monobasic heptahydrate | Sigma-Aldrich | 71500 | An inorganic compound, which is soluble in water. Used as a reagent in the development of silicate-based grouts. |
| Statistical analysis software | TIBCO Statistica | version 13.1 | |
| Sulfuric acid | Merck, Darmstadt, Germany | 30743 | Sulfuric acid 95-97% for analysis of Hg, ACS reagent. |
| Tris-HCl | Sigma-Aldrich | 10812846001 | Buffering agent in incubation mixtures. It has also been used as a component of lysis and TE (Tris-EDTA) buffer. For life science research only. Not for use in diagnostic procedures. |
| UV–Visible Spectrophotometer | GENESYS 120 | ||
| NI = not identified. |
References
- Mohase, L., Vander Westhuizen, A. J. Salicylic acid is involved in resistance responses in the Russian wheat aphid-wheat interaction. J Plant Physiol. 159 (6), 585-590 (2002).
- Mohase, L., Vander Westhuizen, A. J. Glycoproteins from Russian wheat aphid-infested wheat induce defense responses. Z Naturforsch C J Biosci. 57 (9-10), 867-873 (2002).
- Moloi, M. J., Vander Westhuizen, A. J. The reactive oxygen species are involved in resistance responses of wheat to the Russian wheat aphid. J Plant Physiol. 163 (11), 1118-1125 (2005).
- Manghwar, H., et al. Expression analysis of defense-related genes in wheat and maize against Bipolaris sorokiniana. Physiol Mol Plant Pathol. 103, 36-46 (2018).
- Botha, C. E., Matsiliza, B. Reduction in transport in wheat (Triticum aestivum) is caused by sustained phloem feeding by the Russian wheat aphid (Diuraphis noxia). S Afr J Bot. 70 (2), 249-254 (2004).
- Mafa, M. S., Rufetu, E., Alexander, O., Kemp, G., Mohase, L. Cell-wall structural carbohydrates reinforcements are part of the defense mechanisms of wheat against Russian wheat aphid (Diuraphis noxia) infestation. Plant Physiol Biochem. 179, 168-178 (2022).
- Walker, G. P. Sieve element occlusion: Interaction with phloem sap-feeding insects - A review. J Plant Physiol. 269, 153582(2022).
- Botha, A. M. Fast developing Russian wheat aphid biotypes remains an unsolved enigma. Curr Opin Insect Sci. 45, 1-11 (2020).
- Saheed, S. A., et al. Stronger induction of callose deposition in barley by Russian wheat aphid than bird cherry-oat aphid is not associated with differences in callose synthase or β-1,3-glucanase transcript abundance. Physiol Plant. 135 (2), 150-161 (2009).
- Zondo, S. N. N., Mohase, L., Tolmay, V., Mafa, M. S. Functional characterization of cell wall-associated β-1,3-glucanase and peroxidase induced during wheat-Diuraphis noxia interactions. Research Square. , (2024).
- Jimoh, M. A., Saheed, S. A., Botha, C. E. J. Structural damage in the vascular tissues of resistant and non-resistant barley (Hordeum Vulgare L.) by two South African biotypes of the Russian wheat aphid. NISEB J. 14 (1), 1-5 (2018).
- Mohase, L., Taiwe, B. Saliva fractions from South African Russian wheat aphid biotypes induce differential defense responses in wheat. S Afri J Plant Soil. 32 (4), 235-240 (2015).
- Vander Westhuizen, A. J., Qian, X. M., Botha, A. M. β-1,3-glucanases in wheat and resistance to the Russian wheat aphid. Physiol Plant. 103 (1), 125-131 (1998).
- Bradford, M. M. A rapid and sensitive method for the quantification of microgram quantities of protein utilizing the principle of protein-dye binding. Anal Biochem. 72 (1-2), 248-254 (1976).
- Miller, G. L. Use of dinitrosalicylic acid reagent for determination of reducing sugar. Anal Chem. 31 (3), 426-428 (1959).
- Zieslin, N., Ben-Zaken, R. Peroxidases, phenylalanine ammonia-lyase and lignification in peduncles of rose flowers. Plant Physiol Biochem (Paris). 29 (2), 147-151 (1991).
- Damager, I., et al. First principles insight into the α-glucan structures of starch: Their synthesis, conformation, and hydration. Chemical Rev. 110 (4), 2049-2080 (2010).
- Nakashima, J., Laosinchai, W., Cui, X., Brown Jr, M. New insight into the mechanism and biosynthesis: proteases may regulate callose biosynthesis upon wounding. Cellulose. 10, 269-289 (2003).
- Cierlik, I. Regulation of callose and β-1,3-glucanases during aphid infestation on barley cv. Clipper. Master thesis in Molecular Cell Biology. , Sodertorn University College. Stockholm. (2008).
- Rahar, S., Swami, G., Nagpal, N., Nagpal, M. A., Singh, G. S. Preparation, characterization, and biological properties of β-glucans. J Adv Pharm Technol Res. 2 (2), 94(2011).
- Mafa, M. S., et al. Accumulation of complex oligosaccharides and CAZymes activity under acid conditions constitute the Thatcher + Lr9 defense responses to Puccinia triticina. Biologia. 78, 1929-1941 (2023).
- Megazyme. GOPOD reagent enzymes: Assay procedure. Megazyme. , 1-4 (2019).
- Hlahla, J. M., et al. The photosynthetic efficiency and carbohydrates responses of six edamame (Glycine max. L. Merrill) cultivars under draught stress. Plants. 11 (3), 394(2022).
- Botha, A. M., Li, Y., Lapitan, N. L. Cereal host interactions with Russian wheat aphid: A review. J Plant Interact. 1 (4), 211-222 (2005).
- Forslund, K., Pettersson, J., Bryngelsson, T., Jonsson, L. Aphid infestation induces PR-proteins differently in barley susceptible or resistant to the birdcherry-oat aphid (Rhopalosiphum padi). Physiol Plant. 110 (4), 496-502 (2000).
- Miedes, E., Vanholme, R., Boerjan, W., Molina, A. The role of the secondary cell wall in plant resistance to pathogens. Front Plant Sci. 5, 358(2014).
- Rajninec, M., et al. Basic β-1,3-glucanse from Drosera binate exhibits antifungal potential in transgenic tobacco plants. Plants. 10 (8), 1747(2021).
- Vander Westhuizen, A. J., Qian, X. M., Wilding, M., Botha, A. M. Purification and immunocytochemical localization of wheat β-1,3-glucanase induced by Russian wheat aphid infestation. S Afri J Sci. 98, 197-202 (2002).
- Cosgrove, D. J. Loosening of plant cell walls by expansins. Nature. 407 (6802), 321-326 (2000).
Reprints and Permissions
Request permission to reuse the text or figures of this JoVE article
Request Permission