Porous substrate electroporation (PSEP) pairs consistent, high throughput delivery with high cell viability. Introduction of transepithelial electrical impedance (TEEI) measurements provides insight into the intermediate processes of PSEP and allows for label-free delivery. This article discusses a method for performing PSEP delivery experiments and TEEI measurement analysis simultaneously.
A subscription to JoVE is required to view this content. Sign in or start your free trial.
Method Article
Porous Substrate-Based Electroporation with Transepithelial Electrical Impedance Monitoring
In This Article
Summary
Abstract
Porous substrate electroporation (PSEP) is an emerging method of electroporation that provides high throughput and consistent delivery. Like many other types of intracellular delivery, PSEP relies heavily on fluorescent markers and fluorescent microscopy to determine successful delivery. To gain insight into the intermediate steps of the electroporation process, a PSEP platform with integrated transepithelial electrical impedance (TEEI) monitoring was developed. Cells are cultured in commercially available inserts with porous membranes. After a 12 h incubation period to allow for the formation of a fully confluent cell monolayer, the inserts are placed in transfection media located in the wells of the PSEP device. The cell monolayers are then subjected to a user-defined waveform, and delivery efficiency is confirmed through fluorescent microscopy. This workflow can be significantly enhanced with TEEI measurements between pulsing and fluorescent microscopy to collect additional data on the PSEP process, and this additional TEEI data is correlated with delivery metrics such as delivery efficiency and viability. This article describes a protocol for performing PSEP with TEEI measurements.
Introduction
Electroporation is a technique in which cells are exposed to an electric field, creating temporary pores in the cell membrane through which cargos, including proteins, RNA, and DNA, can pass1,2. The most widely used version is bulk electroporation (BEP). BEP is performed by filling a cuvette with an electrolyte containing millions of cells, exposing the electrolyte to high voltage, and allowing cargo to enter the cells through diffusion or endocytosis1. There are many advantages to BEP, including high throughput and numerous commercially available systems. However, there are limitations to the BEP delivery. Inconsistent cell positioning relative to the electrodes and electric field shielding from adjacent cells causes significant variability in electric field exposure during BEP3,4. The high voltage required for BEP also has a significant negative impact on cell viability5. Since its inception in 20116, there has been growing interest in an electroporation method called porous substrate electroporation (PSEP), though it is sometimes referred to by other names, including localized electroporation and nano- or micro-electroporation1,7,8. In contrast to the cell suspension of BEP, PSEP is conducted on cells that are adherent to a porous substrate. Not only is an adherent state preferred for the majority of human cell lines9, but the pores in the substrate also focus on the electric current, localizing the transmembrane electrical potential (TMP) to specific regions of the cell membrane10,11. This localization allows for a significant reduction in applied voltage, decreasing damage and increasing cell viability. This combination of effects helps control cell membrane pore development, resulting in a more consistent and efficient delivery1,5,12.
A recent study introduced a PSEP device with a six-well, gold-plated electrode array for holding commercially available porous membrane inserts13 (Figure 1A,B), a practice that was first introduced by Vindis et al.14. The device can apply pulses and measure the electrical impedance across the cell monolayer, known as the transepithelial electrical impedance (TEEI), in real-time13. The user interface of the device allows complete control over the electroporation waveform and polarity. Importantly, real-time impedance measurements can be used to predict delivery outcomes without the need for expensive reagents or fluorescent markers, a concept known as label-free delivery15.
The PSEP platform consists of two major custom electrical components: the main body of the device, which houses the pulse generator and TEEI measurement equipment, and the electrode array, where the porous substrates are inserted, and the electroporation occurs. Diagrams for all custom electronics and 3D-printed components can be found at GitHub: https://github.com/YangLabUNL/PSEP-TEEI. In addition to the custom electronics, a computer is also required for the platform to function properly. The custom software requires MATLAB (version 2021a or later) to run, and Microsoft Excel to store and access data for analysis. The program controls the custom electronics and provides the graphical user interface (GUI) for adjusting settings. These programs were also made available at GitHub: https://github.com/YangLabUNL/PSEP-TEEI.
Preliminary data suggests this process is possible for different types of adherent cells (Figure 1C), but this article will only discuss the preparation of A431 cells using parameters that were found to be optimal for this cell line by Brooks et al.13. Additionally, because the propidium iodide (PI) cargo is cytotoxic, two experiments are performed, the first with a high concentration PI transfection media to quantify delivery efficiency, and the second with only cell culture media to measure TEEI over longer timescales. These experiments use identical electroporation waveforms, allowing the results to be correlated (Figure 1D).
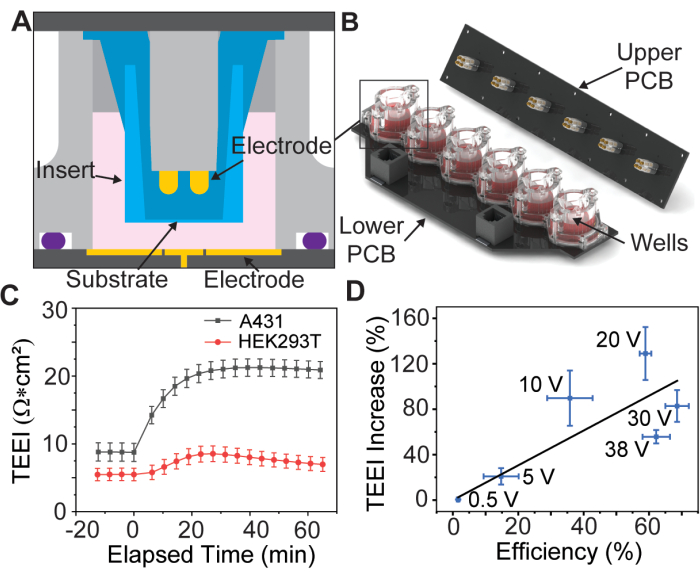
Figure 1: Electrode array assembly diagram and foundational data. (A) CAD model of an insert inside a well of the electrode array. (B) CAD model of the electrode array. (C) Impedance increase due to PSEP for select cell lines, n = 3 per cell line. Error bar: standard error of the mean. (D) Delivery efficiency vs. TEEI increase correlation data. Delivery efficiency was calculated by dividing the number of cells labeled in both PI and calcein images from delivery experiments by the total number of cells identified with Hoechst. Cell count was determined using a custom CellProfiler pipeline, n = 6 per voltage. Error bar: (x- and y-axis) standard error of the mean. This figure is reproduced from Brooks et al.13 with permission. Please click here to view a larger version of this figure.
Access restricted. Please log in or start a trial to view this content.
Protocol
The details of the reagents and the equipment used in the study are listed in the Table of Materials.
1. Preparation of reagents and cell culture
- Prepare the cell culture media by adding 50 mL of fetal bovine serum (FBS) and 5 mL of penicillin-streptomycin to a 500 mL container of Dulbecco's Modified Eagle Medium (DMEM). Produce eleven 50 mL aliquots to reduce the risk of contamination and refrigerate at 4 °C.
- Create 1 mL of 25 µg/mL human plasma fibronectin in phosphate-buffered saline (PBS) stock solution according to the manufacturer's instructions.
- Create 15 mL of 0.1 mg/mL propidium iodide in DMEM stock solution to allow for experiments with varying cargo concentrations.
- Culture A431 cells in a T75 flask containing 12 mL of the prepared cell culture media. Cells were passaged every 1-2 days to maintain 50% confluency.
2. Sample preparation
- Fibronectin coating
- Select twelve inserts and two 24-well plates. Place the inserts into one well plate, creating two rows of six. Set the second well plate aside until later.
- Create 1,300 µL of 1 µg/mL fibronectin solution by mixing 52 µL of fibronectin stock solution and 1,248 µL of PBS in a 1.5 mL tube.
- Distribute 100 µL of the fibronectin solution into each insert. Incubate the inserts in the well plate at 37 °C for 3 h.
- Adjusting the cell concentration for optimized cell density
- Around 1 h before the fibronectin incubation is complete, remove the T75 flask of A431 cells from the incubator for cell extraction.
- Remove the media in the flask with an aspirator and wash with 5 mL of PBS. Remove the PBS in the same fashion and add 3 mL of Trypsin. Incubate for 3-4 min before tapping the side of the flask to completely detach cells.
- Add 6 mL of cell culture media to the flask, mixing vigorously with a pipette to detach any remaining cells, and transfer contents to a 15 mL centrifuge tube. Centrifuge at 100 x g and 20 °C for 5 min.
- Remove the cell culture media and Trypsin from the centrifuge tube using an aspirator, being careful not to disturb the cell pellet. Add 1 mL of media to the centrifuge tube and pipette back and forth (without producing bubbles) to break up the cell pellet and resuspend the cells.
- Pipette 10 µL of the cell suspension, 40 µL of cell culture media, and 50 µL of trypan blue dye into a 200 µL tube, using a pipette to mix thoroughly.
- Remove 10 µL of the dye mixture and inject it into a hemocytometer. Count the cells using the 10% dilution of the dye mixture to estimate the total cell count in the 15 mL centrifuge tube.
NOTE: For this protocol, assume a concentration of 5,000,000 cells/mL. - Multiply the desired seeding density by the insert membrane's surface area, divide by the counted cells/mL in the suspension, and multiply by 1,000 to calculate the required microliters of cell suspension per insert.
- To find the total quantity of cell suspension required, multiply this figure by 10 (to ensure enough cells for 9 samples, as 3 of the 12 inserts will be cell-free controls), and round up to the nearest whole number. In this case, a total of 135 µL of the cell suspension is required for this experiment.
- Create 2,000 µL of adjusted cell solution by mixing the previously calculated 135 µL of the cell suspension with 1,865 µL of cell culture media in a separate 15 mL centrifuge tube.
- Seeding cells
- Remove the excess fibronectin from each insert once the fibronectin incubation is complete.
- Wash the inserts twice by adding 100 µL of sterile distilled water to each insert. Remove the water following the same order as it was added to ensure a consistent wash time between inserts.
- Wash the insert again by adding 100 µL cell culture media to each insert. Remove the media following the same order as it was added to ensure a consistent wash time between inserts.
- Cell sample inserts
- Seed cells by pipetting 200 µL of adjusted cell solution into each insert. To ensure consistent confluency between inserts, mix the cell solution in the centrifuge tube prior to distribution and mix again within each insert after distribution.
- Negative control inserts
- Pipette 200 µL of cell culture media into each insert. To remain consistent with the cell sample inserts, use the pipette to mix the cell culture media within each insert.
- Labeling and incubation
- Draw a line dividing the second well plate into two columns that are three wells wide (for conditions run in triplicate) using a permanent marker. Separate each column into rows. Label each region in the grid with relevant parameters.
- Add 1 mL of cell culture media to every well to receive an insert for the experiment. Transfer the inserts from the preparation well plate to their appropriate location in the labeled experiment well plate and incubate at 37 °C for at least 12 h.
3. Experimental procedure
- Delivery experiment
- Pipette 1.5 mL of the 0.1 mg/mL PI solution into each well in the electrode array. Place an insert into each well in the electrode array, fitting the feet of the insert into the alignment grooves so the insert is flush with the upper surface of the well (Figure 1A,B).
- Screw the top electrode printed circuit board (PCB) to the top of the electrode array wells and connect the electrode array to the PSEP device.
- Place the electrode array in the 37 °C incubator for at least 1 h to allow the temperature to equilibrate.
- Click the drop-down next to "Membrane" in the top left corner of the GUI and click on 400 nm GBO. Repeat this step for "Electrolyte", "Cells", "Cell Seeding Density", and "Cell Duration", selecting DMEM, A431, 200, and 12, respectively.
NOTE: These values are for record-keeping purposes only, and do not impact the function of the device. Please ensure to adjust these values as necessary for correct data tracking. - Type 1 into the Post Pulse Time Duration (min) edit field on the right side of the GUI to change the default post-pulse measurement time to 1 min. Leave all other settings in the default state.
NOTE: Default pulse parameters create a square waveform with 30 volts, 20 Hz, 1 ms duration, and 200 pulses. Default TEEI measurement parameters are 0.5 volts and 100 Hz, 1,000 Hz, 10,000 Hz, and 100,000 Hz. - Click on the Run button and enter appropriate names for wells 1-3 and 4-6 when prompted. Click on OK to start the experiment.
- Remove the electrode array from the incubator and transfer the inserts back into the original locations in the experiment well plate when the program has finished executing.
- Mix 2 µL of Hoechst 33342 and 5 µL of calcein AM with 123 µL of cell culture media in a 200 µL tube.
- Gently pipette 10 µL of the stain solution into each post-pulse insert and place the inserts back into the incubator for 5 min.
- Transfer the well plate to the plate holder of a fluorescent microscope with a 5x magnification objective. Image using brightfield and the fluorescence of each stain. Center the insert over the objective before triggering the camera.
NOTE: The excitation wavelengths for PI, calcein AM, and Hoechst 33342 are 558 nm, 495 nm, and 353 nm, respectively. The emission wavelengths are 575 nm, 519 nm, and 465 nm, respectively.
- TEEI measurement experiment
- Pipette 1.5 mL of the cell culture media into each well in the electrode array. Place cell sample inserts into wells 1-3 and control inserts into wells 4-6, fitting the feet of the insert into the alignment grooves so the insert is flush with the upper surface of the well.
- Screw the top electrode PCB to the top of the electrode array wells and connect the electrode array to the PSEP device.
- Place the electrode array in the 37 °C incubator for at least 1 h to allow the temperature to equilibrate.
- Click on the drop-down next to "Membrane" in the top left corner of the GUI and click on 400 nm GBO. Repeat this step for "Electrolyte", "Cells", "Cell Seeding Density", and "Cell Duration", selecting DMEM, A431, 200, and 12, respectively.
NOTE: These values are for record-keeping purposes only, and do not impact the function of the device. Please ensure to adjust these values as necessary for correct data tracking. - Leave all remaining settings in the default state.
NOTE: Default pulse parameters create a square waveform with 30 volts, 20 Hz, 1 ms duration, and 200 pulses. Default TEEI measurement parameters are 0.5 volts and 100 Hz, 1,000 Hz, 10,000 Hz, and 100,000 Hz. - Click on the Run button and enter appropriate names for wells 1-3 and 4-6 when prompted. Click on OK to start the experiment.
- Remove the electrode array from the incubator and transfer the inserts back into the original locations in the experiment well plate when the program has finished executing.
- Mix 2 µL of Hoechst 33342, 5 µL of calcein AM, and 10 µL of PI with 113 µL of cell culture media in a 200 µL reaction tube.
- Pipette 10 µL of the stain solution into each post-pulse insert and place the inserts back into the incubator for 5 min.
- Transfer the well plate to the plate holder of a fluorescent imaging microscope with a 5x objective lens. Image using brightfield and the fluorescence of each stain. Center the insert over the lens before triggering the camera.
NOTE: The excitation wavelengths for PI, calcein AM, and Hoechst 33342 are 558 nm, 495 nm, and 353 nm, respectively. The emission wavelengths are 575 nm, 519 nm, and 465 nm, respectively.
4. Data analysis
- Analyzing image data with the CellProfiler pipeline
- Use the custom CellProfiler workflow that is provided at GitHub:https://github.com/YangLabUNL/PSEP-TEEI to process the delivery and TEEI measurement experiment images.
- TEEI analysis
- Click on the Analysis tab in the GUI.
- Toggle the impedance type indicator to TEEI at the bottom of the GUI.
- Click on the arrow in the top left box to show all the experiment names in the data file. Select all cell sample data from the TEEI measurement experiment.
- Click on the arrow in the next box to the right to show all the experiment names in the data file. Select all control insert data from the TEEI measurement.
- Click on Run. A basic figure containing selected cell sample data at the lowest measurement frequency will appear.
- In the sample options box on the right-hand side of the GUI, click on the arrow to show all selected insert data. Outliers can be removed by selecting the appropriate data and clicking on Remove below.
NOTE: Any data that was removed from the analysis by the last click of the Remove button can be retrieved by the Undo button. - Click on Done to move on to the next figure when the desired data is shown in the figure.
- Repeat steps 4.2.6 and 4.2.7 for the remaining cell sample data and control data. When the final dataset has been confirmed by clicking "Done", the full analysis figure will appear.
- Save the analysis figure.
Access restricted. Please log in or start a trial to view this content.
Results
The given protocol establishes a method for using TEEI measurements to examine the intermediate processes of electroporation and make delivery predictions, specifically for the A431 cell line and PI cargo. While modification of this protocol is discussed further in the article, it is important to note now that while the specific values may change, general trends in the response remain consistent. For example, TEEI data that dips below the initial baseline corresponds with cell death, while the maximum increase in TEEI va...
Access restricted. Please log in or start a trial to view this content.
Discussion
Figure 2C demonstrates that TEEI increases from minimum and decreases from baseline are plotted for each PSEP waveform voltage. The TEEI increase creates a parabolic arc, peaking around 20 volts before reducing, while the TEEI decrease from baseline increases exponentially as voltage increases. The delivery efficiency and death percentages in Figure 2D mirror these trends, with delivery efficiency arcing parabolically, peaking around 30 volts, and death increasi...
Access restricted. Please log in or start a trial to view this content.
Disclosures
The authors declare no conflict of interest.
Acknowledgements
We acknowledge the funding support from the NSF (Awards 1826135, 1936065, 2143997), the NIH National Institutes of General Medical Sciences P20GM113126 (Nebraska Center for Integrated Biomolecular Communication) and P30GM127200 (Nebraska Center for Nanomedicine), the Nebraska Collaborative Initiative and the Voelte-Keegan Bioengineering Support. The device was manufactured at the NanoEngineering Research Core Facility (NERCF), which is partially funded by the Nebraska Research Initiative.
Access restricted. Please log in or start a trial to view this content.
Materials
| Name | Company | Catalog Number | Comments |
|---|---|---|---|
| 15 mL Conical Centrifuge Tube | Thermo Scientific | 339651 | |
| 2-Chip Disposable Hemocytometer | Bulldog Bio | DHC-N01 | |
| 75 cm2 Tissue Culture Flask | fisherbrand | FB012937 | |
| A431 Cells | ATCC | CRL-1555 | |
| Calcein AM | Invitrogen | C3099 | |
| Class II Type A2 Biosafety Cabinet | Labgard | NU-543-600 | |
| Custom Components | YangLab | https://github.com/YangLabUNL/PSEP-TEEI | |
| Disposable Centrifuge Tube (50 mL) | fisherbrand | 05-539-6 | |
| DMEM | Gibco | 11965092 | |
| Fetal Bovine Serum | Gibco | A5670401 | |
| Fluid Aspiration System | vacuubrand | 20727403 | |
| HERACELL 240i | Thermo Scientific | 51026331 | |
| Hoechst 33342 | Thermo Scientific | 62249 | |
| Human Plasma Fibronectin | Sigma-Aldrich | FIBRP-RO | |
| Inverted Fluorescent Microscope | Zeiss | 491916-0001-000 | |
| Inverted Microscope | Labomed | TCM 400 | |
| PBS | cytiva | SH30256.02 | |
| PCR Tube 200 µL | Sarstedt | 72.737 | |
| Penicillin / Streptomycin | Gibco | 15140148 | |
| Pipette (0.2-2 µL) | fisherbrand Elite | FBE00002 | |
| Pipette (100-1000 µL) | fisherbrand Elite | FBE01000 | |
| Pipette (20-200 µL) | fisherbrand Elite | FBE00200 | |
| Pipette (2-20 µL) | fisherbrand Elite | FBE00020 | |
| Propidium Iodide | Invitrogen | P1304MP | |
| Reaction Tube 1.5 mL | Sarstedt | 72.690.300 | |
| Sorvall ST 16R Centrifuge | Thermo Scientific | 75004240 | |
| Thincert (24-well) | Greiner Bio-One | 662 641 | 0.4 µm pore diameter, 2x106 cm-2 pore density, transparent PET |
| Tissue Culture Plate (24-well) | fisherbrand | FB012929 | |
| Trypan Blue Solution | Sigma-Aldrich | T8154-20mL | |
| Trypsin | Gibco | 15090046 |
References
- Brooks, J., et al. High throughput and highly controllable methods for in vitro intracellular delivery. Small. 16 (51), e2004917(2020).
- Stewart, M. P., Langer, R., Jensen, K. F. Intracellular delivery by membrane disruption: Mechanisms, strategies, and concepts. Chem Rev. 118 (16), 7409-7531 (2018).
- Canatella, P. J., Karr, J. F., Petros, J. A., Prausnitz, M. R. Quantitative study of electroporation-mediated molecular uptake and cell viability. Biophys J. 80 (2), 755-764 (2001).
- Pliquett, U., Gift, E. A., Weaver, J. C. Determination of the electric field and anomalous heating caused by exponential pulses with aluminum electrodes in electroporation experiments. Bioelectrochem Bioenerg. 39 (1), 39-53 (1996).
- Pan, J., et al. Cell membrane damage and cargo delivery in nano-electroporation. Nanoscale. 15 (8), 4080-4089 (2023).
- Boukany, P. E., et al. Nanochannel electroporation delivers precise amounts of biomolecules into living cells. Nat Nanotechnol. 6 (11), 747-754 (2011).
- Chang, L., et al. Micro-/nanoscale electroporation. Lab Chip. 16 (21), 4047-4062 (2016).
- Patino, C. A., et al. Multiplexed high-throughput localized electroporation workflow with deep learning-based analysis for cell engineering. Sci Adv. 8 (29), 7637(2022).
- Sagvolden, G., Giaever, I., Pettersen, E. O., Feder, J. Cell adhesion force microscopy. Proc Natl Acad Sci U S A. 96 (2), 471-476 (1999).
- Ishibashi, T., Takoh, K., Kaji, H., Abe, T., Nishizawa, M. A porous membrane-based culture substrate for localized in situ electroporation of adherent mammalian cells. Sensors Actuators B: Chem. 128 (1), 5-11 (2007).
- Mukherjee, P., Nathamgari, S. S. P., Kessler, J. A., Espinosa, H. D. Combined numerical and experimental investigation of localized electroporation-based cell transfection and sampling. ACS Nano. 12 (12), 12118-12128 (2018).
- Brooks, J. R., et al. An equivalent circuit model for localized electroporation on porous substrates. Biosens Bioelectron. 199, 113862(2022).
- Brooks, J. R., et al. Transepithelial electrical impedance increase following porous substrate electroporation enables label-free delivery. Small. 20 (25), 2310221(2023).
- Vindiš, T., et al. Gene electrotransfer into mammalian cells using commercial cell culture inserts with porous substrate. Pharmaceutics. 14 (9), 1959(2022).
- Ye, Y., et al. Single-cell electroporation with real-time impedance assessment using a constriction microchannel. Micromachines. 11 (9), 856(2020).
- Bednarek, R. In vitro methods for measuring the permeability of cell monolayers. Methods Protoc. 5 (1), 17(2022).
- Harhaj, N. S., Antonetti, D. A. Regulation of tight junctions and loss of barrier function in pathophysiology. Int J Biochem Cell Biol. 36 (7), 1206-1237 (2004).
- Hunter, R. J. Zeta potential in colloid science: Principles and applications. 2, Academic Press. (2013).
- Wong, P. K., Wang, T. -H., Deval, J. H., Ho, C. -M. Electrokinetics in microdevices for biotechnology applications. IEEE/ASME Trans Mechatron. 9 (2), 366-376 (2004).
- Qian, K., Wang, Y., Lei, Y., Yang, Q., Yao, C. An experimental and theoretical study on cell swelling for osmotic imbalance induced by electroporation. Bioelectrochemistry. 157, 108637(2024).
- Fox, M. B., et al. Electroporation of cells in microfluidic devices: A review. Anal Bioanal Chem. 385 (3), 474-485 (2006).
Access restricted. Please log in or start a trial to view this content.
Reprints and Permissions
