Here, we present the measurement protocol of the bi-directional axial transmission (BDAT) ultrasonic device in detail and test it in a reproducibility study, considering 14 healthy participants and 3 operators. Reliability, measured with the intraclass correlation coefficients (ICC), was good to excellent for four parameters of interest.
Method Article
Cortical Bone Assessment Using Ultrasonic Guided Waves: A Reproducibility Study in a Healthy Population
In This Article
Summary
Abstract
Fragility fractures are still a worldwide health burden in the context of population aging. In particular, the global number of hip fractures is expected to double between 2020 and 2050. Therefore, it is essential to detect patients at risk of fragility fracture at the population scale. The current golden standard is dual X-ray absorptiometry (DXA), providing the areal bone mineral density (aBMD). Ultrasonic devices, usually more portable and cheaper than X-ray devices, represent interesting DXA alternatives as screening tools. However, operator dependency is usually recognized as their main drawback. In this study, the measurement protocol of the bi-directional axial transmission (BDAT) ultrasonic device is presented in detail. The dedicated ultrasonic probe is placed at the one-third distal radius of the non-dominant forearm using conventional coupling gel. The guided interface provides in quasi-real time (about 2 Hz) four parameters of interest: velocities of the first arriving signal (vFAS) and the A0 mode (vA0), cortical thickness (Ct.Th) and porosity (Ct.Po), as well as four quality parameters. The operator moves the probe slowly at the measurement site, carefully observing the feedback provided by the interface until finding a stable position and starting a series of 10 acquisitions. When at least four consistent series are obtained, the measurement ends, and an automatic report is generated. The measurement usually takes about 5 min to complete. To determine the robustness of this protocol, a reproducibility study was conducted among 3 operators (one expert and two novices) and 14 healthy participants (6 women, 8 men, 21-53 years old). The intraclass correlation coefficients (ICC) were found good for vA0 (0.76), Ct.Po (0.80) or excellent for Ct.Th (0.87) and vFAS (0.91). The standard deviations were found to be less than 10% of the total ranges in clinical practice.
Introduction
Osteoporosis and associated fragility fractures still constitute a major public health problem1. In particular, the worldwide number of hip fractures is expected to double until 20502. Bone fragility is due to a slow and silent process of demineralization and bone loss without major alert signs before the fragility fracture event. The current gold standard to detect patients at risk of fragility fracture is the dual X-ray absorptiometry (DXA), providing a 2D, low-resolution X-ray image with a calibrated gray pixel3. From this image, it is possible to extract the areal bone mineral density (aBMD in g.cm-2) at different regions of interest associated with the main fragility fracture sites: spine, wrist, and hip. The aBMD value decreases as the fragility fracture rate increases3. Moreover, the T-score normalization, with respect to a normal healthy population, allows the comparison of patients measured with devices proposed by different manufacturers. The DXA T-score has been proposed by the World Health Organization to define the osteoporosis diagnostic in three stages: normal (T-score < -1), osteopenic (- 1 < T-score < -2.5), and osteoporotic (T-score < -2.5)4.
DXA presents several limitations: its size, relatively high cost, need for a dedicated room, and its ability to discriminate between fractured and non-fractured, as well as its availability in numerous countries, such as in Latin America, are both moderate5. Thus, there is a need for DXA alternatives as screening tools for fragility fracture risk estimation6. However, some DXA alternatives, such as quantitative computerized tomography and its derivatives7, magnetic resonance imaging (MRI)8, are also bulky and not widely available. Quantitative ultrasound (QUS) presents the potential for portable, robust, easy-to-use screening devices. Different devices have been developed for cortical bone assessment, associated with different frequencies ranging from a few kHz to a few MHz and different transducer positioning in transmission, retro diffusion9, pulse echo10, and axial transmission where the transducers are aligned with the axis of a long bone such as radius and tibia. Some devices provide aBMD surrogates11, whereas others provide "classical" ultrasonic parameters such as velocities12 or attenuation coefficients9 and even geometrical and material parameters, for instance, cortical thickness, porosity, or pore size distribution9. However, to this day, QUS has not yet succeeded in being widely used in clinical practice for bone assessment, partly due to the lack of homogenization between devices and operator dependency13.
Amongst QUS technologies proposed as DXA alternatives, axial transmission (AT) has the advantage that the measurement can be performed at the forearm, a site (i) easily accessible and (ii) close to one of the major sites of fragility fractures, i.e., the wrist. The first proposed AT parameter depends on the ultrasonic propagation velocity in the cortical layer, denoted speed of sound (SOS) or velocity of the first arrival signal (vFAS), depending on the signal processing and the devices, some being commercial12,14 ones and other laboratory prototypes15,16. This parameter has been able to discriminate between patient groups with or without fragility fractures with performances similar to BMD in several clinical studies since the late 1990s14,15. It has also been successfully applied for multicentre longitudinal studies, demonstrating its clinical application and robustness12. The vFAS precision has been improved by combining the two opposite directions of propagation in order to reduce the bias due to the angle between the probe and the bone surface16,17. This point of view has been denoted bi-directional AT (BDAT).
Even if vFAS has shown clinical interest, its main drawback, similar to BMD, is that it combines different key cortical bone features such as geometrical and material properties, making its clinical interpretation not straightforward. That is why the guided wave point of view has been proposed, considering its potential due to the fine sensitivity of guided waves to the waveguide properties. This approach should combine signal processing, waveguide modeling, and inverse problems and is largely used in non-destructive testing considering, for instance, metallic waveguides, such as plates or tubes18. Thus, a second-generation BDAT device has been developed step by step since 2010, from bone-mimicking phantoms19 to ex vivo validation20 and in vivo measurements21. The device has been successfully tested in clinical studies in France22, Germany23, United Kingdom24, and Chile25, and it has shown improving results in terms of success rate and patient discrimination.
This study aims to explore the reproducibility of the current BDAT ultrasonic device. First, the device and the measurement protocol will be detailed. Results obtained with 14 participants and 3 operators will be presented and discussed in terms of population screening for the detection of patients at risk of fragility fractures.
Measurement principle: signal processing, parameters of interest, and quality parameters
The bi-directional axial transmission (BDAT) device is composed of different parts, the main being the ultrasonic probe, the electronic module, and the computer. The complete list is detailed in the Table of Materials and illustrated in Figure 1. In the following, the parameters of interest, the measurement quality parameters, and the measurement protocol are described.
vFAS
Once the sampled signals are received by the computer, they are processed following different steps. The first step consists of signal processing in the time domain, detecting the FAS using the protocol described previously16,17. Once the arrival time is obtained for each receiver, it is possible to determine the FAS velocity, later denoted vFAS, which is the harmonic mean of the velocities obtained in both directions of propagation. Combining the information from both directions of propagation, it is possible to obtain the value angle between the probe and bone surface directions and to derive an unbiased vFAS value16. This bi-directional angle is later denoted alpha and is used as a parameter of measurement quality. This temporal processing also allows the estimation of the thickness of soft tissue between the bone surface and the probe, denoted ST.Th26.
Guided wave spectrum image
The second step consists of signal processing in the Fourier domain, considering the temporal and spatial frequencies, denoted f and k. The approach is an SVD-based method, allowing the transformation of the spatio-temporal signals into the Norm function, also denoted guided wave spectrum image (GWSI), as illustrated in Figure 2 for an in vivo forearm19. The method combines two Fourier transforms (time and space) and a singular value decomposition (SVD), allowing one to visualize the presence rate in the received signals (in a 0-1 scale) of the modes guided by the cortical bone layer. The GWSI can be interpreted as an enhancement of the spatio-temporal Fourier Transform, with each pixel being associated with an independent plane of frequency f and wavenumber k. Note that the approach has been improved in order to take into account the impact of material attenuation27 and linear thickness variation28.
Particular attention will be given to the upper part of the spectrum, associated with the A0 mode, and also to the lowest part, associated with the highest phase velocity values, i.e., larger than 4 mm·µs-1. This part corresponds to the region of interest 3 (ROI 3)29. The mean value of ROI 3, later denoted lowk, is also used as a quality parameter. A large value corresponds to a regular waveguide, allowing clear wave reflections at the bone interfaces. If the value decreases, it could be due to an irregular waveguide or a misplaced probe.
Waveguide model
The guided wave dispersion, or the variation of the phase velocity of each guided mode with respect to the frequency, depends on both the material and geometric properties of the waveguide. Thus, it is potentially possible to retrieve these properties using dedicated signal processing, waveguide modeling, and inverse problem schemes. In the BDAT case, the waveguide model corresponds to a 2D-transverse isotropic free plate, depending on the waveguide material and one geometric parameter, the thickness30. The cortical bone material is homogenized considering fixed parameters for the bone matrix and variable porosity31. Thus, the inverse problem depends on two parameters, denoted cortical thickness (Ct.Th) and cortical porosity (Ct.Po). The effects of material absorption, waveguide curvature, and surrounding soft tissues are not taken into account in the model, even if they impact the measurement. However, their weight on the inverse problem result was not found to be determinant, meaning that the modes in the two main regions of interest (A0 and lowest part) are not significantly changed by the curvature and the soft tissues32.
Inverse problem
Initially, the inverse problem was divided into two steps: first, extract the experimental guided wave dispersion, and second, compare with the waveguide model. This point of view was limited by noise and mode labeling30,32. Thus, a dedicated approach was proposed to overcome these limitations as an extension of the Norm function point of view. Instead of considering each plane wave independently, only the possible guided waves provided by the waveguide model are taken into account20. This leads to the inverse problem image, expressed in the model parameter domain, i.e., the Ct.th - Ct.Po plane (Figure 2 bottom right). The best-fitting model is given the maximum position, while eventual secondary peaks (indicated by the inverse problem images with a gray dot) correspond to ambiguous solutions, indicated in the f-k comparison with experimental modes with light gray lines. As before, the pixel value is normalized by construction and reflects, in this case, the presence of one particular waveguide model in the received signals. The maximum value (denoted max) and the difference with the second maximum (denoted diff) are also used as quality parameters.
The inverse problem has been originally proposed for offline calculation, i.e., once the signals are acquired, using the exact values of the model wave numbers. This approach has been validated for both radius and tibia sites considering ex vivo20,33 and in vivo21,34,35 studies. In order to include these calculations in the human-machine interface (HMI), an approximated version, compatible with the real-time application, has been proposed, using a sparse matrix point of view36.
vA0
From the GWSI, it is also possible to extract the velocity of the slowest guided mode, associated with the first antisymmetric mode A0 of the free plate or Lamb model33,35. The upper part of the guided wave spectrum can be linearly approximated, with the slope providing the value of the velocity vA0 (Figure 2 bottom left).
Parameter summary:
Finally, four parameters of interest are measured: (i) vFAS: velocity of the First Arriving Signal (m·s-1); (ii) vA0: velocity of the slowest guided mode (m·s-1); (iii) Ct.Th: cortical thickness (mm); and (iv) Ct.Po: cortical porosity (%).
Four quality parameters are considered: (i) alpha: bi-directional angle (°); (ii) lowk: mean value of lowest part of the GWSI (normalized value between 0 and 1); (iii) max: maximum of the inverse problem function (normalized value between 0 and 1); and (iv) diff: the difference between the first and second maxima of the inverse problem function (normalized value between 0 and 100).
All these parameters, as well as the two guided wave spectrum images (one par direction of propagation) and the inverse problem image, are displayed in "real-time" by the HMI, with a frame rate of about 2 Hz. A typical example is illustrated in Figure 3. In the following section, the method of using these parameters is described in detail. The main idea is that the operator moves the probe slowly at the measurement site, carefully observing the feedback provided by the different parts of the interface until finding a stable position and starting a series of 10 acquisitions. When at least four consistent series are obtained, the measurement ends, and an automatic report is generated.
Protocol
The study was approved by the Ethical Committee of Universidad de Valparaiso, Chile, under protocol number CEC213-20. Written informed consent was provided for the participants. A telephone interview was carried out to establish the inclusion/exclusion of the participants. The study has been registered under the following reference: NCT05424536.
1. Device set up
- Place the device's main parts on a large table.
- Place side by side the following parts: electric insulation transformer, electronic module and laptop computer on a large table. Ensure there is sufficient space in front of these parts in order to place the participant's forearm with ease later.
- Eventually, place the laptop computer directly on the electronic module in case of limited space, taking care not to obstruct the ventilation windows of the module, which are clearly indicated.
- Connect the electric insulation transformer.
- Plug the electric insulation transformer into the room's domestic power using a dedicated cable.
- Connect the electronic module.
- Connect the electronic module to the electric insulation transformer using a dedicated power cable.
- Press the ON-OFF button on the transformer to power the module.
- Connect the laptop computer.
- Connect the laptop computer to the module using the dedicated universal serial bus (USB) cable to send the digitized received signals to the computer for further processing.
- If the laptop needs to be powered, connect its power cable to the electronic insulation transformer.
- Connect the ultrasonic probe.
- Connect the ultrasonic probe to the module with the dedicated cable slot situated on the front side of the module. There are two different probes for forearm and leg measurement sites. In this study, only the radius (forearm probe) is considered.
- Connect the pedal switch.
- Place the pedal switch on the floor close to the feet, considering the operator's position while measuring a participant. Connect the pedal switch to the computer using a USB cable. Use the pedal to start the acquisition series.
2. Participant installation
- Position the participant.
- Invite the participant to sit in front of the operator with his naked forearm resting on the table in front of the device previously installed (see Figure 3).
NOTE: The contralateral side is measured (i.e., the left side for a right-handed participant).
- Invite the participant to sit in front of the operator with his naked forearm resting on the table in front of the device previously installed (see Figure 3).
- Mark the measurement site (one-third distal radius).
- Measure the radius length using the ruler from the radial styloid (bone end close to the wrist) to the elbow.
- Divide this length by three.
- Mark the measurement site, i.e., one-third distal radius, using the pen by measuring one radius length third from the wrist.
- Start the HMI software.
- Start the HMI software by clicking on the corresponding icon on the laptop desktop.
- Add the participant's data.
- Add the participant's data (anonymized ID, laterality, measured site, operator's ID, gender, etc.) using the pop-up window, which automatically opens when the software starts.
- Add ecographic gel.
- Add ecographic gel on the front side of the probe and on the measurement site, marked on the participant's forearm, to ensure ultrasonic wave propagation.
- Put the probe in contact with the forearm.
- Put the probe in contact with the forearm, with the probe center placed on the mark previously done in step 2.2.
3. Looking for a stable position
NOTE: The HMI displays four parameters of interest: two velocities, vFAS and vA0, and two inverse problem values, cortical thickness (Ct.Th) and cortical porosity (Ct.Po). The HMI also displays four quality parameters denoted alpha, lowk, max, and diff. These parameters are described in detail in the introduction.
- Start the real time visualization.
- Start the real time visualization by clicking on the start button on the right bottom side of the software interface. The duration between two successive value displays is about 0.5 s.
- Find a stable vFAS value.
- Slowly adjust the probe position while observing the vFAS parameter value displayed in a specific case of the interface. Normal values range from about 3800 m∙s-1 to about 4200 m∙s-1.
- If a stable position is found, ensure that the vFAS variation is less than about 40 m∙s-1 between two successive calculations.
- Adjust the bidirectional angle.
- Slowly adjust the probe position while observing the bidirectional value (quality parameter alpha) displayed in a specific case of the interface.
- Adjust the probe position by softly adding pressure on one probe side until the angle absolute value is less than 2° to improve the parallelism between the probe and the bone surface.
- Find a stable vA0 value.
- Slowly adjust the probe position while observing the vA0 parameter value displayed in a specific case of the interface. Normal values range from about 1500 m∙s-1 to about 1900 m∙s-1.
- If a stable position is found, ensure that the vA0 variation is less than about 40 m∙s-1 between two successive calculations.
- In case of difficulty, observe the guided wave image spectra displayed on the right column of the interface. Ensure that the upper part of the spectrum appears as a continuous line, whose slope provides the vA0 value.
- Observe the inverse problem image.
- Observe the inverse problem image, which appears automatically once the two velocities (vFAS and vA0) and angle values are stabilized.
- Ensure that the image shows at least one maximum, indicated with a clear pixel, and eventually, one or several secondary maxima, indicated with a different color. The three missing quality parameters (max. diff, lowk) are automatically calculated in real time.
- Improve the inverse problem image.
- Slowly adjust the probe position while observing the inverse problem image maxima.
- Find the highest possible first maximum and the lowest possible secondary maximum while looking at the corresponding cases of the interface (max and diff values).
- In case of difficulty, observe the guided wave spectrum image displayed on the right column of the interface. Ensure that the lower part of the spectrum appears with a few continuous lines, as long as possible, associated with high phase velocity modes and the parameter quality lowk, as high as possible.
- Find a stable position.
- Once an acceptable inverse problem image is found, stabilize the probe position. Ensure that no significant changes of the inverse problem image are seen between two successive calculations.
4. Data acquisition
- Start a series of 10 acquisitions.
- Once a stable position is found, start a series of 10 acquisitions by pressing the pedal switch with the foot.
- Remain as stable as possible during the 10 acquisitions, lasting about 5 s.
- Control the quality of the series.
- Look at the means and standard deviations of the parameters of interest, which are automatically calculated and shown in pop-up windows appearing once the series ends.
- If the standard deviations are lower than fixed thresholds, take the series into account. On the contrary, reject the series.
- Answer to the question asked in a second pop-up window, asking if the operator would like to stop or continue with the acquisition series of the same participant.
- Reposition the probe.
- Start again the previous steps (from steps 2.1 to 3.2) to find more stable positions and acquire more series of 10 acquisitions. Eventually, if needed, let the participant rest between two repositionings.
- As before, means and standard deviations of the parameters of interest are automatically calculated for each series.
- Look at the result pop up window to check if the last acquired series is kept or rejected. The participant's measurement finishes when at least four consistent series are registered. Outsider series are automatically rejected.
- Obtain the final values.
NOTE: The final values of the parameters of interest are automatically obtained, considering the mean of the means obtained with the consistent series. - Verify the automatic report pdf.
- Verify that the final values are reported in the report pdf automatically and instantly generated once the option stop is chosen in the pop-up window. An example is shown in Figure 4.
NOTE: The pdf is located in the same folder as the raw data, which could be reanalyzed later offline.
- Verify that the final values are reported in the report pdf automatically and instantly generated once the option stop is chosen in the pop-up window. An example is shown in Figure 4.
- Verify the second precise report.
- Verify the second precise report generated using the exact waveguide model values for the inverse problem calculation instead of approximated values as in the case of the first automatic report. The second report generation takes less than 5 min. Examples are shown in Figure 5 and Figure 6.
- Verify that the automatic report agrees with the precise report. Remove the series that were not automatically eliminated in order to keep the consistent series.
Results
A reproducibility study was conducted considering 3 operators (one expert, two novices) and 14 healthy participants (6 women, 8 men, 21-53 years old). Novice operators were trained for approximately 3 h to understand and practice the acquisition protocol. Then, the participants were measured during 2 weeks in August 2023. Each measurement was performed independently. All operators were blinded, i.e., one operator did not know the results obtained by the two others.
Intra-operator repeatability
Figure 5 illustrates the intra-operator repeatability for a consistent case: 4 series of 10 acquisitions acquired on one participant and one operator. The first column corresponds to the inverse problem functions, while the second column shows the experimental guided mode dispersion compared with the best-fitting model. Each figure line corresponds to a successful series. The number of retained acquisitions is given in the title: 7 out of 10 for the first series and 10 out of 10 for the following ones. Means and standard deviations and the four parameters (vFAS, vA0, Ct.Th, and Ct.Po) are provided for each series. In addition, quality parameters are also shown: bi-directional angle (alpha), maximum of the inverse problem function (max), the absolute difference with the second maximum (diff), and the mean value of the lowest part of the GWSI (lowk).
Intra-series standard deviations are low, about 0.02 mm for the cortical thickness, less than 0.5% for cortical porosity, and less than 20 m∙s-1 for the two velocities, indicating that the reach probe positions were stable. Then, one can observe that the mean values obtained for each series are very close, particularly for the thickness values ranging between 3.4 mm and 3.5 mm and the vFAS values ranging from 4040 m∙s-1 to 4070 m∙s-1. Note that a difference of 40 m∙s-1 corresponds to a 1% difference for a mean value of 4000 m∙s-1. Larger variations are observed for cortical porosity, ranging from 8% to 12%, and the vA0 velocity, ranging from 1700 m∙s-1 to 1740 m∙s-1. In this consistent case, almost all acquisitions are consistent, i.e., close to each other. There is almost no ambiguity in the final result of the four parameters of interest.
A second case is illustrated in Figure 6 for a less regular case. In this case, three parameters, vFAS, vA0, and Ct.Po are very stable, with values respectively about 4120 m∙s-1, 1700 m∙s-1, and 10%. The case of the cortical thickness is more difficult as two ambiguous solutions, 2.6 mm, and 3.5 mm, are observed in agreement with a small difference value (diff less than 0.5%) between the two first maxima of the inverse problem function. In the previous regular case, this difference was ranging from 1% to 3 %. The ambiguity is removed by expert analysis, in this case, looking at the agreement between experimental and theoretical guided modes (right column). In the case of the lowest thickness, the agreement is better in the lowest part of the spectrum (two first series). For the two last series, there is a theoretical mode with very few experimental points, around 0.5 MHz, indicating a poorer agreement in comparison with the previous series. Moreover, the diff parameter (0.1%) is less than the values of the two first series (0.4% and 0.2%). In this case, the choice for the kept solution (2.6 mm) is not yet automated, and an expert is still needed. However, the three operators faced similar problems and chose similar solutions, close to 2.6 mm.
Extra-operator reliability
All the results for the 4 parameters of interest obtained by the 3 operators with the 14 participants are shown in Figure 7. The intraclass correlation coefficients (ICC) were computed following the formula and the Matlab code previously published37,38,39. ICC is commonly used for the assessment of the reliability of measurement scales, in particular for biomedical applications. ICC values ranging from 0.75 to 0.9 are usually associated with good reliability, while ICC values above 0.9 are considered excellent reliability. The lowest value for ICC (0.76) was obtained for the parameter vA0. The standard deviation was equal to 17 m∙s-1, which is about 7% of the measurement range of the order of 250 m∙s-1. Similar values were observed for Ct.Po with ICC equal to 0.80, and a standard deviation of 1.1%, about 10% of the range. Excellent reliability (ICC about 0.9) was obtained for the two other parameters, Ct.Th and Ct.Po, with a standard deviation inferior to 10% of the range.
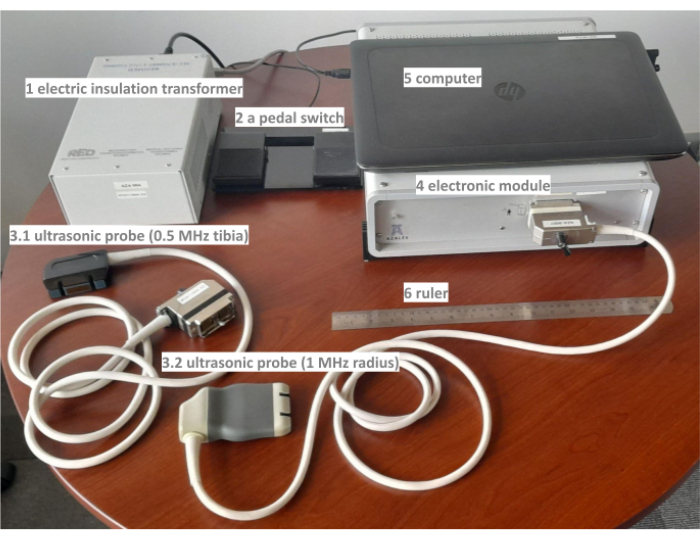
Figure 1: different parts of the Bi-Directional Axial Transmission (BDAT) ultrasonic device. The prototype includes electronic insulation (1), a pedal switch (2), two probes (3.1 and 3.2), an electronic module (4), a computer (5), and a ruler (6). Please click here to view a larger version of this figure.
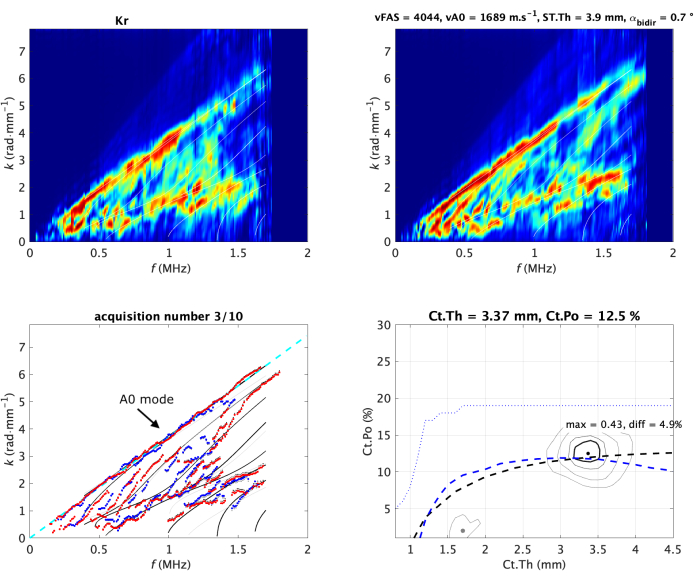
Figure 2: Typical acquisition on in vivo forearm. The two Norm functions (one per direction of propagation) are shown in the upper line of the image. They are also denoted guided wave spectrum image (GWSI). From the maxima of these images, it is possible to extract the experimental guided modes (blue and red dots) compared with the best-fitting model (bottom left sub-image). The best-fitting model is parametrized by two values, cortical thickness (Ct.Th) and porosity (Ct.Po), corresponding to the maximum position of the inverse problem function (bottom right sub-image). Their values are shown in the title of each panel. The vA0 fitting is shown as a dashed line (left). The Guided Wave Spectrum Images and the inverse problem image are normalized (i.e., the pixel value ranges from 0 to 1) by construction19,20. The values of the two measured velocities, vFAS and vA0, are indicated in the title of the top right sub-image. Please click here to view a larger version of this figure.
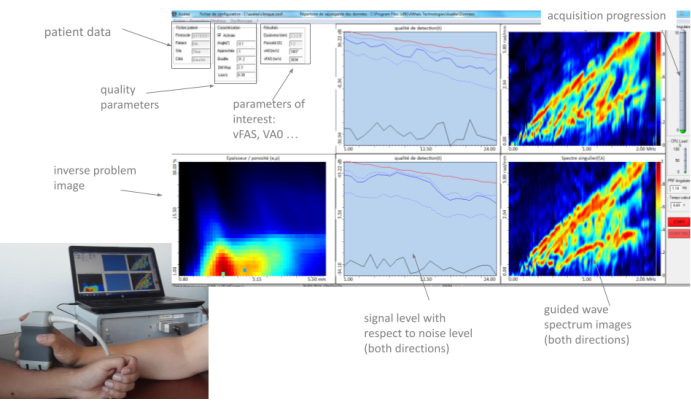
Figure 3: Human machine interface (HMI). The HMI shows in real the two GWSIs (one per propagation direction), the inverse problem image, the parameters of interest, and the quality parameters. Please click here to view a larger version of this figure.
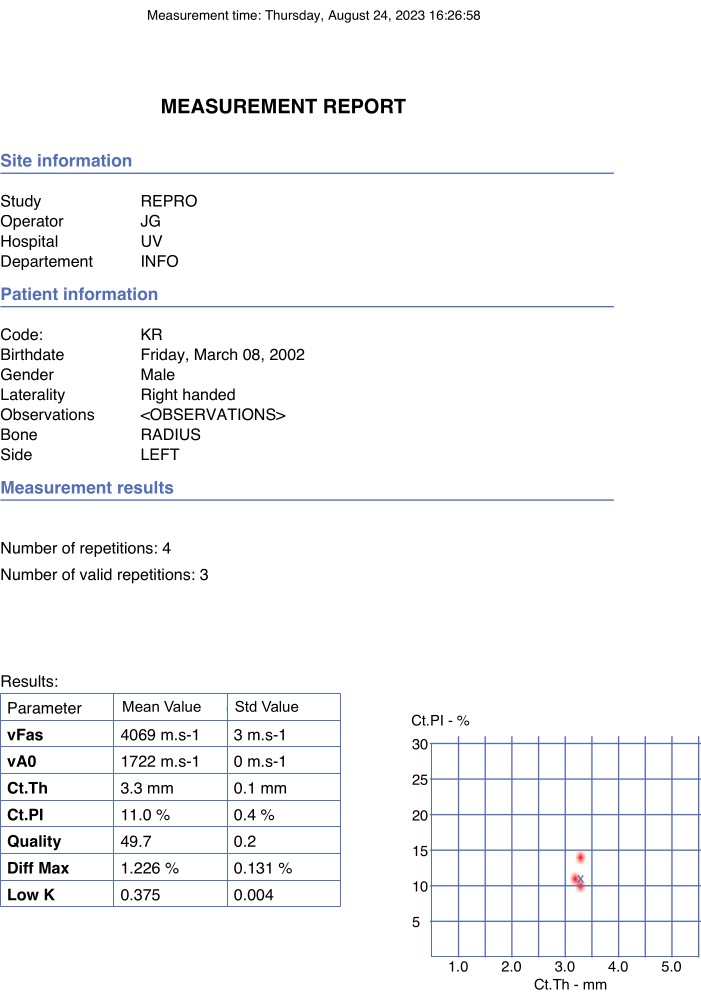
Figure 4: Example of automated report. The report indicated the participant's and operator's data as well as the final values of the parameters of interest and quality parameters. Please click here to view a larger version of this figure.
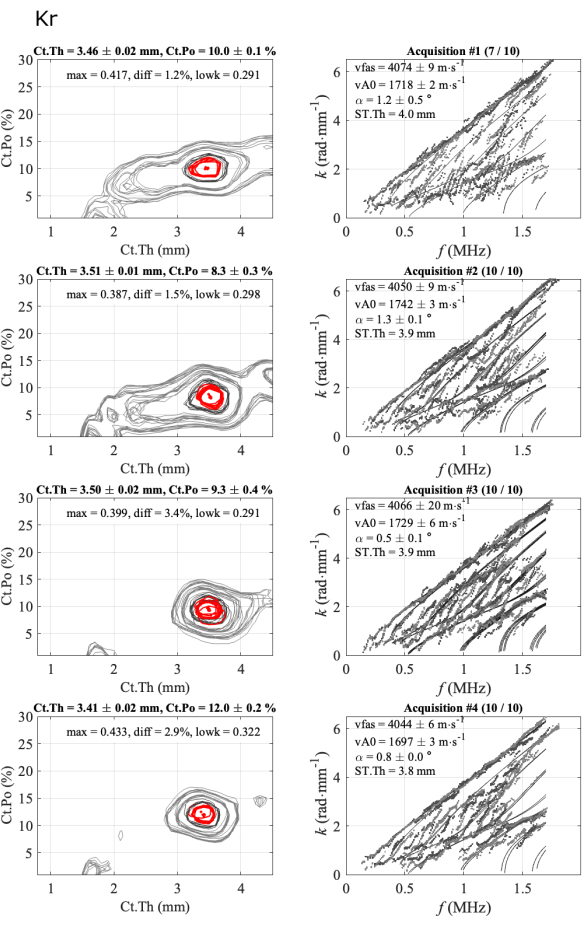
Figure 5: Example of the second report for a consistent case, same as the automated report shown in Figure 4. The figure shows 4 series of 1 participant and 1 operator: inverse problem images (left column) and experimental wavenumbers compared to the best fitting model (right column). The shown values correspond to the mean and standard deviation of the kept acquisitions over the 10-acquisition series. The number of kept acquisitions is indicated in the title of the right column, for example, (7/10) for the first series. Please click here to view a larger version of this figure.
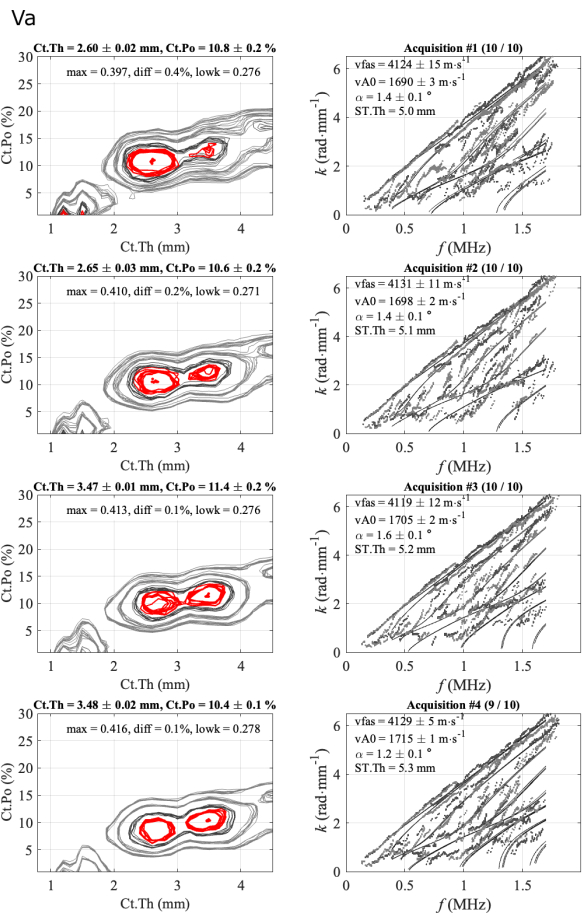
Figure 6: Example of the second report for an ambiguous case for cortical thickness. The figure shows 4 series of 1 participant and 1 operator: inverse problem images (left column) and experimental wavenumbers compared to the best fitting model (right column). The shown values correspond to the mean and standard deviation over the kept acquisitions over the 10-acquisition series. The number of kept acquisitions is indicated in the title of the right column, for example, (10/10) for the first series. Please click here to view a larger version of this figure.

Figure 7: Inter-operator reliability. Results are shown for the 4 parameters of interest obtained by the 3 operators with 14 participants. The values obtained by the 3 operators (y-axis) are compared with the mean value of the 3 operators (x-axis). The intraclass correlation coefficients (ICC) are indicated in the titles. The standard deviation σ and the coefficient of variation CV are also indicated. Please click here to view a larger version of this figure.
Discussion
The critical point for measurement success is the correct probe positioning with respect to the bone. The position with respect to the bone surface was successfully solved by integrating with the guiding interface the bi-directional correction16,17. It was shown that without this correction, a few percentage error can be reached for the vFAS parameters16. This correction was found crucial to accurately discriminate between patients as the whole measurement range (about 3800-4200 m∙s-1) is about 10% of the mean value17, about 4000 m∙s-1. The reproducibility found in this study (standard deviation of 24 m∙s-1) was similar to the previous study17, indicating a standard deviation of 20 m∙s-1 and a coefficient of variation (CV) of about 0.5%. A similar coefficient of variation (0.5 %) was found at a lower frequency, i.e., 0.3 MHz40. Note that the excellent reliability of the vFAS parameter (ICC = 0.91) was found to be higher than the one recently obtained with another AT device in an older population (ICC = 0.77)41. It should be noted that the population in this case was not only older but also all female and some subjects with other clinical signs of increased bone porosity41.
The second challenge is to also position the probe correctly with respect to the bone axis and the two interfaces in order to obtain the guided modes, in particular those of high phase velocity or low wavenumber. These modes are close to resonance and associated with multiple reflection paths. If the alignment is not correct, waves will be scattered outside the spatial measurement range of the probe. On the contrary, if the probe is correctly positioned, these high-phase velocity modes will appear as continuous branches in the ROI3. For the first version of the current HMI, this alignment was solved by looking at the real-time GWSI20. However, this approach was found insufficient to reach a robust measurement: the failure rate was found to be about 20% in the pilot clinical study20. The inclusion of real-time quality parameters allows the failure to decrease to about 10% in a second clinical study23. Then, the inclusion of the inverse problem image in the "real time" HMI allows further improvement, with a current failure rate for radius measurement of about 5%25. Note that the initial failure with the first device measuring only vFAS was found to be about 15%17.
Reliability on cortical thickness was found to be similar to a previous study22. With a previous version of the same prototype, ICC was also found to be close to 0.9, with a standard deviation of about 0.1 mm and a CV of about 3%. However, a clear improvement is observed in cortical porosity: ICC increased from 0.622 to 0.8, and standard deviation decreased from 1.5% to 1%. The most difficult parameter is vA0 due to the proximity of his velocity with the soft tissue velocity, about 1500 m∙s-1. If the probe is correctly aligned, A0 mode appears unique and continuous. On the contrary, it appears discontinuous and/or multiple due to coupling with surrounding soft tissues. This effect is particularly strong for people with small (less than 4 mm) or large (more than 10 mm) soft tissue thickness (denoted ST.Th).
As exposed before, the key point is to find the correct probe position. However, the position should be not only correct but also stable in order to perform mean and standard deviation for a series of 10 acquisitions. In a majority of cases, finding a stable takes less than 1 min, and the complete measurement of a patient would last about 5 min. Even if the standard protocol described in this study is well suited for a majority of patients, some people are more difficult to measure; it is difficult but possible to find correct positions, but almost impossible to find a stable one. In this case, the operator can choose to record longer series, up to 200 acquisitions. The best acquisitions are later determined offline using quality parameters. This filtering should be applied in real time in the future. In practice, the operator records more series and/or acquisitions than the 4 series of 10 acquisitions of the ideal condition protocol. However, the usual measurement time remains about 5 min for one site, forearm or leg. If, after a few minutes, the HMI does not detect any correct position, the measurement stops and is considered a failure. With the current device and protocol, the failure rate has been found to be less than 5%25.
The current device faces different limitations:
(i)Size and weight: The current BDAT device is portable: it fits in standard luggage and weighs about 25 kg. However, this weight is large with respect to the newest ultrasonic devices. A new electronic design may be considered, with the probe and signal processing remaining the same. However, it is possible to move the current device, particularly for patients in bed or at home with limited mobility.
(ii)Acquisition speed: The current frame rate is about 2-4 Hz, meaning that the exploration of the measurement is slow compared to actual real-time acquisition, i.e., higher than 25 Hz. This could be improved in the future, taking into account faster computers, faster data analysis, and transmission between the electronics and the computer. An increase in the acquisition speed would improve the user-friendliness of the measurement, particularly the search for correct probe positioning.
(iii)Soft tissue thickness: The current approach is limited by a large soft tissue layer, typically superior to 10 mm. In this case, the first arriving signal is linked with the soft tissue path and not the cortical bone. Thus, vFAS and the associated bi-directional angle can not be used. Likewise, vA0 is very difficult to measure for large soft tissue layers. Without these two velocities, the inverse problem cannot be performed. In the future, other methods of bi-directional correction could be applied using imaging techniques for example. Patients with large soft tissue layers are usually associated with obesity and Body Mass Index (BMI) larger than 30 kg.m-2.
(iv)Waveguide regularity: The inverse problem approach supposes a regular waveguide with multiple propagation paths. For osteoporotic patients, the internal cortical interface can be irregular and, therefore, implies poor guided wave spectrum images, particularly in the lower part. These patients are usually associated with high solution ambiguity. If the soft tissue or poor positioning can not be considered as the origin of poor spectrum image, and if the lowk parameter value is low, the waveguide is supposedly irregular, and the lowest thickness solution is considered. Approaches based on machine learning, which does not need physical modeling, can also be used29.
As discussed in the introduction, the current gold standard for the detection of patients at risk of fragility fracture is DXA, which faces some limitations: its large size, poor availability in some regions, relatively high cost, and relatively moderate effectiveness. The first limitations could be mitigated with ultrasonic devices, known for their attractive portability and costs. However, the ability to effectively detect patients at risk should be at least equivalent to DXA. In reality, it is sometimes expected to be higher than DXA to justify the adaptation of most of the references (medical decisions, treatment, costs, rooms, etc.) linked to the gold standard. That is why some ultrasonic devices propose aBMD surrogates10,11,42. However, one drawback of clinical parameters, such as aBMD and also vFAS, is the integration of different cortical bone properties. That is why complementary points of view are proposed by other ultrasonic devices, including BDAT, proposing parameters that can be more easily interpreted by the physician and the patient, such as cortical porosity, thickness, or pore-size distribution9. These parameters reflect geometrical and material properties: cortical bone can be potentially assessed in terms of independent variations of quantity or quality. This point of view could be very helpful in exploring different possible causes of bone fragility. For instance, intra- or extra-capsular hip fragility fractures, i.e., femoral neck or trochanter fracture sites, are supposed to have different medical origins43. Likewise, it could be possible to follow different medications aimed at different effects on cortical bone, as well as in terms of quantity or quality3.
Note that the precision obtained with BDAT for cortical thickness (0.1 mm) is better than other ultrasonic methods, usually above 0.25 mm44. This difference is partly due to the fact that the BDAT inverse problem takes into account combined geometrical and material variations. Some other approaches, such as in pulse echo consider unique bone material properties for all patients10,44. This precision value, about 0.1 mm (CV about 3%), is indeed crucial to finely discriminate between patients as the thickness range is less than 2 mm. The precision on cortical porosity (1%, CV about 14%) is not yet as good as for thickness. However, significant improvements have already been observed with respect to the previous reproducibility study22. One can expect that similar improvements could be achieved in the near future thanks to future HMI improvements, particularly in terms of frame rate closer to real-time.
The BDAT could be used on a large scale for population screening in regions where DXA is not widely available. Moreover, the latest clinical results showed the potential that the BDAT could be even more efficient than DXA. However, these results should be confirmed by including more patients. The next challenge should be multicentre and/or longitudinal studies11,12. However, the BDAT device is still a prototype disponible for scientific collaboration as it has already been done in Germany23 and UK24. Efforts are needed towards the industrialization of the next generation of BDAT devices, which would be surely faster and more portable.
Disclosures
The authors do not declare conflicts of interest.
Acknowledgements
This study was funded by the Chilean projects ANID / Fondecyt / Regular 1201311 and 1241091. The authors would like to thank the enterprise BleuSolid for its support during the latest HMI improvements, and Geropolis for the filming room.
Materials
| Name | Company | Catalog Number | Comments |
|---|---|---|---|
| Computer | Notebook HP | mod Zbook (16 Go RAM, Inrel Core i7) | to receive the sampled signals and applying the signal processing steps. Results are displayed in quasi real time (up to 4 per second) through a dedicated Human Machine Interface (HMI, BleuSolid, Pomponne, France) allowing the measurement guidance; |
| Electric insulation transformer | REOMED, Solingen, Germany | IEC / EN 60601-1 | to protect the device, the patient and other devices from any electric hazard |
| Electronic module | Althaïs, Tours, France | in-house | send excitation signals (half a period of negative voltage of 170 V) and discretize received signals (1024 time points per receiver at 20 MHz sampling frequency and 12 bit dynamic) before sending them to the computer. Delays and amplification can be adapted using linear laws in order to optimize data sampling within the accessible ranges. |
| Human Machine Interface | BleuSolid, Pomponne, France | N/A | HMI |
| Pedal switch | Scythe, Germany | USB Foot Switch 2 | to start an acquisition series |
| Ruler | Westcott, USA | 10417 | to locate the measurement site |
| Ultrasonic probe radius | Vermon, Tours, France | in-house | 1 MHz central frequency, 24 receivers with 0.8 mm pitch and two blocks of 5 transmitters with 1 mm pitch. |
| Ultrasonic probe tibia | Vermon, Tours, France | in-house | 0.5 MHz central frequency, 24 receivers with 1.2 mm pitch and two block of 5 transmitters with 1.5 mm pitch |
| Ultrasonic probes | designed according to the bidirectional geometry: a single receiver array surrounded by two transmitter arrays. The three arrays are aligned, mechanically and electrically isolated in order to minimize coupling signals. The probes are adapted to two different sites, one third distal radius and mid tibia. |
References
- Curtis, E. M., Moon, R. J., Harvey, N. C., Cooper, C. Reprint of: the impact of fragility fracture and approaches to osteoporosis risk assessment worldwide. Int J Orthop Trauma Nurs. 26, 7-17 (2017).
- Sing, C. W., et al. Global epidemiology of hip fractures: secular trends in incidence rate, post-fracture treatment, and all-cause mortality. J Bone Miner Res. 38 (8), 1064-1075 (2023).
- Choksi, P., Jepsen, K. J., Clines, G. A. The challenges of diagnosing osteoporosis and the limitations of currently available tools. Clin Diabetes Endocrinol. 4, 1-13 (2018).
- El Maghraoui, A., Roux, C. DXA scanning in clinical practice. QJM. 101 (8), 605-617 (2008).
- Maeda, S. S., et al. Challenges and opportunities for quality densitometry in Latin America. Arch Osteoporos. 16, 1-11 (2021).
- Surowiec, R. K., Does, M. D., Nyman, J. S. In vivo assessment of bone quality without x-rays. Curr Osteoporos Rep. 22 (1), 56-68 (2024).
- Whittier, D. E., et al. A fracture risk assessment tool for high resolution peripheral quantitative computed tomography. J Bone Miner Res. 38 (9), 1234-1244 (2023).
- Nyman, J. S., et al. Toward the use of MRI measurements of bound and pore water in fracture risk assessment. Bone. 176, 116863(2023).
- Armbrecht, G., Nguyen Minh, H., Massmann, J., Raum, K. Pore size distribution and frequency-dependent attenuation in human cortical tibia bone discriminate fragility fractures in postmenopausal women with low bone mineral density. J Bone Miner Res Plus. 5 (11), e10536(2021).
- Behrens, M., et al. The Bindex® ultrasound device: reliability of cortical bone thickness measures and their relationship to regional bone mineral density. Physiol Meas. 37 (9), 1528-1540 (2016).
- Cortet, B., et al. Radiofrequency echographic multi-spectrometry (REMS) for the diagnosis of osteoporosis in a European multicenter clinical context. Bone. 143, 115786(2021).
- Olszynski, W. P., et al. Multisite quantitative ultrasound for the prediction of fractures over 5 years of follow-up the Canadian Multicentre Osteoporosis Study. J Bone Miner Res. 28 (9), 2027-2034 (2013).
- Hans, D., Métrailler, A., Gonzalez Rodriguez, E., Lamy, O., Shevroja, E. Quantitative ultrasound (QUS) in the management of osteoporosis and assessment of fracture risk: an update. Adv Exp Med Biol. 1364, 7-34 (2022).
- Weiss, M., Ben-Shlomo, A., Hagag, P., Ish-Shalom, S. Discrimination of proximal hip fracture by quantitative ultrasound measurement at the radius. Osteoporos Int. 11 (5), 411-416 (2000).
- Moilanen, P., et al. Discrimination of fractures by low-frequency axial transmission ultrasound in postmenopausal females. Osteoporos Int. 24, 723-730 (2013).
- Bossy, E., Talmant, M., Defontaine, M., Patat, F., Laugier, P. Bidirectional axial transmission can improve accuracy and precision of ultrasonic velocity measurement in cortical bone: a validation on test materials. IEEE Trans Ultrason Ferroelectr Freq Control. 51 (1), 71-79 (2004).
- Talmant, M., et al. In vivo performance evaluation of bi-directional ultrasonic axial transmission for cortical bone assessment. Ultrasound Med Biol. 35 (6), 912-919 (2009).
- Mitra, M., Gopalakrishnan, S. Guided wave based structural health monitoring: A review. Smart Mater Struct. 25, 053001(2016).
- Minonzio, J. G., Talmant, M., Laugier, P. Guided wave phase velocity measurement using multi-emitter and multi-receiver arrays in the axial transmission configuration. J Acoust Soc Am. 127 (5), 2913-2919 (2010).
- Minonzio, J. G., et al. cortical thickness and porosity assessment using ultrasound guided waves: An ex vivo validation. Bone. 116, 111-119 (2018).
- Vallet, Q., Bochud, N., Chappard, C., Laugier, P., Minonzio, J. G. In vivo characterization of cortical bone using guided waves measured by axial transmission. IEEE Trans Ultrason Ferroelectr Freq Control. 63 (9), 1361-1371 (2016).
- Minonzio, J. G., et al. Ultrasound-based estimates of cortical bone thickness and porosity are associated with nontraumatic fractures in postmenopausal women: a pilot study. J Bone Miner Res. 34 (9), 1585-1596 (2019).
- Minonzio, J. G., et al. Bi-directional axial transmission measurements applied in a clinical environment. PLoS One. 17 (12), e0277831(2022).
- Behforootan, S., et al. Can guided wave ultrasound predict bone mechanical properties at the femoral neck in patients undergoing hip arthroplasty. J Mech Behav Biomed Mater. 136, 105468(2022).
- Rojo, F., et al. Classification of hip fragility fractures in older adults using an ultrasonic device. , IEEE International Ultrasonics Symposium (IUS). Montreal, QC, Canada. (2023).
- Ishimoto, T., et al. Quantitative ultrasound (QUS) axial transmission method reflects anisotropy in micro-arrangement of apatite crystallites in human long bones: A study with 3-MHz-frequency ultrasound. Bone. 127, 82-90 (2019).
- Minonzio, J. G., Foiret, J., Talmant, M., Laugier, P. Impact of attenuation on guided mode wavenumber measurement in axial transmission on bone mimicking plates. J Acoust Soc Am. 130 (6), 3574-3582 (2011).
- Moreau, L., Minonzio, J. G., Talmant, M., Laugier, P. Measuring the wavenumber of guided modes in waveguides with linearly varying thickness. J Acoust Soc Am. 135 (5), 2614-2624 (2014).
- Miranda, D., Olivares, R., Munoz, R., Minonzio, J. G. Improvement of patient classification using feature selection applied to bidirectional axial transmission. IEEE Trans Ultrason Ferroelectr Freq Control. 69 (9), 2663-2671 (2022).
- Foiret, J., Minonzio, J. G., Chappard, C., Talmant, M., Laugier, P. Combined estimation of thickness and velocities using ultrasound guided waves: A pioneering study on in vitro cortical bone samples. IEEE Trans Ultrason Ferroelectr Freq Control. 61 (9), 1478-1488 (2014).
- Granke, M., et al. Change in porosity is the major determinant of the variation of cortical bone elasticity at the millimeter scale in aged women. Bone. 49 (5), 1020-1026 (2011).
- Bochud, N., Vallet, Q., Minonzio, J. G., Laugier, P. Predicting bone strength with ultrasonic guided waves. Sci Rep. 7 (1), 43628(2017).
- Schneider, J., et al. Ex vivo cortical porosity and thickness predictions at the tibia using full-spectrum ultrasonic guided-wave analysis. Arch Osteoporos. 14, 1-11 (2019).
- Ramiandrisoa, D., Fernandez, S., Chappard, C., Cohen-Solal, M., Minonzio, J. G. In vivo estimation of cortical thickness and porosity by axial transmission: Comparison with high resolution computed tomography. , 2018 IEEE International Ultrasonics Symposium (IUS). Kobe, Japan. (2018).
- Schneider, J., et al. In vivo measurements of cortical thickness and porosity at the proximal third of the tibia using guided waves: Comparison with site-matched peripheral quantitative computed tomography and distal high-resolution peripheral quantitative computed tomography. Ultrasound Med Biol. 45 (5), 1234-1242 (2019).
- Araya, C., et al. Real time waveguide parameter estimation using sparse multimode disperse radon transform. IEEE UFFC Latin America Ultrasonics Symposium (LAUS. , Gainesville, FL, USA. (2021).
- Bobak, C. A., Barr, P. J., O'Malley, A. J. Estimation of an inter-rater intra-class correlation coefficient that overcomes common assumption violations in the assessment of health measurement scales. BMC Med Res Methodol. 18 (1), 93(2018).
- Shrout, P. E., Fleiss, J. L. Intraclass correlations: uses in assessing rater reliability. Psychol Bull. 86 (2), 420(1979).
- Zoeller, T. Intraclass correlation coefficient with confidence intervals. , At https://www.mathworks.com/matlabcentral/fileexchange/26885-intraclass-correlation-coefficient-with-confidence-intervals (2010).
- Kilappa, V., et al. Low-frequency axial ultrasound velocity correlates with bone mineral density and cortical thickness in the radius and tibia in pre- and postmenopausal women. Osteoporos Int. 22, 1103-1113 (2011).
- Watson, C. J., de Ruig, M. J., Saunders, K. T. Intrarater and interrater reliability of quantitative ultrasound speed of sound by trained raters at the distal radius in postmenopausal women. J Geriatr Phys Ther. 47 (4), E159-E166 (2024).
- Stein, E. M., et al. Clinical assessment of the 1/3 radius using a new desktop ultrasonic bone densitometer. Ultrasound Med Biol. 39 (3), 388-395 (2013).
- Dinamarca-Montecinos, J. L., Prados-Olleta, N., Rubio-Herrera, R., Del Pino, A. C. S., Carrasco-Buvinic, A. Intra-and extracapsular hip fractures in the elderly: Two different pathologies. Rev Esp Cir Ortop Traumatol. 59 (4), 227-237 (2015).
- Karjalainen, J., Riekkinen, O., Toyras, J., Kroger, H., Jurvelin, J. Ultrasonic assessment of cortical bone thickness in vitro and in vivo. IEEE Trans Ultrason Ferroelectr Freq Control. 55 (10), 2191-2197 (2008).
Reprints and Permissions
