This protocol outlines a method for inducing diabetic cardiomyopathy through a combination of high-fat diet feeding and streptozotocin injection. This approach aims to provide a reliable framework for scientific investigation into diabetic cardiomyopathy and to explore potential avenues for clinical treatment applications.
A subscription to JoVE is required to view this content. Sign in or start your free trial.
Method Article
Modeling and Evaluation of Murine Diabetic Cardiomyopathy Model
* These authors contributed equally
In This Article
Summary
Abstract
The underlying pathophysiological mechanisms of diabetic cardiomyopathy (DbCM), a leading cause of mortality among patients with type 2 diabetes mellitus (T2DM), remain poorly understood. The myocardial toxicity associated with T2DM is attributed to factors such as lipotoxicity, glucotoxicity, oxidative stress, reduced cardiac efficiency, and lipoapoptosis. Compared to rats, mice offer greater accessibility, cost-effectiveness, and broader applicability for animal experiments. Insulin resistance and impaired insulin secretion are crucial factors in the pathophysiology of T2DM. We introduce a novel nongenetic murine model that replicates the progression of human DbCM induced by a combination of high-fat diet (HFD) feeding and streptozotocin (STZ) injection. In this study, we used wild-type C57BL/6J mice, administering an HFD regimen for 12 weeks, followed by intraperitoneal injections of STZ for an additional 12 weeks to induce characteristic manifestations of T2DM. We conducted oral glucose tolerance tests and measured serum insulin concentrations to confirm the development of insulin resistance and insufficient insulin secretion. Cardiac structure and function were rigorously assessed through noninvasive transthoracic echocardiography. Pathological characteristics were evaluated through Masson's trichrome staining and wheat germ agglutinin (WGA) staining, revealing pathological features related to DbCM. Therefore, we provide a robust and versatile method for establishing a nongenetic murine model of DbCM.
Introduction
Type 2 diabetes mellitus (T2DM) is a progressively escalating global health concern, standing as a leading cause of morbidity and mortality among affected individuals. The prevalence of T2DM is closely related to the rising epidemic of obesity1,2. More than one-third of patients with T2DM exhibit a distinct cardiovascular phenotype termed diabetic cardiomyopathy (DbCM), characterized by myocardial dysfunction that occurs independently of coronary artery disease, hypertension, and valvular heart disease3. Emerging evidence suggests that approximately 20% of diabetic patients are predisposed to developing heart failure3, a condition closely associated with their prognosis4. Several pathophysiological mechanisms of DbCM have been proposed, including inflammation5, cardiac remodeling and dysfunction6, mitochondrial dysfunction7, oxidative stress8, and metabolic disturbances9. Despite extensive research, the complete spectrum of mechanisms and their individual contributions to DbCM remain incompletely understood10. Therefore, well-established preclinical animal models are essential for advancing the study of this condition.
T2DM is characterized by insulin resistance and progressive insulin insufficiency11, with most being overweight or obese12. In this study, we establish a stable and modified murine model of DbCM based on previous studies, combining high-fat diet (HFD) feeding and streptozotocin (STZ) injection. In T2DM, insulin resistance and pancreatic β-cell destruction contribute to the disease's pathophysiology12. This model leverages two prominent risk factors of T2DM. Specifically, mice fed with HFD develop insulin resistance, and subsequent STZ injections further impair pancreatic islet β-cell function, significantly leading to the progression of T2DM-like pathophysiology. STZ, isolated from Streptomyces achromogenes, was first described in 1963 for its selective destruction of pancreatic islet β-cells and its diabetogenic properties13. There are two STZ treatment models: administering a relatively high dose of STZ results in a short-term cardiomyopathy model, while repeated low-dose STZ injections induce a T2DM model that naturally progresses to DbCM. As a result of the latter method, animals develop hyperglycemia, polydipsia, and polyuria, all of which are characteristics of human T2DM and develop DbCM naturally.
This study found that wild-type C57BL/6J mice fed with HFD followed by intraperitoneal STZ injections (30 mg/kg) exhibited cardiac function, morphology, and histology consistent with the characteristics of DbCM by the end of the experiment. This approach provides an effective method for establishing a murine DbCM model.
Access restricted. Please log in or start a trial to view this content.
Protocol
All procedures followed institutional guidelines for animal research in accordance with the Guide for the Care and Use of Laboratory Animals outlined by the US National Institutes of Health (NIH Publication No. 85-23, revised in 1996). All animal experiments were approved by the Ethics Committee of Animal Care and the Ethics Committee of Sichuan University. Male C57BL/6J mice were purchased from Beijing Vital River Laboratory Animal Technology Co. (China). Throughout the experimental duration, mice were housed under controlled conditions of 24 °C and a regulated 12 h light/dark cycle, with ad libitum access to food and water.
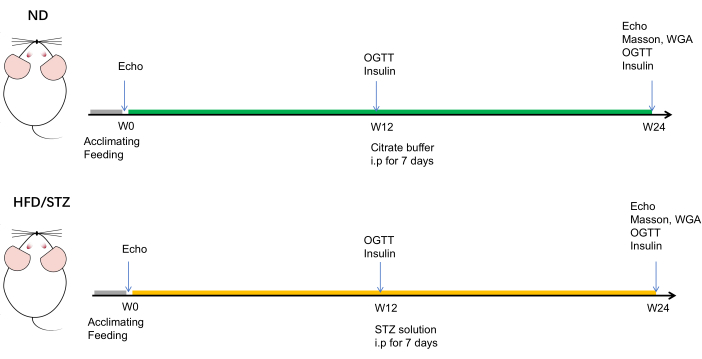
Figure 1: Schematic experiment timeline. The mice used in HFD/STZ and ND groups were both at approximately 7-8 weeks of age. The body weight and random blood glucose level of each mouse were recorded on a weekly basis. At the 12-week and 24-week feeding intervals, the metabolic phenotype of mice was evaluated by an oral glucose tolerance test (OGTT) and serum insulin level measurement. Additionally, echocardiography was assessed at baseline (week 0), 12 weeks, and 24 weeks. Following the 24-week feeding period, the mice were euthanized. Please click here to view a larger version of this figure.
1. HFD feeding
- Feed male C57BL/6J mice (7-8 weeks old) either with a normal diet (ND) or HFD (60% kcal fat) for 24 weeks to induce obesity.
- Record the body weight of each mouse every 4 weeks. Ensure the weight curve exhibits a similar upward pattern before 12 weeks, with a steeper slope observed in the HFD group.
2. STZ solution preparation and injection
NOTE: Store STZ at -20 °C to prevent degradation due to its high instability at room temperature (RT). Blend STZ with citrate buffer immediately within 5 min before injection.
- Prepare citrate buffer. Weigh 2.1 g of citric acid (relative molecular mass: 210.14) and dissolve it thoroughly in 100 mL of distilled water to prepare solution A; weigh 2.94 g of sodium citrate (relative molecular mass: 294.10) and dissolve it thoroughly in 100 mL of distilled water to prepare solution B. Mix solution A and B in a 1: 1.32 ratio to obtain the citric acid working solution. Filter out impurities using a 0.45 µm filter membrane.
- Weigh 1 g of STZ and dissolve it thoroughly in 100 mL of the prepared mixed citric acid working solution. Store the resulting STZ solution at 4 °C. Ensure the injection of the STZ solution occurs within 30 min whenever feasible.
- Using a 1 mL syringe, administer intraperitoneal injections of a solution containing 30 mg/kg of STZ daily for 7 consecutive days to mice in the HFD/STZ group while providing an equal volume of citrate buffer (0.1 mmol/L, pH = 4.5) to mice in the ND group.
- Assay blood glucose levels 1 week after the final injection. Classify mice exhibiting random blood glucose concentrations exceeding 16.7 mmol/L as T2DM mice.
- Carefully position the mouse onto a restraining device, ensuring its tail extends fully outside.
- Prior to blood collection, sanitize the tail's blood collection site thoroughly with a 70% alcohol swab, maintaining sterility and cleanliness.
- With a sharp-tipped needle, insert it into the tail vein, advancing from the tip towards the base at a depth of 3-4 mm. Once the needle is securely in place, gently squeeze the top of the tail to encourage blood flow.
- Collect approximately 10 µL of blood from a mouse and carefully apply the collected blood onto the dedicated test strip. Once the blood is absorbed, the glucose meter will promptly display the blood glucose reading.
3. Oral glucose tolerance test (OGTT)14
- Before OGTT, fast each mouse overnight for 14 h, while it has unrestricted access to water.
- Prepare approximately 10 mL of a 20% glucose solution. Administer a dose of 1 g/kg glucose via oral gavage to each mouse during the OGTT.
- Monitor blood glucose levels at several time points: immediately (0 min), 15 min, 30 min, 60 min, and 120 min post-administration.
4. Echocardiography assessment of cardiac function
- Conduct echocardiography on each mouse at baseline (0 weeks), 12 weeks, and 24 weeks after feeding with either HFD or ND.
- Prior to echocardiography, anesthetize the mouse via inhalation of 3% isoflurane which is administered with 100% oxygen using an anesthetic machine. Ensure the mouse shows no reaction to skin pinching using a toothed tweezer or stimulation of its toes and tail. Apply veterinary ointment to the eyes to prevent dryness during anesthesia.
- Position the mouse on a heating pad to maintain body temperature, and secure its claws to an electrode to ensure a stable supine position. Adjust the isoflurane concentration between 1%-2% for maintenance anesthesia to maintain a target heart rate of approximately 450 beats per minute.
- Remove the mouse's fur using depilatory cream and apply ultrasonic gel to its chest. Remove the depilatory cream and ultrasonic gel with sterile saline following echocardiography.
- Evaluate the cardiac function and structural parameters with a 50 MHz probe.
- To obtain an optimal left ventricle (LV) long-axis view, position the probe on the left side of the animal's chest.
- Depending on the individual anatomy, rotate the probe counterclockwise between 15° and 45° relative to the left parasternal line, with the notch directed toward its right shoulder. Adjust the x-axis and y-axis under the B-mode15.
NOTE: An appropriate LV long-axis view should include (i) the aortic valve and aortic root; (ii) the LV chamber is positioned in the center of the view; (iii) the base-to-apex axis should be parallel to the transducer16. - Press M-mode 2x to display the measuring line. Position this line at the level of the papillary muscle. Subsequently, take measurements for at least three consecutive heartbeats to ensure accuracy. Tap Save Clip to save the cine loop in the series.
- Identify the end-systolic dimension as the phase that coincided with the ECG T wave, and determine the end-diastolic dimension as the phase corresponding to the ECG R wave.
- Tilt the operating pad, ensuring the upper left corner is lowest, and the lower right corner is highest. Adjust the probe to penetrate along the direction of the mouse's cardiac apex, parallel to the long axis of the heart, to get a transapical four-chamber view.
- Successively select C (Color Doppler) and PW (PW Doppler) modes, place the sample volume at the highest velocity point, adjust the sampling direction to match the direction of blood flow, and record mitral valve hemodynamic information (E and A wave)16. Tap Save Clip to save the cine loop in the series.
- Halt isoflurane inhalation to allow the mice to regain consciousness. Return the animals to their cages, housed in a controlled environment with a 12-h light/dark cycle at both the 0 and 12 week marks. Following the 24-week echocardiographic assessment, humanely euthanize the mice through cervical dislocation following isoflurane inhalation.
- Perform the analysis of the ejection fraction (EF), fraction shortening (FS), left ventricular posterior wall (LVPW), left ventricular internal diameter (LVID), interventricular septum (IVS), and E/A ratio using the workstation dongle.
5. Histological staining
- After completing the echocardiographic analysis at the 24-week mark, euthanize the mouse by spinal cord dislocation following isoflurane inhalation.
- Dissect the mouse using ophthalmic scissors and tweezers. Sever the ribs carefully to ensure complete exposure of the heart.
- Perfuse the heart through the apex with saline until the liver becomes pallor, indicating successful perfusion. Remove the heart and rinse it thoroughly in saline to ensure complete blood removal.
- Perform paraffin embedding17.
- Fix the heart with 4% formalin at RT for at least 24 h.
- Place the dehydration box containing the heart in a dehydrator to undergo a gradual dehydration process involving gradient alcohol and wax leaching at 65 °C.
- Prepare tissue sections17.
- Place the trimmed wax block containing papillary muscle into a microtome for slicing, with a thickness of 4 µm, and store at RT for pathological staining.
- Perform stain using Masson's trichrome18 and wheat germ agglutinin (WGA)19 staining.
Access restricted. Please log in or start a trial to view this content.
Results
This study involved random allocation of mice into two groups: the ND group and the HFD/STZ group, with 6 mice in each group. Subsequent to the final echocardiography and OGTT tests 24 weeks after feeding, the mice were euthanatized to harvest their heart tissues for a histological assessment.
HFD/STZ caused an obvious body weight gain, reaching its peak in 12 weeks, and was significantly higher compared with the ND group. Following the administration of STZ, a notable decrease in body weight ...
Access restricted. Please log in or start a trial to view this content.
Discussion
Given the widespread prevalence of diabetes mellitus and its associated cardiovascular complications globally, there is an urgent need to uncover the underlying molecular mechanisms and develop preventative and therapeutic strategies for this condition20. The pathogenesis of DbCM, one of the cardiovascular complications for patients with T2DM, remains unclear, with no effective approaches to prevent and treat21. The absence of reliable preclinical models that accurately mim...
Access restricted. Please log in or start a trial to view this content.
Disclosures
The authors have nothing to disclose.
Acknowledgements
This work was supported by the National Natural Science Foundation of China (grant numbers: U23A20395, 81900258, and 82170375); the Key Research and Development Project of Science & Technology Department of Sichuan Province (2022ZDZX0020); Chinese Medical Association Cardiovascular Branch (CSC) Clinical Research Special Fund Project (CSCF2020B04); 1· 3· 5 project of West China Hospital, Sichuan University (ZYGD23021). Thanks to Qing Yang (Animal Imaging Core Facilities, West China Hospital, Sichuan University) for their help in small animal ultrasonography.
Access restricted. Please log in or start a trial to view this content.
Materials
| Name | Company | Catalog Number | Comments |
|---|---|---|---|
| Animal ultrosound system | Fujifilm Visual Sonics | VEVO 3100 | Echocardiography |
| Blood glucometer | Yuwell | GU100 | Assess blood glucose level |
| Citric acid | Sigma-Aldrich | 251275 | |
| Isoflurane | RWD life science | R510-22 | Anesthesia |
| Isoflurane vaporizer | RWD life science | R500 | Anesthesia |
| Mouse insulin (INS) ELISA Kit | Wuhan Feiyue Biotechnology Co.,Ltd | FY-EM14029 | Assess serum insulin level |
| Nair hair removal cream | Nair | 255g | Remove the fur of mouse |
| Rodent diet with 60% kcal fat | Research Diets Inc | D12492 | High fat diet feeding |
| Sodium citrate | Sigma-Aldrich | S4641 | |
| Sterile filter | Merck Millipore | SLHV033N | |
| Streptozocin | Solarbio | S8050 | |
| Ultrasound gel | Keppler | KL-250 | Echocardiography |
| Workstation Dongle | Fujifilm Visual Sonics | Vevo LAB | Echocardiographic data analysis |
References
- Defronzo, R. A., et al. Type 2 diabetes mellitus. Nat Rev Dis Primers. 1, 15019(2015).
- Htay, T., et al. Mortality and cardiovascular disease in type 1 and type 2 diabetes. Curr Cardiol Rep. 21 (6), (2019).
- Jia, G., Hill, M. A., Sowers, J. R. Diabetic cardiomyopathy: An update of mechanisms contributing to this clinical entity. Circ Res. 122 (4), 624-638 (2018).
- Kenny, H. C., Abel, E. D. Heart failure in type 2 diabetes mellitus. Circ Res. 124 (1), 121-141 (2019).
- Biernacka, A., et al. Smad3 signaling promotes fibrosis while preserving cardiac and aortic geometry in obese diabetic mice. Circ Heart Fail. 8 (4), 788-798 (2015).
- Van Linthout, S., et al. Reduced MMP-2 activity contributes to cardiac fibrosis in experimental diabetic cardiomyopathy. Basic Res Cardiol. 103 (4), 319-327 (2008).
- Ni, R., et al. Therapeutic inhibition of mitochondrial reactive oxygen species with mito-tempo reduces diabetic cardiomyopathy. Free Radic Biol Med. 90, 12-23 (2016).
- Tan, Y., et al. Diabetic downregulation of Nrf2 activity via erk contributes to oxidative stress-induced insulin resistance in cardiac cells in vitro and in vivo. Diabetes. 60 (2), 625-633 (2011).
- Maack, C., et al. Heart failure and diabetes: Metabolic alterations and therapeutic interventions: A state-of-the-art review from the translational research committee of the heart failure association-european society of cardiology. Eur Heart J. 39 (48), 4243-4254 (2018).
- Ho, K. L., et al. structural and biochemical changes in diabetes and the development of heart failure. Diabetologia. 65 (3), 411-423 (2022).
- Saisho, Y. Beta-cell dysfunction: Its critical role in prevention and management of type 2 diabetes. World J Diabetes. 6 (1), 109-124 (2015).
- Galicia-Garcia, U., et al. Pathophysiology of type 2 diabetes mellitus. Int J Mol Sci. 21 (17), 6275(2020).
- Junod, A., et al. Studies of the diabetogenic action of streptozotocin. Proc Soc Exp Biol Med. 126 (1), 201-205 (1967).
- Einwallner, E., Nagy, C. Study of in vivo glucose metabolism in high-fat diet-fed mice using oral glucose tolerance test (OGTT) and insulin tolerance test (ITT). J Vis Exp. (131), e56672(2018).
- Wang, Q., et al. Induction of right ventricular failure by pulmonary artery constriction and evaluation of right ventricular function in mice. J Vis Exp. (147), e59431(2019).
- Zacchigna, S., et al. Towards standardization of echocardiography for the evaluation of left ventricular function in adult rodents: A position paper of the ESC working group on myocardial function. Cardiovasc Res. 117 (1), 43-59 (2021).
- Paraffin sides experiment report. , Servicebio. At https://www.servicebio.com/data-detail?id=5556&code=BLZPSYBG (2022).
- staining experiment report. , Servicebio. At https://www.servicebio.com/data-detail?id=5588&code=RSSYBG (2022).
- Paraffin WGA staining protocol. , Servicebio. At https://www.servicebio.com/data-detail?id=5041&code=MYYGSYBG (2022).
- Guariguata, L., et al. Global estimates of diabetes prevalence for 2013 and projections for 2035. Diabetes Res Clin Pract. 103 (2), 137-149 (2014).
- Tan, Y., et al. Mechanisms of diabetic cardiomyopathy and potential therapeutic strategies: Preclinical and clinical evidence. Nat Rev Cardiol. 17 (9), 585-607 (2020).
- Prasad, M., et al. A comprehensive review on high -fat diet-induced diabetes mellitus: An epigenetic view. J Nutr Biochem. 107, 109037(2022).
- Zhang, Y., et al. Positional cloning of the mouse obese gene and its human homologue. Nature. 372 (6505), 425-432 (1994).
- Adingupu, D. D., et al. Sglt2 inhibition with empagliflozin improves coronary microvascular function and cardiac contractility in prediabetic ob/ob(-/-) mice. Cardiovasc Diabetol. 18 (1), 16(2019).
- Huynh, K., et al. Coenzyme q10 attenuates diastolic dysfunction, cardiomyocyte hypertrophy and cardiac fibrosis in the db/db mouse model of type 2 diabetes. Diabetologia. 55 (5), 1544-1553 (2012).
- Moellmann, J., et al. Empagliflozin improves left ventricular diastolic function of db/db mice. Biochim Biophys Acta Mol Basis Dis. 1866 (8), 165807(2020).
- Ramirez, E., et al. Eplerenone attenuated cardiac steatosis, apoptosis and diastolic dysfunction in experimental type-ii diabetes. Cardiovasc Diabetol. 12, 172(2013).
- Fuentes-Antras, J., et al. Updating experimental models of diabetic cardiomyopathy. J Diabetes Res. 2015, 656795(2015).
- Riehle, C., Bauersachs, J. Of mice and men: Models and mechanisms of diabetic cardiomyopathy. Basic Res Cardiol. 114 (1), 2(2018).
- Zhao, S., Kusminski, C. M., Scherer, P. E. Adiponectin, leptin and cardiovascular disorders. Circ Res. 128 (1), 136-149 (2021).
- Parilla, J. H., Willard, J. R., Barrow, B. M., Zraika, S. A mouse model of beta-cell dysfunction as seen in human type 2 diabetes. J Diabetes Res. 2018, 6106051(2018).
- Wang, B., Chandrasekera, P. C., Pippin, J. J. Leptin- and leptin receptor-deficient rodent models: Relevance for human type 2 diabetes. Curr Diabetes Rev. 10 (2), 131-145 (2014).
- Vasanji, Z., Cantor, E. J., Juric, D., Moyen, M., Netticadan, T. Alterations in cardiac contractile performance and sarcoplasmic reticulum function in sucrose-fed rats is associated with insulin resistance. Am J Physiol Cell Physiol. 291 (4), C772-C780 (2006).
- Wright, J. J., et al. Mechanisms for increased myocardial fatty acid utilization following short-term high-fat feeding. Cardiovasc Res. 82 (2), 351-360 (2009).
- Flister, K. F. T., et al. Long-term exposure to high-sucrose diet down-regulates hepatic endoplasmic reticulum-stress adaptive pathways and potentiates de novo lipogenesis in weaned male mice. J Nutr Biochem. 62, 155-166 (2018).
- Kanwal, A., Pillai, V. B., Samant, S., Gupta, M., Gupta, M. P. The nuclear and mitochondrial sirtuins, sirt6 and sirt3, regulate each other's activity and protect the heart from developing obesity-mediated diabetic cardiomyopathy. FASEB J. 33 (10), 10872-10888 (2019).
- Winzell, M. S., Ahren, B. The high-fat diet-fed mouse: A model for studying mechanisms and treatment of impaired glucose tolerance and type 2 diabetes. Diabetes. 53 Suppl 3, S215-S219 (2004).
- Poucher, S. M., et al. Effects of saxagliptin and sitagliptin on glycaemic control and pancreatic beta-cell mass in a streptozotocin-induced mouse model of type 2 diabetes. Diabetes Obes Metab. 14 (10), 918-926 (2012).
- Islam, M. S., Loots Du, T. Experimental rodent models of type 2 diabetes: A review. Methods Find Exp Clin Pharmacol. 31 (4), 249-261 (2009).
- Heydemann, A. An overview of murine high fat diet as a model for type 2 diabetes mellitus. J Diabetes Res. 2016, 2902351(2016).
- Surwit, R. S., Kuhn, C. M., Cochrane, C., Mccubbin, J. A., Feinglos, M. N. Diet-induced type ii diabetes in c57bl/6j mice. Diabetes. 37 (9), 1163-1167 (1988).
- Clee, S. M., Attie, A. D. The genetic landscape of type 2 diabetes in mice. Endocr Rev. 28 (1), 48-83 (2007).
- Lee, J. Y., Kim, M. J., Moon, C. K., Chung, J. H. Degradation products of streptozotocin do not induce hyperglycemia in rats. Biochem Pharmacol. 46 (11), 2111-2113 (1993).
- Ozturk, N., Uslu, S., Ozdemir, S. Diabetes-induced changes in cardiac voltage-gated ion channels. World J Diabetes. 12 (1), 1-18 (2021).
- Bohne, L. J., Johnson, D., Rose, R. A., Wilton, S. B., Gillis, A. M. The association between diabetes mellitus and atrial fibrillation: Clinical and mechanistic insights. Front Physiol. 10, 135(2019).
Access restricted. Please log in or start a trial to view this content.
Reprints and Permissions
