In this article, we detail methods to characterize an enzyme's ability to retain function when incubated at 37 °C in human serum, a pharmacological property referred to as its serum stability. This ability may be a key factor in predicting an enzyme's pharmacokinetic profile and its suitability for therapeutic use.
Method Article
Determining the Serum Stability of Human Adenosine Deaminase 1 Enzyme
In This Article
Summary
Abstract
The concept of enzyme stability is typically used to refer to an enzyme's thermostability - its ability to retain structure and activity as temperature increases. For a therapeutic enzyme, other measures of stability may also be critical, particularly its ability to retain function in human serum at 37 °C, which we refer to as serum stability. Here, we describe an in vitro assay to assess the serum stability of the wildtype Homo sapiens adenosine deaminase I (HsADA1) enzyme using an absorbance-based microplate procedure. Specifically, this manuscript describes the preparation of buffers and reagents, a method arranging for the coincubation of HsADA1 in serum, a method to analyze the test samples using a microplate reader, and an accompanying analysis to determine the fraction of activity that an HsADA1 enzyme retains in serum as a function of time. We further discuss considerations to adapt this protocol to other enzymes, using an example of a Homo sapiens kynureninase enzyme, to help aid the protocol's adaptation to other enzymes where serum stability is of interest.
Introduction
The following method allows a user to quantitatively assess an enzyme's ability to retain its activity when exposed to conditions that mimic what it will encounter following intravenous injection. The in vitro method mimics such in vivo conditions and consists of the incubation of the enzyme in pooled human serum at 37 °C and time-coursed analyses of retention of enzyme activity. We refer to an enzyme's ability to retain activity in these conditions as its serum stability, and the analysis method for enzyme activity takes advantage of differences in absorbance between an enzyme's substrate and the resulting product. The concept of serum stability is not just enzyme-specific and has been applied to several other treatment modalities as well. For example, the serum stability of RNA aptamers targeting COVID spike proteins has previously been assessed by monitoring their degradation post-incubation with fetal calf serum1. Antibacterial peptides have also been assessed for their ability to suppress bacterial growth post-incubation with pooled human serum2.
HsADA1 is an enzyme that catalyzes the conversion of adenosine or 2-deoxyadenosine into inosine or 2-deoxyinosine, respectively3. Adenosine has an absorption peak of 260 nm, while inosine absorbs strongest at 250 nm4. This shift in absorption peaks can be detected on a microplate reader by a decrease in absorption intensity at 260 nm when HsADA1 is added to adenosine. The HsADA1 enzyme has important implications in the human body, and its deficiency causes a severe combined immunodeficiency (ADA-SCID)5. The bovine homolog of HsADA1, BtADA1, can be utilized as an enzyme replacement therapeutic for the treatment of ADA-SCID, and we have previously shown that wildtype HsADA1 loses its activity when incubated with pooled human serum, potentially hindering its use as a therapeutic6. Therefore, we selected the wildtype HsADA1 enzyme to demonstrate a procedure to determine an enzyme's serum stability. A detailed purification method for HsADA1 has been described previously6.
In the following protocol (as detailed in Figure 1), we demonstrate how to co-incubate wildtype HsADA1 in pooled human serum at 37 °C. During this time, test samples are taken at defined time points and flash-frozen for future analysis. Once all samples have been taken, a microplate assay is run whereby each sample is combined with the substrate, with the resulting absorbance decrease being a correlation for the retained activity of the enzyme. Representative results illustrating the serum stability of HsADA1 are shown, and because this metric may be relevant to determining the potential therapeutic value of other enzymes, we also discuss considerations to adapt this protocol to an engineered Homo sapiens kynureninase enzyme (HsKYNase) and any enzymes more generally. HsKYNase is an enzyme involved in the metabolism of tryptophan and is able to degrade the tryptophan-byproducts kynurenine and hydroxy-kynurenine (OH-Kyn) into anthranilic acid and hydroxy-anthranilic acid (OH-AA), respectively. Enzyme-mediated modulation of tryptophan metabolism may be of therapeutic relevance7.
Protocol
1. Serum incubation
- Prepare a 10x stock of HsADA1 in 1x PBS pH 7.4 (1x PBS) at a final concentration of 10 µM. Thaw a 15 mL aliquot of pooled human serum and pre-warm it to 37 °C. Prewarm a 50 mL aliquot of 1x PBS to 37 °C.
- Prepare the enzyme-serum incubation mixtures by adding 100 µL of the 10x HsADA1 stock to 900 µL of pooled human serum in a low-bind microcentrifuge tube, referred to as the enzyme + serum mixture. In a separate low-bind microcentrifuge tube, add 100 µL of the 10x HsADA1 stock to 900 µL of 1x PBS for comparison to a non-serum control, referred to as the enzyme + 1x PBS mixture. The final concentration of HsADA1 in each mixture will be 1 µM.
- Prepare an additional control in a low-bind microcentrifuge tube consisting of 100 µL of 1x PBS mixed with 900 µL of pooled human serum. This will serve as the non-enzyme control for the enzyme + serum mixture. Additionally, make a control consisting of 1 mL of 1x PBS. This will serve as the non-enzyme control for the enzyme + 1x PBS mixture.
- Aliquot 100 µL of each mixture from step 1.2 into separate low-bind tubes and dilute 1:1 with 100 µL of 30% (v/v) glycerol in 1x PBS. Flash freeze with liquid nitrogen and store at -80 °C. These samples will be the Day 0 timepoint, and the concentration of HsADA1 in them will be 500 nM. Repeat this step for the non-enzyme control mixtures from 1.3. Seal all enzymes and control mixtures with transparent film and place them into a 37 °C incubator.
- After 24 h, aliquot 100 µL of each incubated sample and dilute 1:1 with 100 µL of 30% (v/v) glycerol in 1x PBS. Flash freeze with liquid nitrogen and store at -80 °C. These samples will be the Day 1 timepoint. Return all enzyme and control mixtures to the 37 °C incubator. Repeat this step at 72 h and 120 h.
NOTE: Aliquoted samples do not necessarily need to be flash-frozen. Alternatively, the user may perform the microplate-based assay immediately after taking each sample, although fresh standard curves and adenosine substrate stocks should be prepared each time a sample is tested.
2. Microplate-based assay
- Prepare the microplate reader by setting up a kinetic read protocol (Figure 2) to measure the absorbance at 260 nm with the shortest reading interval for 30 min and preheat the reader to a setpoint of 37 °C.
- Thaw all collected samples on ice. Dilute each thawed sample 1:10 using 1x PBS prewarmed to 37 °C as a diluent in low-bind microcentrifuge tubes. The new HsADA1 concentration in these samples will be 50 nM.
- Make a 10x dilution into 1x PBS from the non-enzyme serum control sample as well. Additionally, prepare a 5 mM adenosine stock by adding 66.8 mg of adenosine to 50 mL of 1x PBS. Prepare a 250 µM dilution of adenosine by adding 400 µL of the adenosine stock to 7,600 µL of 1x PBS and prewarm it to 37 °C in an incubator.
- To a 96-well UV-compatible microplate, add 160 µL of the 250 µM adenosine dilution and 40 µL of each diluted protein sample in triplicate for a total volume of 200 µL. This will yield a final adenosine concentration of 200 µM and a final enzyme concentration of 10 nM.
- Repeat the dilution for the control samples by adding 40 µL of the diluted serum or 1x PBS controls and 160 µL of the 250 µM adenosine dilution in triplicate. This will also yield a final adenosine concentration of 200 µM but without enzyme.
NOTE: It may be beneficial to add all diluted enzyme and control samples individually to the microplate first and then add the adenosine substrate with a 12-channel micropipette to reduce the total loading time. Additionally, UV-transparent plates must be used in this step to prevent the plate itself from confounding the measured absorbance signal. - Measure the absorbance of each well at 260 nm for 30 min at 37 °C. Once done, export the data to a spreadsheet for further analysis.
3. Analysis of microplate reader data
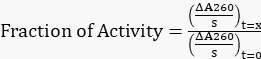
- Determine the slope of the linear region of the absorbance data as a function of time for the first several minutes of the microplate data. For the serum-diluted samples, this corresponded to the first ~120 s. For the 1x PBS-diluted samples, this corresponded to the first ~270 s. This slope of declining absorbance values will have a negative numerical value and will have units of change in absorbance units per second (ΔA260/s).
- Subtract out the slope of the negative control consisting of pooled human serum from the slope of the enzyme + serum data. Perform the same operation on the enzyme + 1x PBS mixtures by subtracting out the slope of the 1x PBS control.
- Normalize all the adjusted slopes to the original slope at t=0 h to obtain the fraction of activity remaining using Equation 1.
 Equation 1
 - Plot the fraction of activity remaining versus time.
Results
The figures show the results of the assay run when conducted with wildtype HsADA1. Figure 3A,B illustrate the absorbance decline curves at 260 nm of the samples originating from the 1x PBS/serum-enzyme mixtures for wildtype HsADA1 after the addition of adenosine. This declining absorbance as a function of time data is what the user may expect upon successful completion of the microplate-based assay and is similar to absorbance data that would arise after adding sufficient amounts of functional HsADA1 to adenosine. Figure 3C,D illustrates the absorbance curves of the tested negative controls, which contain no enzyme after adenosine addition. Compared to the actual enzyme samples, the absorbance change of these negative controls is almost negligible. From Figure 3, it can be seen that the slopes of the enzyme curves change as a function of incubation time. For example, the slope of the Day 0 timepoint is drastically steeper than the Day 5 timepoint.
Figure 4 illustrates the fraction of activity retained by wildtype HsADA1 as a function of time when incubated in either 1x PBS or pooled human serum at 37 °C. Specifically, the slopes of all absorbance decline curves in Figure 3A,B are normalized to the Day 0 slopes from their respective groups. As can be seen in Figure 4, there is a divergence in the activity retained for wildtype HsADA1 in 1x PBS versus pooled human serum. Specifically, the enzyme loses its activity faster in pooled human serum, with the enzyme retaining approximately 10% of its original activity at Day 5. A loss of activity is still detectable when HsADA1 is incubated in 1x PBS, though the enzyme retains approximately 75% of its activity. This is congruent with Jennings et al.'s results, also reporting a decrease in activity following incubation with serum at 37 °C by almost 40% after 48 h6. Lu et al. have also shown that HsADA1 activity declines in pleural, peritoneal, and cerebrospinal bodily fluids at ambient temperature (25 °C)8.
To demonstrate the flexibility of this protocol, we used it to test the serum stability of another enzyme of human origin, an engineered human kynureninase variant previously dubbed HsKYNase66-W102H-T333N7. HsKYNase66_W102H-T333N efficiently catalyzes the conversion of OH-Kyn into OH-AA, similar to the wildtype HsKYNase enzyme, although it is actually a two amino acid reversion mutant of an engineered human kynureninase variant with altered substrate specificity, i.e., that efficiently degrades kynurenine into anthranilic acid7. OH-Kyn absorbs strongly at 379 nm, while OH-AA does not, resulting in measurable absorbance decline upon the addition of our engineered HsKYNase variant to OH-kyn9,10. Figure 5A,B illustrates the absorbance decline curves at 379 nm of the samples originating from the 1x PBS/serum-enzyme mixtures for HsKYNase after the addition of OH-Kyn. Figure 5C,D illustrates the absorbance curves of the tested controls that do not contain enzymes. As seen with HsADA1, there is a clear difference in the slopes of the absorbance curves across samples. This is especially evident in Figure 5A, as the 0 h timepoint slope is much steeper than the 3 h and 24 h timepoints. Figure 6 illustrates the corresponding fraction of activity retained for the tested HsKYNase as a function of time. Like HsADA1, HsKYNase66-W102H-T333N loses activity in serum more quickly than in PBS (~85% activity lost versus ~40% over the course of 24 h). While this enzyme variant's serum stability has not been previously tested, it follows the general trend as other HsKYNase variants, which also lost most of their activity within 24 h in serum at 37 °C7.
Generally speaking, enzymes might lose activity over time due to a host of factors, including pH, salt concentration, temperature, and more11. Therefore, a result that does not follow this trend could be considered abnormal. For example, if the enzymatic activity increases drastically over time, this could indicate that the results are invalid. This is assuming enzyme conditions are not changed, and we are speaking strictly in a time sense.
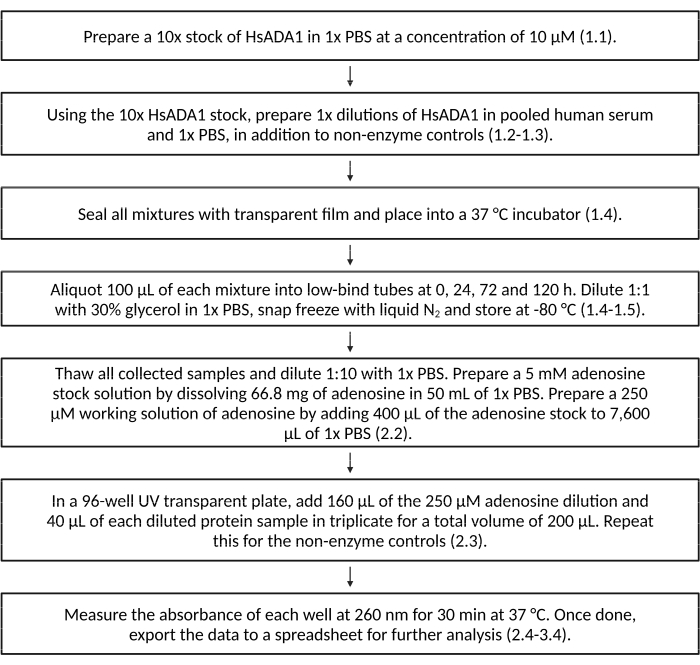
Figure 1: Flow chart detailing the steps of the protocol for HsADA1. The figure shows the steps followed in this protocol. Please click here to view a larger version of this figure.
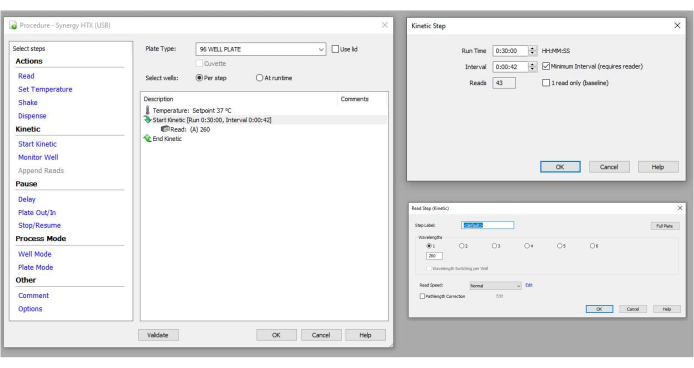
Figure 2: Microplate reader kinetic read settings. A kinetic read protocol was created to measure the absorbance at 260 nm for 30 min at 37 °C with the minimum interval. The figure depicts the chosen settings to set up this protocol. Please click here to view a larger version of this figure.
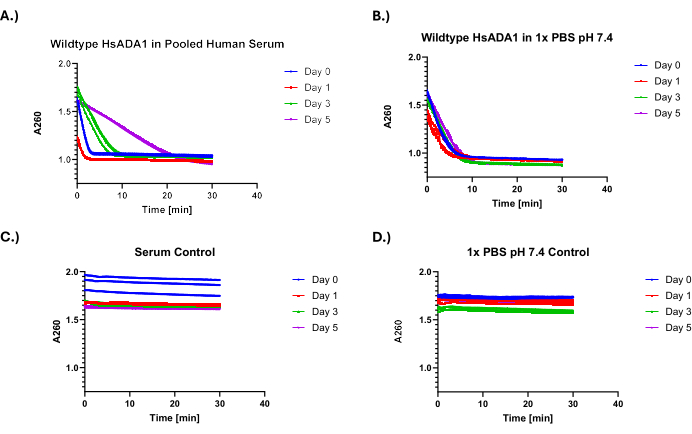
Figure 3: Absorbance versus time curves for HsADA1 after the addition of 200 µM adenosine. (A) Absorbance versus time curves for serum-incubated HsADA1 after the addition of 200 µM adenosine. (B) 1x PBS-incubated HsADA1. (C) Serum negative control. (D) 1x PBS negative control (n =3). Please click here to view a larger version of this figure.
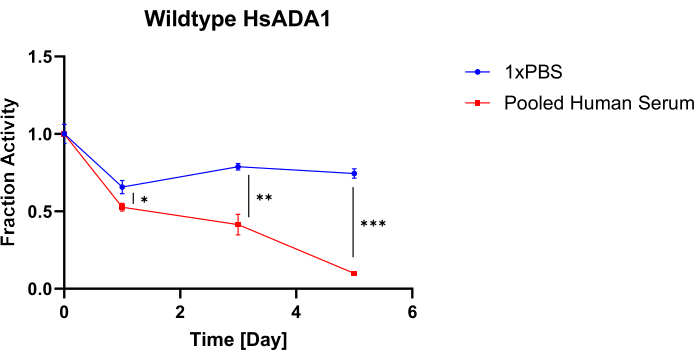
Figure 4: HsADA1 activity retention. The activity is assessed in 1x PBS versus pooled human serum at 37 °C. The fraction of original activity retained for HsADA1 incubated in 1x PBS versus pooled human serum over the course of 5 days was determined (bars = mean ± SD, n=3). A two-tailed unpaired t-test was used *p<0.05, **p < 0.01 and ***p < 0.001. Please click here to view a larger version of this figure.

Figure 5: Absorbance versus time curves for HsKYNase66-W102H-T333N after the addition of 400 µM OH-Kyn. (A) Absorbance versus time curves for serum-incubated HsKYNase after the addition of 400 µM OH-Kyn. (B) 1x PBS-incubated HsKYNase. (C) Serum negative control. (D) 1x PBS negative control (n=3). Please click here to view a larger version of this figure.

Figure 6: HsKYNase66-W102H-T333N activity retention. The activity is assessed in 1x PBS versus pooled human serum at 37 °C. The fraction of original activity retained for HsKYNase66-W102H-T333N incubated in 1x PBS versus pooled human serum over the course of 24 h was determined (bars = mean ± SD, n=3). A two-tailed unpaired t-test was used; ***p < 0.001. Please click here to view a larger version of this figure.
Supplementary Figure 1: Standard curve of adenosine and inosine. The plot was drawn for 0-200 µM. Adenosine or inosine was added to 1x PBS at the noted concentrations, and then the absorbance at 260 nm was measured. (n=3). Please click here to download this File.
Supplementary Figure 2: Standard curve of OH-Kyn. The plot was drawn for 0-400 µM. OH-Kyn was added to 1x PBS at the noted concentrations, and then the absorbance at 379 nm was measured. (n=3). Please click here to download this File.
Supplementary Figure 3: Absorbance versus time curves at 260 nm with increasing concentrations of HsADA1 after the addition of 200 µM adenosine. (A) Reaction curves for varying concentrations of HsADA1. (B) Fold change in the slope of the linear region of absorbance curves in relation to a 1x PBS control (bars = mean ± SD, n=3). A two-tailed unpaired t-test was used **p < 0.01 and ****p < 0.0001. Please click here to download this File.
Supplementary Figure 4: Absorbance versus time curves at 379 nm with increasing concentrations of engineered HsKYNase after the addition of 400 µM of OH-Kyn. (A) Reaction curves for varying concentrations of engineered HsKYNase. (B) Fold change in the slope of the linear region of absorbance curves in relation to a 1x PBS control (bars = mean ± SD, n=3). Two-tailed unpaired t-test was used ****p < 0.0001. Please click here to download this File.
Supplementary Figure 5: Absorbance versus time curves at 379 nm using heat-deactivated enzyme in 400 µM of OH-Kyn. Heat-deactivated HsKYNase enzyme was added to 400 µM of OH-Kyn in 1x PBS, and then the absorbance at 379 nm was measured. (n=3). Please click here to download this File.
Discussion
This protocol uses absorbance change as the substrate is converted to the product to gauge the activity of an enzyme. As such, the substrate and product must have distinct spectral profiles. This is the case with adenosine and inosine both having distinct spectral profiles and extinction coefficients between 260-265 nm6,8,12,13. This assay is inspired by several previous works. Kalackar, for example, utilized the change in absorbance at 265 nm as a direct correlate for adenosine deaminase activity14. Gracia et al. and Lu et al. employed an approach rooted in the Beer-Lambert law, which relates the initial velocity to the difference in the extinction coefficients between adenosine and inosine8,13. In a similar vein, OH-Kyn and OH-AA also have distinct spectral profiles in that OH-Kyn absorbs strongly at 379 nm while OH-AA does not9,10. The absorbance spectrum of metabolites can be easily checked using a full-spectrum scan on many microplate readers, which would, in turn, inform the user whether it is possible to track the progress of an enzymatic reaction. As stated earlier, Lu et al. have previously analyzed native HsADA1 stability in different bodily fluids, and Jennings et al. have employed a very similar method to gauge the serum stability of recombinant HsADA1 and a mutant enzyme6,8. This method, like that of Jennings et al., is unique in that we can use recombinantly expressed enzymes as opposed to natively derived ones. In doing so, this method can be extrapolated to mutant proteins not natively found within living organisms.
For product/substrate combinations that cannot be measured using a plate-based absorbance assay, this protocol can be modified to incorporate several other alternative analytical methods that track either substrate degradation or product formation for kinetic assays, such as high-performance liquid chromatography (HPLC), which for instance, has previously been used to assess the kinetics of both adenosine deaminase and kynureninase15,16,17. Only the method to determine the remaining substrate or created product after a certain time (if not determined continuously) should vary. The choice of the assay will, of course, be dependent on the reaction being catalyzed by the enzyme of interest, and a key consideration in this choice will also be the compatibility of a given analytical method with diluted human serum. Of equal importance may also be the total time required to analyze all samples of interest, and a key benefit of utilizing the microplate assay is the ability to easily analyze degradation rates in up to 96 samples at a time.
Assay parameters such as the on-plate enzyme and substrate concentrations will need to be tuned for individual enzymes of interest. For all the assays conducted here, a substrate concentration above Km by an order of magnitude greater (1.15-1.26 OOM) was chosen. Wildtype HsADA1 has a Km of ~14 µM for adenosine, and the final on-plate adenosine concentration used was 200 µM3. Similarly, the engineered HsKYNase variant tested has a Km ~22 µM for OH-Kyn, and the final on-plate OH-Kyn concentration used was 400 µM7. One important requirement for the substrate concentrations of interest for the microplate assay is that the substrate obeys the Beer-Lambert law within the given range, such that an absorbance decrease can be linearly correlated with substrate degradation (Supplementary Figure 1 and Supplementary Figure 2). This linear correlation removes the need to convert absorbance change to substrate concentration, as performing this conversion would not change the remaining activity fraction.
As for the enzyme concentration, the main criterion to consider is for there to be sufficient substrate degradation relative to the background. For both HsADA1 and the engineered HsKYNase, we used previously published literature values to generate representative results6,7. As we have shown here, using shorter times with higher enzyme concentrations can be feasible, as can using longer times and lower enzyme concentrations. In general, a longer time period/lower enzyme concentration may give more reproducible results unless the substrate itself is prone to degradation. In this vein, both kynurenine and its derivatives, including OH-Kyn, degrade relatively quickly at room temperature, resulting in a noticeable yellowing of the substrate mixture18. For other enzymes, a simple concentration escalation experiment can be conducted to identify concentrations with the most optimal reaction curves and background separation. Performing this concentration escalation on HsADA1 shows that within a 1-10 nM range, the greatest background separation is achieved (Supplementary Figure 3). Performing this same concentration escalation experiment with engineered HsKYNase shows a similar trend with the greatest background separation at 2 µM (Supplementary Figure 4). However, both assays (HsADA1 versus HsKYNase) do not possess the same sensitivity. For HsADA1, an on-plate enzyme concentration one-tenth of that used in the protocol is still distinguishable from background at statistically significant levels (Supplementary Figure 3). The same does not hold true for HsKYNase, meaning it may be harder to quantitatively assess how much activity HsKYNase retains once it has lost more than 90% of its activity. This represents a potential limitation of the microplate reader method.
Additionally, one observation we made for HsKYNase was that upon plate loading, there was an immediate gap between the absorbance readings between the enzyme + 1x PBS samples and the 1x PBS control (Figure 5B,D). This gap was present for all the time points. Because we also observed this phenomenon when testing heat-deactivated enzyme (heated at 95 °C for 10 min), we concluded that it was not a result of enzyme-mediated substrate degradation (Supplementary Figure 5). While we proceeded with original control absorbance values, future studies could use deactivated enzyme controls to eliminate this discrepancy. However, the cost to purchase or produce the enzyme of interest should be taken into account. For both HsKYNase and HsADA1, there was some variability in the starting absorbance values of the test samples, with some starting at a lower absorbance value than their associated controls (Figure 3 and Figure 5). This could be partially attributed to the lag time in adding substrate to all the protein samples, followed by loading into the plate reader. However, because the substrate concentration used is much higher than the Km values of the used enzymes, this is not expected to lead to substrate concentration-dependent effects on the observed slopes.
In the protocol and representative results section, samples are aliquoted at the indicated time points, with the sampling time varying based on the activity profile of an enzyme. This sampling schedule will depend on the activity profile of an enzyme of interest in serum. If an enzyme loses activity quickly, then a smaller sampling interval will be desired, as is the case with the HsKYNase_66-W102H-T333N mutant tested, and the opposite is true for enzymes with greater serum stability. As such, it is likely beneficial to run a trial of this protocol whereby aliquots are sampled in both small intervals (1 h, 2 h, etc.) and large ones (24 h, 48 h, etc.) to survey what the serum stability profile looks like for a new enzyme of interest. Of course, as it becomes more robust, the serum stability will become less relevant compared to renal clearance or other mechanisms of in vivo protein clearance.
Because kynureninases differ from HsADA1, we modified several assay parameters, namely enzyme concentration during incubation in serum or 1x PBS, sampling interval, microplate assay enzyme concentration, microplate assay substrate concentration, and, of course, the substrate itself. The changes are: the 10x enzyme stock was at a concentration of 100 µM, which, after diluting with serum/1x PBS, resulted in a concentration of 10 µM. The sampling interval in the serum incubation method was adjusted because the HsKYNase loses activity faster in serum than in HsADA1. Therefore, the method included sampling at 0.5 h, 3 h, and 24 h time points. Additionally, HsKYNase samples were not flash frozen, instead being immediately analyzed using the microplate assay. The plate reader was configured to read at 379 nm to monitor the progress of the enzymatic reaction. Another important difference in the microplate-based assay when studying the HsKYNase enzyme is the preparation of the substrate. A 2 mM stock of OH-Kyn was made by dissolving 4.5 mg of OH-Kyn in 10 mL of 1x PBS. At the same time, 6 mg of pyridoxal phosphate (PLP), the HsKYNase co-factor, was dissolved into 1 mL of 1x PBS to make a 100x stock of PLP. A 500 µM dilution of OH-Kyn was prepared by adding 2.5 mL of OH-Kyn stock to 7.5 mL of 1x PBS as well as 100 µL of the 100x PLP stock. To run the microplate assay, 80 µL of the 500 µM OH-Kyn dilution and 20 µL of the aliquoted protein samples or negative controls were added in triplicate to a 96-well UV-compatible microplate. This yielded a final OH-Kyn concentration of 400 µM and a final enzyme concentration of 2 µM, after which the absorbance at 379 nm was measured for 30 min at 37 °C. Unlike HsADA1, which was diluted before being analyzed on the plate reader, HsKYNase was not diluted.
While this protocol is relatively facile, a potential challenge could lie in preparing the original enzyme stocks. All the enzymes used in the representative results section were expressed in E. coli and purified using nickel-based affinity chromatography followed by size exclusion chromatography (SEC). Several other sources have expertly described alternatives to our method of purification, spanning host organisms and downstream processing19,20. This assay fundamentally tries to determine the ability of an enzyme to retain its activity in pooled human serum. One assumption in our methodology is that an enzyme's loss in activity is permanent, i.e., removing a deactivated enzyme from serum will not restore its activity. This is significant because, in this protocol, we dilute the enzyme mixtures further with glycerol and 1x PBS before flash freezing and after thawing. If this loss in activity is reversible upon removal of the serum, these additional dilutions will prevent the assay from capturing this phenomenon. If this is of concern to the user, then 1.) pooled human serum can be used as a diluent instead of 1x PBS in the preparation of all substrate and test sample solutions, and 2.) the flash freezing and addition of glycerol can be skipped, and samples can be immediately processed to maintain the enzyme in its original environment. Lastly, while this assay can be used to probe the serum-specific effects on enzyme activity, no conclusions can be made regarding the specific mechanism behind such effects. Whether this loss of activity is caused by enzyme unfolding, aggregation, loss of cofactor, or cleavage by serum proteases would need further investigation. Similar qualifications can be said of the 1x PBS incubated enzyme in that mechanistic conclusions cannot be derived from this assay.
In the context of developing protein biologics as therapeutics, the ability to retain activity in serum is an important metric21. A therapeutic enzyme that loses its activity very quickly would have to be dosed repeatedly to obtain clinical benefit. This work provides users with an in vitro assay to quantitatively screen enzymes for enhanced serum stability. If coupled with directed evolution efforts, enzymes with superior serum stability could be screened and selected for, giving greater potential for translatability. Additionally, we anticipate that this protocol can also work with more advanced systems, for example, to measure serum stability where the enzyme is encapsulated. Das et al. applied an assay for several different enzymes packaged in virus-like particles and tested their stability in different denaturing conditions, such as organic solvents22.
Disclosures
JB and MRJ are inventors on patents or patent applications related to adenosine deaminase and/or kynureninase enzymes. All other authors have no conflicts of interest to disclose.
Acknowledgements
This work was supported by the National Institutes of Health [1DP2CA280622-01] and funding from Biolocity. We thank Dr. Maria Jennings and Andrea Fox for providing the HsADA1 and HsKYNase expression vectors.
Materials
| Name | Company | Catalog Number | Comments |
|---|---|---|---|
| Adenosine | Sigma Aldrich | A9251-25G | 25 g |
| BioTek Synergy HT Microplate Reader | |||
| Eppendorf LoBind Microcentrifuge Tubes: Protein | Fisher Scientific | 13-698-795 | 2 mL |
| Glycerol | Fisher Scientific | G33-4 | 4 L |
| HsKYNase66-W102H-T333N | In-house | ||
| Human Serum, Pooled | MP Biomedicals | 92931149 | 100 mL |
| Hydroxy-kynurenine | Cayman Chemicals | 27778 | |
| Inosine | TCI | I0037 | 25 g |
| PBS, 1x pH 7.4+/- 0.1 | Corning | 21-040-CM | |
| Pyridoxal 5-phosphate monohydrate, 99% | Thermo Scientifc | 228170010 | 1 g |
| UV-STAR MICROPLATE, 96 WELL, COC, F-BOTTOM | Greiner Bio | 655801 | |
| Wildtype Human Adenosine Deaminase 1 | In-house |
References
- Valero, J., et al. A serum-stable RNA aptamer specific for SARS-COV-2 neutralizes viral entry. Proc Natl Acad Sci U S A. 118 (50), e2112942118(2021).
- Iannuzo, N., et al. High-throughput screening identifies synthetic peptides with antibacterial activity against mycobacterium abscessus and serum stability. ACS Omega. 7 (27), 23967-23977 (2022).
- Ma, M. T., Jennings, M. R., Blazeck, J., Lieberman, R. L. Catalytically active holo homo sapiens adenosine deaminase i adopts a closed conformation. Acta Crystallograph Sect D. 78 (1), 91-103 (2022).
- Li, W., et al. Determination of 4 nucleosides via one reference compound in chinese cordyceps by hplc-uv at equal absorption wavelength. Natural Prod Comm. 18 (3), 1934578X231161410(2023).
- Whitmore, K. V., Gaspar, H. B. Adenosine deaminase deficiency - more than just an immunodeficiency. Front Immunol. 7, 314(2016).
- Jennings, M. R., et al. Optimized expression and purification of a human adenosine deaminase in E. coli and characterization of its asp8asn variant. Prot Express Purificat. 213, 106362(2024).
- Blazeck, J., et al. Bypassing evolutionary dead ends and switching the rate-limiting step of a human immunotherapeutic enzyme. Nat Catalysis. 5 (10), 952-967 (2022).
- Lu, J., Grenache, D. G. Development of a rapid, microplate-based kinetic assay for measuring adenosine deaminase activity in body fluids. Clinica Chimica Acta. 413 (19), 1637-1640 (2012).
- Maciel, L. G., Dos Anjos, J. V., Soares, T. A. Fast and low-cost evaluation of hydroxykynurenine activity. MethodsX. 7, 100982(2020).
- Bokman, A. H., Schweigert, B. S. 3-hydroxyanthranilic acid metabolism. Iv. Spectrophotometric evidence for the formation of an intermediate. Arch Biochem Biophys. 33 (2), 270-276 (1951).
- Tanford, C. Advances in protein chemistry. 23, Academic Press. 121-282 (1968).
- Tritsch, G. L. Validity of the continuous spectrophotometric assay of kalckar for adenosine deaminase activity. Anal Biochem. 129 (1), 207-209 (1983).
- Gracia, E., et al. The catalytic site structural gate of adenosine deaminase allosterically modulates ligand binding to adenosine receptors. FASEB J. 27 (3), 1048-1061 (2013).
- Kalckar, H. M. Differential spectrophotometry of purine compounds by means of specific enzymes: Iii. Studies of the enzymes of purine metabolism. J Bio Chem. 167 (2), 461-475 (1947).
- Hartwick, R., Jeffries, A., Krstulovic, A., Brown, P. R. An optimized assay for adenosine deaminase using reverse phase high pressure liquid chromatography. J Chromatographic Sci. 16 (9), 427-435 (1978).
- Paul, M. K., Grover, V., Mukhopadhyay, A. K. Merits of hplc-based method over spectrophotometric method for assessing the kinetics and inhibition of mammalian adenosine deaminase. J Chromatography B. 822 (1), 146-153 (2005).
- Ubbink, J. B., Vermaak, W. J. H., Bissbort, S. H. High-performance liquid chromatographic assay of human lymphocyte kynureninase activity levels. J Chromatography B: Biomed Sci Appl. 566 (2), 369-375 (1991).
- Tsentalovich, Y. P., Snytnikova, O. A., Forbes, M. D. E., Chernyak, E. I., Morozov, S. V. Photochemical and thermal reactivity of kynurenine. Exp Eye Res. 83 (6), 1439-1445 (2006).
- Demain, A. L., Vaishnav, P. Production of recombinant proteins by microbes and higher organisms. Biotechnol Adv. 27 (3), 297-306 (2009).
- Gräslund, S., et al. Protein production and purification. Nat Methods. 5 (2), 135-146 (2008).
- Faber, M. S., Whitehead, T. A. Data-driven engineering of protein therapeutics. Curr Opin Biotechnol. 60, 104-110 (2019).
- Das, S., Zhao, L., Elofson, K., Finn, M. G. Enzyme stabilization by virus-like particles. Biochemistry. 59 (31), 2870-2881 (2020).
Reprints and Permissions
