Here we present a protocol for constructing an organ-on-chip (OOC) system designed to mimic pneumonectomy. This system investigates the potential correlation between glycocalyx impairment and complications following pneumonectomy.
A subscription to JoVE is required to view this content. Sign in or start your free trial.
Method Article
Modeling the Endothelial Glycocalyx Post-Pneumonectomy in a 3D Fluidic Chip - An Approach to Fabricating a Vascular-based Organ-on-Chip System
In This Article
Summary
Abstract
Endothelial glycocalyx (GCX), a carbohydrate-rich layer coating the luminal surface of endothelial cells, plays a pivotal role in regulating cellular responses to stimuli. It is comprised of transmembrane proteins serving as mechanotransducers for cellular responses. While it naturally maintains its structure and stability under homeostatic conditions, exposure to high-shear stress can induce damage with numerous consequences. General shear stress effects on endothelial cells have been explored, but the extent and impact of shear stress on vascular systems, specifically post-pneumonectomy, have not been well studied. To investigate this, a comprehensive approach was undertaken, involving the creation of a CAD model of pulmonary vasculature pre- and post-pneumonectomy. Utilizing computational fluid simulation, key regions of elevated shear stress and pressure were identified and replicated in an organ-on-chip (OOC) system. Human lung microvascular endothelial cells (HLMVECs) were seeded onto a mold in the shape of the selected sections to characterize the effects of elevated shear stress in vitro. Following experimentation, HLMVECs were immunostained to qualitatively evaluate GCX health under normal and increased stresses induced by pneumonectomy. The integration of computational modeling and experimental analysis enhances our understanding of how changes in shear stress affect GCX, clarifying their effects on vascular function and post-surgical complications.
Introduction
A pneumonectomy is an invasive and high-risk surgical intervention performed to extract the right or left lung1. This procedure is typically utilized as a treatment option for various severe ailments such as lung cancer, pulmonary tuberculosis, and traumatic lung injuries2. While the procedure holds promise, it poses significant risks, highlighted by increased rates of postoperative complications ranging from arrhythmias to pulmonary edemas1.
Pneumonectomies have a profound impact on cardiovascular dynamics by directing the heart's entire cardiac output into the remaining lung3. This redirection of blood flow is known to increase pressure and shear stresses within the remaining pulmonary vasculature4. With these vast alterations in blood flow patterns, the endothelial glycocalyx (GCX) plays a pivotal role in sensing these changes in the blood flow patterns5.
The GCX is a gel-like layer that regulates biochemical activities in response to changes in its environment6,7. Its expression has been shown to increase with prolonged exposure to uniform flow and decrease with exposure to disturbed flow compared to static culture8,9. The GCX exhibits a variable thickness ranging from 0.1-1 µm across the entire vasculature and functions as an essential mechanotransduction layer coating the endothelial cells of blood vessels10. The network is composed of a dense layer of sugars, lipids, and proteins, as shown in Figure 1. These sugars bind to form glycans, which can exist either freely in the bloodstream or attached to proteins or lipids, resulting in the formation of proteoglycans, glycoproteins, or glycolipids7,11. Proteoglycans are composed of glycosaminoglycan (GAG) chains, which bind to the cell membrane through plasma proteins or receptors. These GAGs include heparan sulfate (HS), hyaluronic acid (HA), chondroitin sulfate (CS), dermatan sulfate, and keratan sulfate12. Heparan sulfate is the predominant GAG, making up over 50% of the total GAGs found in the GCX. These side chains can attach to embedded core proteins, which include glypicans (anchored by glycosylphosphatidylinositol) and syndecans (with a membrane-spanning domain), along with CD44 (a surface adhesion receptor). The complexes described above play a crucial role in regulating growth factors, anti-inflammatory reactions, facilitating vessel dilation, and controlling vascular permeability13.
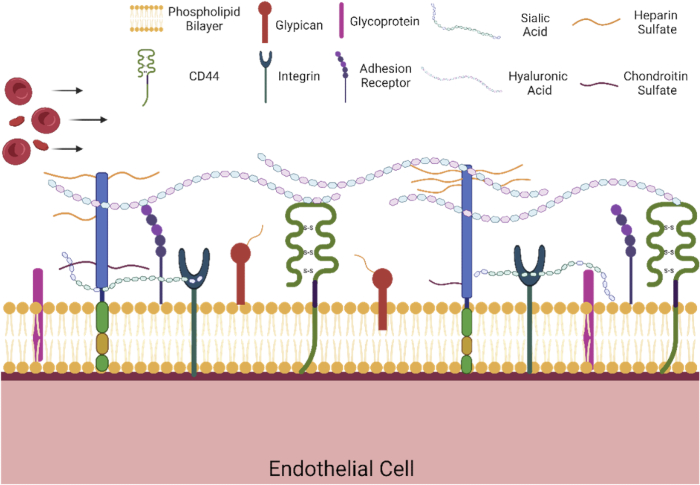
Figure 1: GCX component diagram. Schematic representing the components of the endothelial glycocalyx. This schematic displays the apical glycocalyx, which is found on the lumen of the vessel, showing its membrane-bound proteoglycans and glycoproteins. Created with BioRender.com Please click here to view a larger version of this figure.
Although the precise connection between pneumonectomies and GCX damage is not well studied, there exists a plausible correlation between the altered blood flow patterns induced by pneumonectomies and the integrity of the GCX. Disturbed blood flow in the vasculature is known to inflict damage on the GCX6. We hypothesized that increased disturbed flow and changes in shear stress in the remaining vasculature following a pneumonectomy may inflict damage to the GCX over time. This accelerated deterioration may catalyze postoperative complications and morbidities, thereby increasing the inherent risks to the patient's overall health13.
This protocol aimed to model the pulmonary vasculature following pneumonectomy, following the general procedure outlined in Figure 2. Fluid simulations were conducted on a computer-aided design model replicating human pulmonary vasculature with and without pneumonectomy. The pneumonectomy models were created by designing 3D pulmonary vasculature in 3D modeling software, based on dimensions derived from CT scans and literature data, then further simplifying them for flow simulations in computational fluid dynamics (CFD) software. The simulations identified specific areas of interest, chosen by areas where shear stress was increased in the pneumonectomy models when compared to the control. These areas of interest were chosen to replicate for building an in vitro model. The in vitro model utilized a fluidic chamber design to simulate multiple sections of vasculature with normal geometry and pneumonectomy geometry to simulate the difference in flow conditions.
Human lung microvascular endothelial cells (HLMVECs) were cultured on fibronectin-coated polydimethylsiloxane (PDMS) substrates, shaped to mimic a selected bifurcation region. Microvascular endothelial cell culture media was perfused through the system using a peristaltic pump. Finally, the cells and GCX were fixed, immunostained with a GCX-staining antibody, and visualized using a fluorescent microscope to evaluate their condition after exposure to fluid flow. A general timeline of the protocol can be found in Table 1.
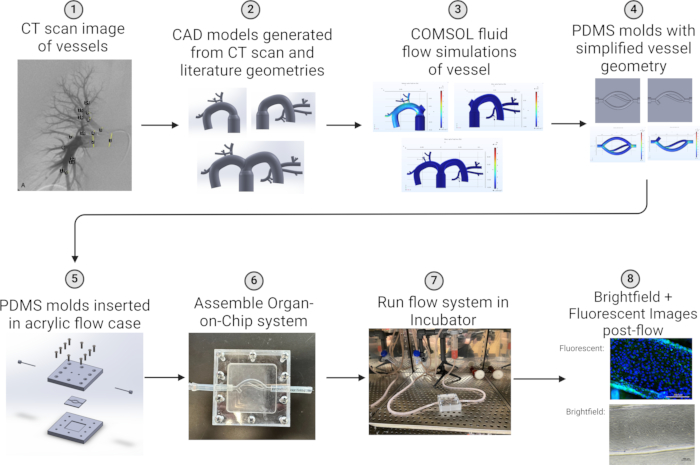
Figure 2: OOC development sequence. Sequence of developing a novel OOC system to study the effects of lung pneumonectomy (1) CT scan generated of human pulmonary vasculature. (2) CT scan geometry used to identify regions of interest for 3D CAD model. (3) Fluid flow simulations to determine geometries of interest for in vitro model. (4) PDMS mold modeled containing areas of interest from simulation results (5) Mold inserted into acrylic case to fix mold for perfusion (6) Completed flow chamber setup (7) Complete flow chamber setup transferred to incubator (8) Brightfield and fluorescent images taken after exposure to shear stress. Created with BioRender.com Please click here to view a larger version of this figure.
Table 1: General protocol timeline. General Sequence of performing steps within the protocol with average duration (h) of each step. Please click here to download this Table.
Access restricted. Please log in or start a trial to view this content.
Protocol
This study utilized computed tomography (CT) imaging data from previous literature14 that was collected in compliance with the Institutional and Federal ethical standards. All imaging data that were referenced had informed consent from participants, following approval by the Institutional Review Board (IRB) to ensure the protection of participants' rights and privacy.
1. Modeling pulmonary vasculature in CAD software
- Research physiological geometries of the primary vessels to be modeled.
- Use patient CT images of the vessels to be modeled to choose specific geometries to replicate, shown in Figure 2.
NOTE: For this protocol, clinical condition lung CT scans from previous literature were utilized14. This protocol also permits the usage of any CT scan data to generate in vitro models.- Open a DICOM viewer and Import the CT images. Navigate through the slices to identify the vessels of interest. Save the relevant images for further analysis.
NOTE: The vessel replicated for this protocol was lung vasculature, as the application of this protocol is to model the endothelial glycocalyx in healthy and post-pneumonectomy conditions. Other locations can be used for different applications.
- Open a DICOM viewer and Import the CT images. Navigate through the slices to identify the vessels of interest. Save the relevant images for further analysis.
- Using ImageJ FIJI v1.54f15, measure vessel diameters from CT images or literature values.
- Open ImageJ FIJI and Import the saved CT images: select File > Open.
- Select the Line Tool from the toolbar to draw a line spanning the length of the scale bar on the CT image.
- Then select Analyze > Set Scale. Enter the known distance (e.g., if the scale bar in the image is 10 mm, enter 10 as the known distance). Enter the unit of length (e.g., mm). Click OK.
- Use the line tool to measure diameters. To do so, select the Line Tool from the toolbar and draw a line spanning the vessel diameter. Then select Analyze > Measure to get the diameter value.
- Repeat steps 1.3 and 1.4 for all vessels of interest and record the measurements.
- Compile vessel measurements into segment types for ease of modeling.
- Create a spreadsheet to categorize the vessel measurements and label each row with the vessel name, measurement, and segment type (e.g., artery, vein).
- Create a reference table for vascular segment lengths and diameters based on literature and radiography measurements.
- Generate a 3D model using 3D modeling software to replicate the geometry and dimensions of the CT images.
- Open the software and create a new part file: select File > New > Part and select Sketch > Create Sketch and draw the profile using the dimensions from ImageJ.
- Utilize surface sweeps and lofting for 3D geometry: for sweeps, select Features > Swept Boss/Base. For lofts, select Features > Lofted Boss/Base.
- Refine the model to match the exact measurements.
- Identify model variations to be developed, such as a control model and pneumonectomy model.
- Outline the different conditions (e.g., normal vs. pneumonectomy) and list the structural changes needed for each variation.
- Duplicate the original model for modification to create the experimental models according to your parameters (i.e., right and left pneumonectomy).
- Save the original model, then select File > Save As Copy to create copies for each experimental condition.
- Modify each copy according to the defined parameters (e.g., right and left pneumonectomy).
- Convert the model from a part file to a Parasolid file for computational fluid dynamics (CFD) simulations.
- Select File > Save As. Choose Parasolid (*.x_t) from the file-type dropdown, then save the file in the desired directory.
2. Fluid flow simulation
NOTE: This step is helpful in locating regions of modified shear stress after pneumonectomy to select the vascular geometry to replicate for the in vitro system. Additionally, the software license must support the Import Module.
- Set up a new steady-state laminar flow study.
- Select Model Wizard > 3D (space dimension) > fluid flow > single-phase flow > laminar flow (spf) > select Add to add laminar flow physics interface > select Study > choose Stationary under General Study > select Done.
- Add geometry from CAD model.
- Import Parasolid file.Select Cap Faces, and in the Graphics window, select the circumference of the inner wall of the vessel at each open inlet and outlet. These will be the bounding edges of the cap faces.Select Form Union and Build All.
- Select Remove Details and ensure all options are selected under Details to Remove, then select Build All to remove unnecessary geometry.
- Creating Mesh 1 (meshed vessel wall + meshed fluid domain).
- Set Size to predefined: extra fine, calibrate for fluid dynamics.
- Set Size 1 to predefined: extra fine, calibrate for fluid dynamics, for Geometric Entity Selection, specify Boundary and Manual. In the Graphics window, select all visible outer faces of the vessel wall domain, including the ring-like face around the cap face. Do not select cap faces at the inlet and outlets.
NOTE: Select the cap face at the end of the removed section on the right and left of pneumonectomy models as these are considered geometric boundaries after a pneumonectomy. - Under Corner Refinement, select Domain and Manual. In the Graphics window, select [Domain] 1 (vessel wall) and [Domain] 2 (fluid).
- Under Boundary Selection, ensure the boundaries are the same as specified in the "Geometric Entity Selection" from "Size 1."
- Under Free Tetrahedral 1, select Remaining for Geometric entity level under Domain Selection.
- Under Boundary Layers 1, and Geometric Entity Selection, specify Domain, and select Manual, in the Graphics window [Domain] 1 and [Domain] 2. Boundary Layer Properties will be the same selection specified in Size 1.
- Build the mesh by selecting Build All under Mesh 1.
- Creating Mesh 2 (meshed fluid domain only).
- Right click Mesh 1, select Import to create "Mesh 2," and delete Import 2.
- Under Import 1, select Meshing sequence to automatically select Mesh 1. Ensure Build source mesh automatically, Import domain elements, and Import unmeshed domains are checked and then select Import. All the settings defined in Mesh 1 will be carried over to Mesh 2.
- Right click Mesh 2 and select Delete Entities. For Delete Entities 1, under Geometric Entity Selection select Domain, select Manual, in the Graphics window select [Domain] 1 (vessel wall), then select Build All to leave only the fluid geometry because the surface of the fluid domain mesh will be at the interface between the fluid flow and the inner wall of the vessels.
- Add Flow Material: Create a new material using properties of blood from literature. Right click Materials and select Blank Material. Select Domain in the geometric entity level selection, select All domains. Select Nonsolid for Material type, add the material properties of blood, including viscosity and density.
- Set up Laminar Flow study boundary conditions and parameters.
- Select Laminar Flow (spf), under Domain Selection, select All domains. Only [Domain] 1 will be listed. Domain 1 in this case is the fluid geometry, not the vessel wall. Fluid Properties 1 is automatically filled from the material defined in step 5.
- Set Initial Values 1 pressure to physiological blood pressure.Set the boundary condition for Wall 1 to no-slip.
- Select Inlet 1 in the Graphics window and set the boundary condition to Fully developed flow. Ensure Apply condition on each disjoint selection separately is checked.
- Under Fully Developed Flow, select Flow rate and enter the velocity.
- For Outlet 1, select all outlets in the Graphics window, and ensure the Boundary condition is set to Pressure.
- Under Pressure Conditions, select Total and enter the pressure. Select Average and Suppress backflow.
- Set up and run the study.
- For Step 1: Stationary under Study, ensure the Physics and Variables section matches the intended study, and Mesh Selection component 1 is set as Mesh 2. Select Compute.
- Analyze Shear Stress Results.
- Right click Pressure (spf) and select Duplicate. Rename as Shear Stress.
- Under Shear Stress, select Surface and change the dataset to Study 1/Solution 1 (sol1).
- Under Expression, type spf.sr*spf.mu set units to Pa.
NOTE: This stands for "single-phase flow shear rate * single-phase flow viscosity". - Next, select Plot and right click on Transparency 1 and select Disable.
- Right click on Shear Stress and select Volume to change the Dataset to Study 1/Solution 1 (sol1).
- Under Expression, type spf.sr*spf.mu and set units to Pa.
- Select Plot, right click on Surface, and select Disable to visually analyze "Volume 1" to determine vessel areas of interest to study in the OOC model
3. Preparation of PDMS molds
- Using fluid simulation results, choose geometries for control and pneumonectomy by selecting areas that exhibit significant differences in shear stress between control and pneumonectomy models and replicate them as negative molds in CAD. Dimensions of CAD models of control and pneumonectomy vasculature are shown in Figures 3 and Figure 4.
- Additionally, design plugs for the inlet and outlet of the mold to prevent leakage during cell seeding.
- Using a 3D printer, print the molds and the plugs using PLA filament.
- Obtain the polylactic acid (PLA) molds that were 3D printed (control + pneumonectomy) (Figure 5A).
- Weigh 10 parts silicone elastomer base and 1 part silicone elastomer curing agent to make a total of 30 mL of mixture (10:1 mass/mass ratio) to fill the molds to a thickness of 3mm (Figure 5B).
NOTE: Do not mix stock solutions during the weighing process. Use separate weighing materials for each reagent. - Pour the elastomer base and curing agent together and thoroughly mix
NOTE: This can be done in a weighing boat. - Pour the well mixed solution into the molds (about 15 mL for mold half) (Figure 5C).
- Degas the PDMS by putting it into a vacuum chamber for 30 - 60 minutes or until no bubbles remain (Figure 5D).
- Remove PDMS from the vacuum chamber and cure at room temperature for 48 h.
NOTE: An oven was not used for curing due to the thermal capacity of the PLA molds. - Extract the PDMS from the PLA mold.
- Rinse the PLA mold liberally with DI-water to ensure no impurities remain on its surface so it can be used again.
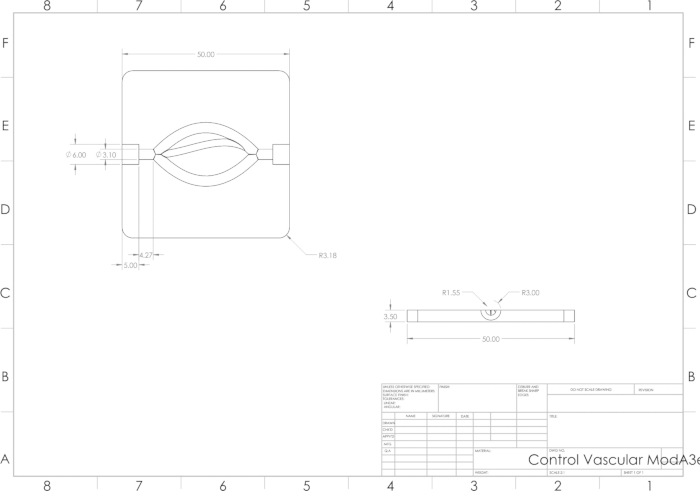
Figure 3: 3D CAD drawing of control vasculature. Dimensions, in mm, of the control vasculature model in a top view and side view. Please click here to view a larger version of this figure.
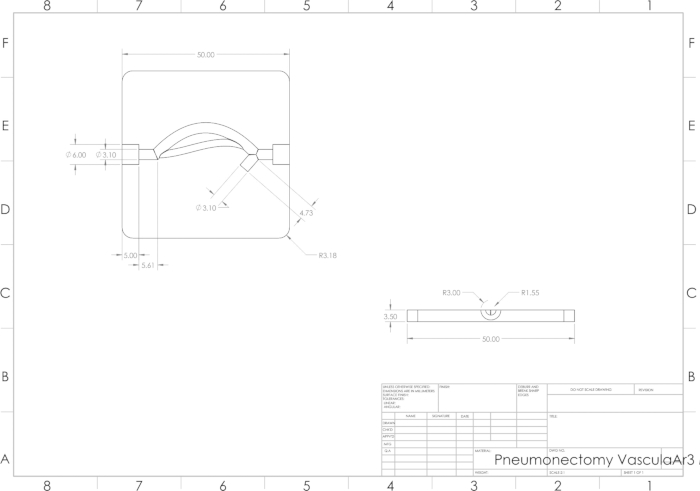
Figure 4: 3D CAD drawing of pneumonectomy vasculature. Dimensions, in mm, of the pneumonectomy vasculature model in a top view and side view. Please click here to view a larger version of this figure.
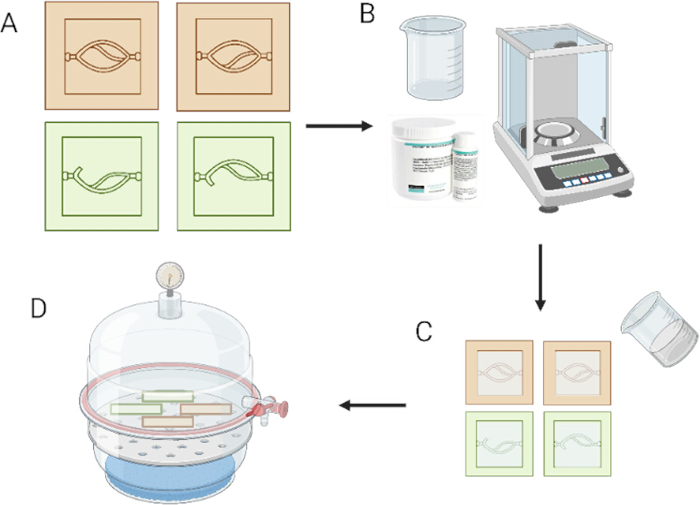
Figure 5: Creating PDMS molds. Creating PDMS molds. (A) 3D-printed PLA molds for control (orange) and pneumonectomy (green) experiments. (B) Weighing scale with PDMS making materials. (C) Pouring the PDMS mixture (10:1 base + curing agent) into the 3D-printed molds. (D) Degassing PDMS in a vacuum chamber. Created with BioRender.com Please click here to view a larger version of this figure.
4. Cell culture and seeding
- Use proper aseptic technique according to local lab protocols.
- Spray with 70% ethanol and bring all necessary materials and components into the biosafety cabinet (BSC) (Figure 6A) including, PDMS pieces and four pieces of double-sided tape.
- Place two pieces of the double-sided tape in each cell culture plate (Figure 6B).
- Place each PDMS vasculature half in its own cell culture dish on top of the double-sided tape (Figure 6C).
- Further sterilize all components by exposure to UV light for 20 min in the BSC.
- Thaw trypsin, HLMVEC culture media, and 20 µg/mL fibronectin at 37 °C if necessary.
- Place several 30 µL drops of 20 µg/mL fibronectin along the PDMS vasculature using a micropipette. Tilting PDMS if necessary, use a pipette tip to evenly coat the PDMS (Figure 7A).
- Incubate the PDMS pieces for 30 min while in the BSC.
- After incubation, aspirate fibronectin solution and allow PDMS pieces to dry in the BSC (Figure 7B).
- Bring a confluent flask of HLMVEC cells from the incubator (37 °C, 5% CO2) into the BSC.
- Aspirate HLMVEC culture media from the culture flask. Rinse briefly with trypsin or sterile PBS.
- Aspirate the wash and add 3 mL of trypsin to the flask. Incubate at 37 °C, 5% CO2 for 5 min. Observe the cells with a microscope to confirm that all cells are detached from the flask.
- Add 9 mL of HLMVEC complete culture medium to stop the trypsin action.
- Transfer the cell suspension to a 50 mL conical tube, then rinse the flask with 10 mL of HLMVEC culture medium to collect any remaining cells.
- Transfer to the 50 mL tube. Centrifuge cells at 220 x g for 5 min.
- When complete, visually confirm the cell pellet at the bottom of the tube. Spray the tube with 70% ethanol and bring it into the biosafety cabinet. Aspirate the supernatant, leaving the pellet.
- Gently resuspend cells in 1 mL of fresh HLMVEC culture medium and count the cells using a hemocytometer. Calculate the total cell number using the equations below, where A-H is the number of cells counted per hemocytometer square. Keep cells on ice.
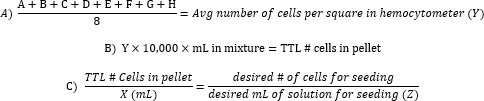
- Bring the concentration of cells to 2 x 10⁶ cells/mL with HLMVEC culture medium.
- Place the 3D-printed plugs at the ends of each vasculature half to eliminate cell suspension leakage from the PDMS mold, as shown in Figure 5 (4 total plugs, 2 per PDMS Piece) (Figure 7C).
- Seed 300 µL of HLMVEC cell suspension (600 k cells) using a micropipette into each PDMS piece (Figure 7D).
- Gently transfer the PDMS pieces containing HLMVEC cells to the incubator (37 °C, 5% CO2) for 1-2 h to attach (Figure 7E).
- Inspect with a microscope to visually confirm successful HLMVEC attachment to the PDMS substrates.
- Return the PDMS vasculature halves to the BSC.
- Remove the four plugs, add enough HLMVEC culture medium to submerge the PDMS vasculature halves, and return the culture plates containing the PDMS vasculatures to the incubator (Figure 7F).
- 6-10 h following seeding, manually pipette the HLMVEC culture media surrounding the PDMS to the vasculature to refresh the media closest to the cells.
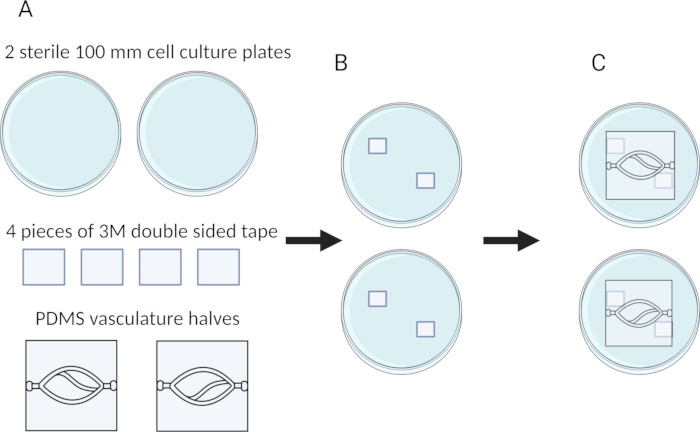
Figure 6: Attaching PDMS molds to plates. Basic steps in attaching the PDMS vasculature to cell culture plates. (A) Materials required for placing PDMS vasculature halves in culture plates. (B) Two pieces of double-sided adhesive tape are placed diagonally in each sterile culture plate. (C) PDMS vasculature halves mounted on top of the double-sided adhesive. Created with BioRender.com Please click here to view a larger version of this figure.
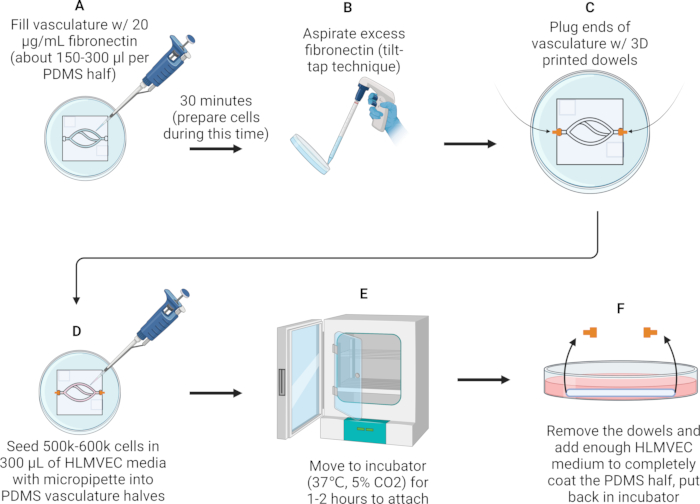
Figure 7: Seeding HLMVECs into PDMS molds. Steps for seeding HLMVECs in PDMS vasculature. (A) Fill the vasculature 150-300 µL with 20 µg/mL fibronectin. (B) Aspirate excess fibronectin using the tilt tap technique. (C) Plug the ends of the PDMS vasculature half with 3D-printed plugs. (D) Seed 500-600K cells in 300 µL media into each vasculature half. (E) Place PDMS halves in the incubator for 1-2 h to facilitate cell attachment. (F) Cover PDMS halves with media and removing plugs. Created with BioRender.com Please click here to view a larger version of this figure.
5. Assembling and running the flow System
- Perform the flow procedure once the cells in the PDMS vasculature halves are fully confluent, as determined by visual inspection under a microscope.
- Calibrate the peristaltic pump according to the manufacturer's protocol prior to performing an experiment.
- Autoclave all autoclavable components, including the flow tubing, tubing connectors, syringe reservoir, and rubber stopper.
- Submerge the acrylic blocks, screws, plugs, 1-inch-long Masterflex L/S 16 tubing pieces, and 15 mm Petri dish plate lid in 70% ethanol for 15 min and UV treat for 20 min in a BSC, flipping halfway through.
- Once all other equipment and materials are sterilized, bring the PDMS vasculature halves into the BSC.
- Aspirate the HLMVEC media from the Petri dish containing the vasculature halves (Figure 8A,B).
- Place the PDMS halves in the two polycarbonate blocks, ensuring they are aligned (Figure 8C).
- Apply silicone sealant to the ends of the vasculature, where the tubing will be attached to the PDMS halves, and place the inch-long tubing in the two ends of the bottomvasculature (Figure 8D).
- Flip the top acrylic block (containing the top half of the PDMS vasculature) onto the bottom acrylic block (containing the bottom half of the PDMS vasculature) (Figure 8E).
- Bolt the acrylic blocks together with the threaded block on the bottom and plug the free ends of the inch-long tubing's with the 3D-printed plugs (Figure 8F).
- Remove one plug and gently inject 500 µL of HLMVEC culture medium into the vasculature, tilting it to prevent air bubbles, then replace the plug.
- Place the entire assembled chip in the incubator to allow the silicone to cure for 1-2 h.
- Bring the assembled chip and all other sterile materials into the BSC and connect everything to set up the flow system according to Figure 9. Ensure the tubing running through the peristaltic pump to the vasculature inlet is attached to the bottom of the syringe reservoir. This will allow gravity to feed the tubing and reduce air bubbles in the system.
- Gently prime the flow system with HLMVEC media. Using a 50 mL serological pipette, inject 30 mL of media into the top of the syringe reservoir (Figure 10B). Run the peristaltic pump at a low flow rate to fill the tubing. Continue to add media to the reservoir until system is fully primed and all bubbles are removed.
NOTE: Air bubbles may shear cells during flow experiment. - Attach the tubing to the reservoir inlet (from the vascular mold outlet) using a fitting attached to a rubber stopper placed at the top of the reservoir (Figure 10C).
- Detach the flow system from the peristaltic pump and place it onto the metal pan. Gently transport the entire setup from the BSC to the incubator (37 °C, 5% CO2). Feed the tubing to the peristaltic pump through the back of the incubator.
- Reattach the peristaltic pump and set to the desired flow rate to emulate the blood flow rate through the vascular model.
- Start the pump and ensure there are no leaks present. Let the system run for 24 h or the desired duration. Check for leaks periodically.
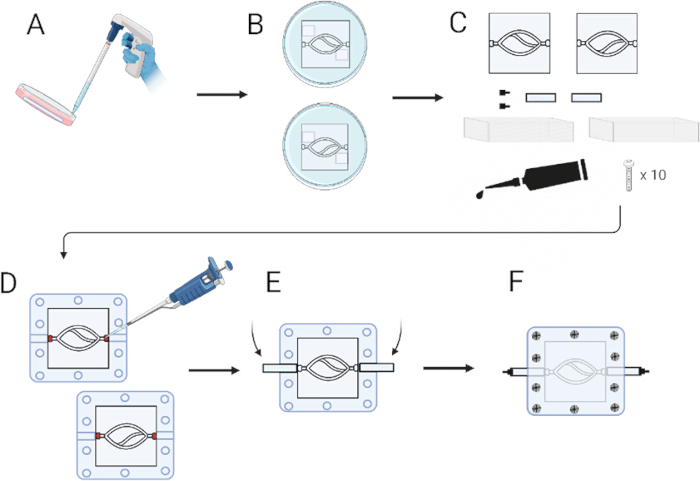
Figure 8: Constructing the flow chip. Constructing the flow chip. (A) Aspirate media from the cell culture plate. (B) PDMS halves after the media has been aspirated. (C) Remove PDMS halves from the plate with other materials needed to build the chip (plug, syringe filter, ½" tubing pieces, silicone sealant, 10x screws, and acrylic blocks). (D) Place the PDMS halves in the acrylic blocks and apply silicone sealant to the locations marked red. (E) Place the tubing in the respective cutouts. (F) Connect the flow chamber halves and attach the plug and syringe filter. Created with BioRender.com Please click here to view a larger version of this figure.
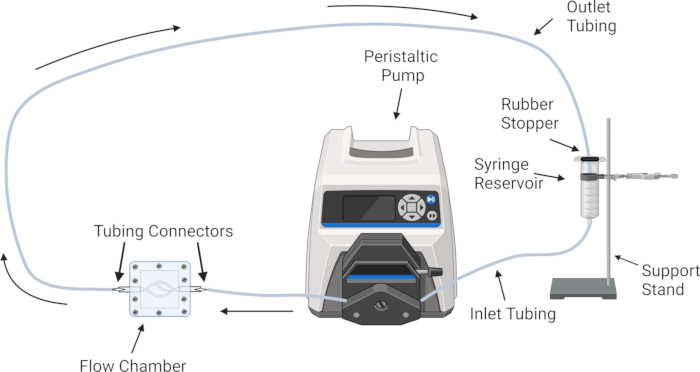
Figure 9: Flow system setup. Set up of the flow system. The complete flow system is constructed utilizing tubing, tubing connectors, a peristaltic pump, a syringe reservoir, a support stand, and the flow chip. Created with BioRender.com Please click here to view a larger version of this figure.
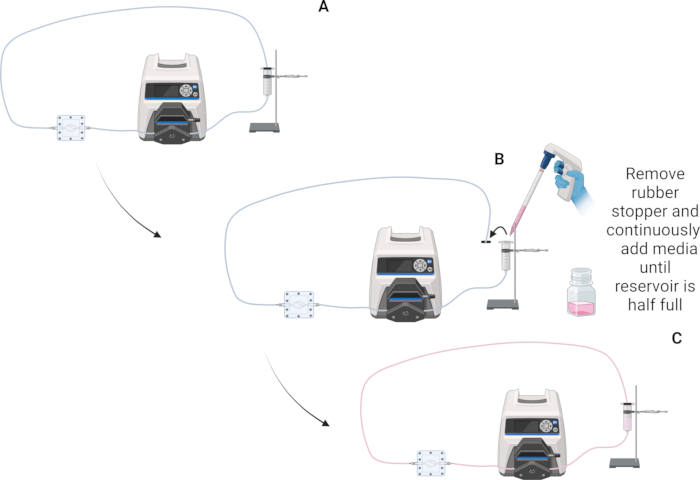
Figure 10: Flow system priming. Priming the flow system with media. (A) Simple setup of the flow system without media. (B) The rubber stopper removed from the syringe reservoir, and media is continuously added until the tubing is filled and there is 20-30 mL of excess media in the reservoir. (C) Flow system primed with HLMVEC media. Created with BioRender.com Please click here to view a larger version of this figure.
6. Fixing and staining
- Wash each PDMS vasculature half in PBS for 5 mins. Add enough to submerge the whole vascular section.
- Aspirate the PBS from the vasculature by tilting the plate and allowing the PBS to run off, then vacuum aspirate the run-off.
- Add 600 µL of 4% paraformaldehyde (PFA) in PBS to each vascular half and incubate at room temperature (RT) for 20 minutes.
- Aspirate the PFA solution into a proper waste container using the method in step 2.
- Wash fixed cells 3x in PBS for 5 min each using the procedure in step 2.
NOTE: Dispose of each of these washes into a proper waste container for formaldehyde. - Plug the ends of the PDMS vasculature halves with the clean 3D printed plugs.
- Prepare 3% bovine serum albumin (BSA) in PBS for blocking.
- Fill vascular halves with 600 µL of blocking solution and incubate for 30 min at RT.
- Remove plugs and aspirate blocking solution.
- Prepare 1:200 dilution of wheat germ agglutinin (WGA) lectin with a conjugated biotin (primary antibody) in 3% BSA solution to stain GCX9.
- Return plugs to plug the ends of the vasculature and add 500 µL of primary antibody solution to each vascular half.
- Incubate the samples at room temperature for 1 h.
- Aspirate the primary antibody gently following the previously used technique.
- Wash 3 times with PBS for 5 min each.
- Prepare 1:500 dilution of WGA streptavidin conjugate (secondary antibody) in 3% BSA solution.
- Return plugs to plug the ends of the vasculature and add 500 µL of secondary antibody solution to each vascular half.
- Repeat steps 6.12-6.14.
- Add DAPI mounting medium to the vascular surface by dispensing 30 µL drops at intervals to completely fill the vasculature.
- Place glass coverslips on the PDMS to cover the vascular channels.
- Seal the coverslip edges using transparent nail polish.
- Cover plates with tin foil and store at 4 °C until imaging.
7. Imaging
- Power on the microscope and open the viewing application on the connected computer.
- Open the microscope and raise the light. Attach the proper platform to fit the samples (versatile Petri dish holder).
- Place a sample on the dish holder within the microscope with the area of interest centered above the objective.
- Lower the light and close the microscope lid.
- On the microscope software, select the Capture still image option.
- Choose the specimen type, use versatile.
- Select the appropriate objective in the lens section for best visualization.
- In the microscope software, adjust the objective position to align with a region of interest (ROI).
- Select autofocus, and the cells should come roughly into focus.
- Manually adjust the focus to fully clarify the image.
- Adjust the brightness and exposure to visualize the cells more clearly.
- Turn on multi-color and color in the software.
- In the CH settings, turn on CH1 Floor DAPI and CH2 Floor GFP.
- Adjust the brightness of each channel separately to clearly visualize the images.
- Select Z-Stack in the microscope software.
- Adjust the focus to the highest plane to image and select set to set the upper limit
- Adjust the focus to the lowest plane to image and select set to set the lower limit
- Select a slice thickness as desired and press Start Capture to take the image.
NOTE: These images will also be output to microscope analysis software for further modification.
Access restricted. Please log in or start a trial to view this content.
Results
The results from the fluid simulation laminar flow steady state study showed an increase in shear stress in certain bifurcations in the pneumonectomy models when compared to the control model, shown in Figure 11. Visualized in step 2.8 of the protocol, the red areas denote areas of high shear stress, while the blue areas show areas of low shear stress.
Access restricted. Please log in or start a trial to view this content.
Discussion
Vascular modeling is an important new field for exploration. The successful creation of an accurate vascular model holds great promise for advancing the field of tissue engineering and drug development. This article outlines a novel method for generating an OOC vascular system that can be utilized to emulate a pneumonectomy or any other vascular system or geometry to study a potential link between GCX impairment and post-pneumonectomy complications. On a broader scale, this methodology can also be applicable to emulate o...
Access restricted. Please log in or start a trial to view this content.
Disclosures
The authors declare no conflicts of interest.
Acknowledgements
The authors would like to express our deepest gratitude to the Worcester Polytechnic Institute Biomedical Engineering Department for their support and guidance. We would like to provide a special thanks to Megan Ouellette, John Martel, and Sudish Vengat for their collaborative efforts and innovative ideas that greatly enhanced the quality and viability of this research. In addition, we would like to thank Samantha Cocchiaro, and Udaya Rattan for their in-lab contributions and their essential support and assistance.
Access restricted. Please log in or start a trial to view this content.
Materials
| Name | Company | Catalog Number | Comments |
|---|---|---|---|
| #8-32 x 3/4 in. Combo Round Head Zinc Plated Machine Screw (8-Pack) | Everbilt | 204274613 | - |
| 0.25% EDTA-Trypsin | ThermoFisher Scientific | 25200056 | - |
| 15mL Conical Sterile Polypropylene Centrifuge Tubes | Thermo Scientific | 12-565-269 | - |
| 35x10mm Dish, Nunclon Delta | Thermo Scientific | 153066 | - |
| 50mL Conical Sterile Polypropylene Centrifuge Tubes | Thermo Scientific | 12-565-271 | - |
| Assorted Rubber Stoppers | Fisherbrand | 14-132 | |
| BioLite Cell Culture Treated Flasks (25cm^2) | Thermo Scientific | 12-556-009 | - |
| BioLite Cell Culture Treated Flasks (75cm^2) | Thermo Scientific | 12-556-010 | - |
| COMSOL Multiphysics | COMSOL | N/A | - |
| Double Sided adhesive | 3M | 16758005 | - |
| Epredia Richard-Allan Scientific Cover Glass | Thermo Scientific | 22-050-218 | - |
| Fetal Bovine Serum | ThermoFisher Scientific | A5256701 | - |
| Fibronectin | ThermoFisher Scientific | 33016015 | 20 μg/mL dilution |
| Fisherbrand Isotemp Digital-Control Water Baths: Model 210 | Fisherbrand | 15-462-10Q | - |
| Fisherbrand Sterile Syringe (60mL) | Fisherbrand | 14-955-461 | - |
| Human Lung Microvascular Endothelial Cells | Sigma Aldrich | 540-05A | - |
| Keyence BZX810 Fluorescent Microscope | Keyence | N/A | - |
| Krayden Dow Sylgard 184 Silicone Elastometer Kit. Clear, (1.1LB) | Dow | 4019862 | - |
| Marga Cipta cast acrylic sheet 1/2' thick, 48x96' | Marga Cipta | N/A | - |
| Masterflex L/S Easy-Load II Pump Head | MasterFlex | 77200-50 | |
| Masterflex L/S Precision Pump Tubing, Platinum-Cured Silicone, L/S 16; 25 ft | MasterFlex | 96410-16 | - |
| Masterflex L/S Standard Peristaltic Pump | Masterflex | 07522-20 | |
| Micropipette 0.2 to 2 μL | Fisherbrand | FBE00002 | - |
| Micropipette 10 to 100 μL | Fisherbrand | FBE00100 | - |
| Micropipette 100 to 1000 μL | Fisherbrand | FBE01000 | - |
| Micropipette 5 to 50 μL | Fisherbrand | FBE00050 | - |
| Microvascular Endothelial Cell Growth Medium (500ml) | Sigma - Aldrich | 111-500 | - |
| Nalgene Sterile Syringe Filters | Thermo Scientific | 725-2520 | - |
| Nikon Eclipse TS-100 Fluorescent Microscope | Nikon | NI-TS100 | |
| Phosphate-buffered saline (DPBS, 10X), Dulbecco's formula | Thermo Scientific | J61917.K3 | - |
| Prusament PLA Prusa Galaxy Black 1kg | Prusa | PRM-PLA-GLX-1000 | - |
| Rebel Hybrid Microscope, Upright and Inverted, Discover Echo | ECHO | 76376-746 | - |
| Silicone Sealant | Loctite | 908570 | - |
| SolidWorks | Dassault Systemes | N/A | |
| Sterile Polystyrene Disposable Serological Pipets with Magnifier Stripe (10mL) | Fisherbrand | 13-678-11E | - |
| Sterile Polystyrene Disposable Serological Pipets with Magnifier Stripe (25mL) | Fisherbrand | 13-678-11 | - |
| Sterile Polystyrene Disposable Serological Pipets with Magnifier Stripe (50mL) | Fisherbrand | 13-678-11F | - |
| Sterile Polystyrene Disposable Serological Pipets with Magnifier Stripe (5mL) | Fisherbrand | 13-678-11D | - |
| Streptavidin, Alexa Fluor 488 Conjugate | Invitrogen | S32354 | |
| Streptavidin, Alexa Fluor 488 Conjugate | Invitrogen | S32354 | - |
| Syringe resevoir | BD | 300865 | |
| Thermo Scientific Alfa Aesar 1LT Albumin, Bovine, Fraction V, 35% soln., Reagent Grade, Fatty Acid Free, with azide as preservati | Thermo Scientific | N12H004 | - |
| Tubing Connectors | Fisherbrand | 01-000-161 | - |
| VECTASHIELD Antifade Mounting Medium with DAPI | Vectashield | H-1200-10 | - |
| VWR Water Jacketed CO2 Incubator | Avantar | 10810-744 | - |
| WGA Biotinylated Antibody | Vector | B-1025 | - |
References
- Sharma, S., Beshara, M., Bora, V. Pneumonectomy. , StatPearls Publishing LLC. (2024).
- Grapatsas, K., et al. Pneumonectomy for primary lung tumors and pulmonary metastases: a comprehensive study of postoperative morbidity, early mortality, and preoperative clinical prognostic factors. Curr. Oncol. 30 (11), 9458-9474 (2023).
- Lucas, G. F. N., James, M. I., David, R. J., Victor, E. L. Chapter 24. Topics in thoracic surgery. Guerreiro Cardoso, P. F. , IntechOpen. (2012).
- Sentenac, P., et al. Pulmonary hypertension after pneumonectomy: a preclinical model in rats and human pulmonary endothelial cells. Eur. J. Cardiothorac. Surg. 59 (1), 147-154 (2020).
- Russo, T. A., Banuth, A. M. M., Nader, H. B., Dreyfuss, J. L. Altered shear stress on endothelial cells leads to remodeling of extracellular matrix and induction of angiogenesis. PLoS One. 15 (11), e0241040(2020).
- Milusev, A., Rieben, R., Sorvillo, N. The endothelial glycocalyx: a possible therapeutic target in cardiovascular disorders. Front. Cardiovasc. Med. 9, e897087(2022).
- Vittum, Z., Cocchiaro, S., Mensah, S. A. Basal endothelial glycocalyx's response to shear stress: a review of structure, function, and clinical implications. Front. Cell Dev. Biol. 12, e1371769(2024).
- Villalba, N., Baby, S., Yuan, S. Y. The endothelial glycocalyx as a double-edged sword in microvascular homeostasis and pathogenesis. Front. Cell Dev. Biol. 9, e711003(2021).
- Harding, I. C., et al. Endothelial barrier reinforcement relies on flow-regulated glycocalyx, a potential therapeutic target. Biorheology. 56 (2-3), 131-149 (2019).
- Alphonsus, C. S., Rodseth, R. N. The endothelial glycocalyx: a review of the vascular barrier. Anaesthesia. 69 (7), 777-784 (2014).
- Möckl, L. The emerging role of the mammalian glycocalyx in functional membrane organization and immune system regulation. Front. Cell Dev. Biol. 8, e00253(2020).
- Nian, K., Harding, I. C., Herman, I. M., Ebong, E. E. Blood-brain barrier damage in ischemic stroke and its regulation by endothelial mechanotransduction. Front. Physiol. 11, 605398(2020).
- Dietz, N. M. Pathophysiology of postpneumonectomy pulmonary edema. Semin. Cardiothorac. Vasc. Anesth. 4 (1), 31-35 (2000).
- Bozlar, U., et al. Pulmonary artery diameters measured by multidetector-row computed tomography in healthy adults. Acta Radiol. 48 (10), 1086-1091 (2007).
- Schindelin, J., et al. Fiji: an open-source platform for biological-image analysis. Nat Methods. 9 (7), 676-682 (2012).
- Kataoka, H., et al. Fluorescent imaging of endothelial glycocalyx layer with wheat germ agglutinin using intravital microscopy. Microsc. Res. Tech. 79, 31-37 (2016).
- Wood, K. M., Stone, G. M., Peppas, N. A. Wheat germ agglutinin functionalized complexation hydrogels for oral insulin delivery. Biomacromolecules. 9 (4), 1293-1298 (2008).
- Tarnowski, B. I., Spinale, F. G., Nicholson, J. H. DAPI as a useful stain for nuclear quantitation. Biotech. Histochem. 66 (6), 297-302 (1991).
- Emde, B., Heinen, A., Gödecke, A., Bottermann, K. Wheat germ agglutinin staining as a suitable method for detection and quantification of fibrosis in cardiac tissue after myocardial infarction. Eur. J. Histochem. 58 (4), 2448(2014).
- Hu, Z., Cano, I., D'Amore, P. A. Update on the role of the endothelial glycocalyx in angiogenesis and vascular inflammation. Front. Cell Dev. Biol. 9, e734276(2021).
- Choi, J., Lee, E. J., Jang, W. B., Kwon, S. M. Development of biocompatible 3D-printed artificial blood vessels through multidimensional approaches. J. Funct. Biomater. 14 (10), e14100497(2023).
- Fallon, M. E., Mathews, R., Hinds, M. T. In vitro flow chamber design for the study of endothelial cell (patho)physiology. J. Biomech. Eng. 144 (2), e4051765(2021).
- Basehore, S., Garcia, J., Clyne, A. M. The science, etiology and mechanobiology of diabetes and its complications. Gefen, A. , Acad. Press. 291-312 (2021).
Access restricted. Please log in or start a trial to view this content.
Reprints and Permissions
