This defined protocol describes a real-time high-throughput microscopy approach to visualize and quantify human neutrophil extracellular trap (NET) release in vitro. The reproducible method allows investigation of the characteristics and kinetics of NET release upon stimulation with distinct NETosis inducers and enables assessment of the pharmacology of NETosis antagonists.
Method Article
Real-Time, High-Throughput Microscopic Quantification of Human Neutrophil Extracellular Trap Release and Assessing the Pharmacology of Antagonists
In This Article
Summary
Abstract
Neutrophils play an important role in innate immune defense by using several strategies, including the release of neutrophil extracellular traps (NETs) in a process referred to as NETosis. However, in the past two decades, it has become clear that the accumulation of NETs in tissues contributes to the pathophysiology of multiple inflammatory and autoimmune diseases. Therefore, interest in the development of NETosis antagonists has risen. Variable and non-standardized methods to detect and analyze NETosis were developed concomitantly, each with its own advantages and limitations. Here, we describe a real-time microscopy method for the quantification of human NET release, allowing to study NETosis as well as NET inhibition in a high-throughput manner. The surface area-based semi-automated analysis recognizes NETs and distinguishes them from non-netting activated neutrophils. We demonstrate that the non-physiological NETosis inducers, calcium ionophore and phorbol-12-myristate-13-acetate (PMA), trigger the release of NETs with different characteristics and kinetics. Furthermore, we show that this approach allows studying NET release in response to disease-relevant stimuli, including immune complexes, N-Formylmethionine-leucyl-phenylalanine (fMLF), monosodium urate crystals, and calcium pyrophosphate crystals. To exemplify the utility of this method to study NETosis antagonists, we used CIT-013, a first-in-class monoclonal antibody inhibitor of NET release. CIT-013 targets citrullinated histone H2A and H4 and efficiently inhibits NET release with an IC50 of 4.6 nM. Other anti-histone antibodies tested lacked this NETosis-inhibitory capacity. Altogether, we demonstrate that this protocol enables specific, reliable, and reproducible high-throughput quantification of NETs, enhancing the study of NET release characteristics, kinetics, and pharmacology of NETosis antagonists.
Introduction
Neutrophils are abundantly present in blood and migrate to tissue upon infection or inflammation. They play an important role in the innate immune defense by using extensive weaponry to protect the host against microbes. Neutrophils kill pathogens via phagocytosis, degranulation, generation of reactive oxygen species (ROS), and the release of decondensed chromatin termed neutrophil extracellular traps (NETs) by a process called NETosis1. NETs are extracellular structures of chromatin decorated with, amongst others, granular proteins and calprotectin2,3, and are released upon stimulation with a broad spectrum of molecules4. NETosis can be broadly categorized into two main pathways: NADPH oxidase dependent or independent5,6,7. In addition, arginine citrullination of N-terminal histone tails by peptidyl arginine deiminase 4 (PAD4) has been closely linked to NETosis and promotes chromatin decondensation which ultimately leads to expulsion of decondensed chromatin into the extracellular environment.
Although NET release is involved in pathogen elimination, numerous studies have shown that abnormal and prolonged NET release is linked to the development of various inflammatory disorders, including acute lung injury8, rheumatoid arthritis (RA)9, vasculitis10, and hidradenitis suppurativa11. The detrimental role of NETs in disease is multifaceted since NETs are proinflammatory, are a source of autoantigens, are cytotoxic to surrounding tissues, trigger immunothrombosis, and promote osteoclast differentiation and bone erosion9,12,13. Pharmacological inhibition of the NETosis pathway by small molecule PAD4 inhibitors demonstrates that NETosis-targeting therapeutics have potential as treatments for diseases in which NET accumulation is an important driver of the pathogenesis14. Instead of targeting the PAD4 enzyme, we used a first-in-class NETosis inhibiting humanized anti-citrullinated histone monoclonal antibody, CIT-013, which specifically binds to citrullinated histones H2A and H415. CIT-013 has a unique dual mechanism of action by inhibiting NET release and enhancing macrophage-mediated NET phagocytosis16. CIT-013 and precursor molecules have shown therapeutic efficacy in multiple mouse models of NET-associated inflammation17.
To study NET release, different methods have been developed over the years, such as but not limited to 1) DNA detection using a plasma membrane impermeable DNA tracer in combination with an immunofluorescent plate reader, 2) enzyme-linked immunosorbent assay (ELISA)-based detection of DNA and DNA-complexed with NET-specific proteins in supernatants, 3) co-localization of NET associated molecules with extracellular DNA via immunohistochemistry, and 4) flow cytometry approaches to detect netting neutrophils. All these methods have their own advantages and limitations. We developed a real-time high-throughput approach for microscopic quantification of human NET release, which uses a plasma membrane impermeable DNA dye16,18. The described method allows investigation of NETosis kinetics and characteristics in an easy, reliable, and reproducible manner and enables assessment of the pharmacology of NETosis antagonists such as CIT-013.
Protocol
All blood donors gave informed consent in accordance with the Declaration of Helsinki, and the study was performed as per the Citryll ethical guidelines for human research.
NOTE: All activities with human blood and isolated neutrophils need to be performed under sterile conditions in a laminar flow cabinet. When brake and acceleration settings for centrifugation are not mentioned in the protocol, they can be considered at maximum.
1. Neutrophil isolation from blood
- Collect peripheral blood from healthy volunteers in lithium-heparin tubes and transfer blood to a fresh 50 mL tube.
- Rinse lithium-heparin tubes with 1x DPBS and transfer to the same 50 mL tube as blood was transferred to. Ensure that the final blood-to-DPBS ratio is 1:1. Mix blood and DPBS by pipetting to get a homogeneous solution.
- Add 13 mL of density gradient solution to another fresh 50 mL tube and slowly add (with a 25 mL pipet) the 1:1 diluted blood on top of the density gradient solution up to a maximum of 50 mL.
- Centrifuge at 400 x g and room temperature (RT) for 40 min with minimal acceleration and brake.
NOTE: Layers are formed. Layers from top to bottom are as follows: 1. plasma; 2. peripheral blood mononuclear cells (PBMCs); 3. density gradient solution; 4. erythrocytes/neutrophils. - First, discard the plasma with a 10 mL pipet and then discard PBMCs and the density gradient solution layer with a plastic Pasteur pipet as much as possible without disturbing the erythrocyte/neutrophil layer.
- Gently resuspend the erythrocyte/neutrophil layer by shaking and resuspend with a 25 mL pipet in 15 mL of 1x DPBS.
- Add 25 mL of 6% Dextran/0.9% NaCl solution, mix by ten times inverting the tube, and set the tube upright for 25 min at RT.
NOTE: Layers are formed. Layers from top to bottom are as follows: 1. Neutrophils; 2 erythrocytes. - Transfer the neutrophil layer to a fresh 50 mL tube with a 10 mL pipet and centrifuge for 10 min at 500 x g and RT.
NOTE: Be careful since the neutrophil pellet still contains some erythrocytes and is not firmly attached to the tube. - Discard the supernatant by decanting and resuspend the cell pellet with a 10 mL pipet in 10 mL of Ammonium-Chloride-Potassium (ACK) lysis buffer (155 mM NH4Cl, 10 mM KHCO3, and 0.1 mM Na2EDTA; pH = 7.2) and then immediately add 40 mL of ACK lysis buffer.
- Incubate at RT while continuously inverting the tube until the solution becomes translucent (this takes 1-5 minutes and may vary for each donor) and centrifuge for 10 min at 350 x g and RT.
- Remove the supernatant and add slowly and dropwise 5 mL of culture medium containing L-glutamine supplemented with 10% (v/v) heat-inactivated fetal bovine serum (FBS), 50 U/mL penicillin, and 50 µg/mL streptomycin (referred to as culture medium 10% hereafter) on top of the neutrophil pellet without bringing the neutrophils in suspension. This will efficiently remove most of the erythrocytes from the neutrophil pellet.
- Gently swirl the 50 mL tube until most of the erythrocytes, present on top of the neutrophil pellet, are resuspended in the culture medium 10%. Subsequently, remove the supernatant by decanting the tube.
- Resuspend the neutrophil pellet in 10 mL of culture medium 10%, and when fully resuspended, add up to 50 mL of culture medium 10%. Centrifuge for 10 min at 350 x g and RT.
- Remove the supernatant and resuspend the cell pellet in 10 mL of culture medium 10%.
2. Neutrophil staining to check for purity by flow cytometry
- To determine the cell concentration, dilute the neutrophil suspension in 0.4% trypan blue solution (ratio 1:1) and count the neutrophils with a bright field cell counter.
NOTE: Other counting methods can be used as well. - Transfer 1 x 10⁵ neutrophils in culture medium 10% to the wells of a V-bottom 96-well plate and centrifuge for 3 min at 400 x g and RT.
- Discard the supernatant and resuspend the cells in 50 µL of 1x DPBS supplemented with 1% (w/v) bovine serum albumin (BSA) and 0.1% (v/v) NaN3 (referred to as fluorescence-activated cell sorting (FACS) buffer hereafter) containing Fc receptor block (50x diluted).
- Incubate for 15 min at RT and add 50 µL of FACS buffer containing 50x diluted APC-Cy7-conjugated mouse anti-human CD45 antibody, 600x diluted PerCP-Cy5.5-conjugated mouse anti-human CD16 antibody, 133x diluted FITC-conjugated mouse anti-human CD66b antibody, and 500x diluted fixable viability dye eFluor 506.
NOTE: CD45 is expressed on leukocytes. CD66b is exclusively expressed in granulocytes. CD16 is highly expressed in neutrophils, lowly expressed in eosinophils, and not expressed in basophils. - Incubate for 30 min at RT in the dark and centrifuge for 3 min at 400 x g and RT.
- Discard the supernatant, resuspend the neutrophils in 175 µL of FACS buffer, and centrifuge for 3 min at 400 x g and RT. Repeat this step once.
- Discard the supernatant and resuspend the neutrophil pellet in 175 µL of FACS buffer. Analyze samples using a flow cytometry system and associated software.
3. Neutrophil purity analysis using flow cytometry analysis software
NOTE: Analysis of flow cytometry data was performed using the flow cytometry analysis software as indicated in the Table of Materials.
- Perform gating according to the following step-by-step procedure.
- Set a time gate in the plot FSC-A vs. Time to select an area with proper cell flow.
- Set a cell gate in the plot SSC-A vs. FSC-A to select cells and exclude debris.
- Set a viable cell gate in the plot FSC-A vs. AmCyan-A to select viable cells.
- Set a leukocyte gate in the plot FSC-A vs. APC-Cy7 to select CD45+ cells.
- Set a neutrophil gate in the plot FITC vs. PerCP-Cy5.5 to distinguish between CD66b+CD16+ (neutrophils), CD66b-CD16+ (eosinophils), and CD66b-CD16- (basophils, monocytes, and lymphocytes).
- Set a single cell gate in the plot FSC-H vs. FSC-A to select single neutrophils.
- Determine neutrophil purity by presenting single neutrophils as the frequency of cells (in the cell gate).
NOTE: To proceed, the neutrophil purity needs to exceed 85%.
4. Live imaging microscopy
NOTE: This assay is optimized for multiple 96-well imaging plates and various NETosis stimuli and antagonists. The protocol below describes a general view of the approach, which can be specified using the tables included.
- Prepare a 0.001% poly-L-lysine solution by diluting 0.01% poly-L-lysine in sterile H2O with a ratio of 1:10.
- Add 0.001% poly-L-lysine solution to each well and incubate at least 1 h at 37 °C.
NOTE: Volume per well depends on the 96-well imaging plate (Table 1). - Wash the wells 3 times with 200 µL of DPBS to remove excess poly-L-lysine. Perform all steps in Laminar flow cabinet. Remove the lid of the plate and air dry the wells by opening the plate in the laminar flow cabinet until dry (approximately 1 h).
- Calculate the number of neutrophils required for the experiment and transfer a surplus to a 15 mL tube. Centrifuge for 10 min at 350 x g and RT.
NOTE: The quantity of neutrophils in each well varies based on the type of 96-well imaging plate (Table 1). The cell density is optimized to allow good separation of individual cells, which is required for proper analysis. If neutrophil density is too high, cells and NETs will overlap with adjacent cells and NETs, which affects the quality of the analysis. - Discard the supernatant and resuspend the neutrophils in a culture medium without phenol red supplemented with 2% (v/v) FBS, 50 U/mL penicillin, and 50 µg/mL streptomycin, 10 mM HEPES, and 1 mM CaCl2 (referred to as NET assay buffer hereafter).
- Prepare the following work solutions.
- Prepare 80 nM DNA dye in NET assay buffer.
- Prepare NETosis stimuli in NET assay buffer.
- Prepare NETosis antagonists in NET assay buffer.
NOTE: Be aware the concentrations of the above-described work solutions are 4 times the final concentration needed in the well. Recommended concentrations of NETosis stimuli and NETosis antagonists vary (Table 2 and Table 3).
- Add 4x concentrated DNA dye in NET assay buffer to each well.
- Add 4x concentrated NETosis stimuli in NET assay buffer to the corresponding wells, and add NET assay buffer only to wells without stimulus or to wells containing coated immune complexes (cIC; protocol in table 2).
- Add 4x concentrated NETosis antagonists in NET assay buffer to the corresponding wells. Add NET assay buffer only to wells without an antagonist.
- Add neutrophil suspension to each well.
NOTE: The volume of 4x concentrated DNA dye, 4x concentrated NETosis stimuli in NET assay buffer, 4x concentrated NETosis antagonist in NET assay buffer, the number of neutrophils, and the volume of neutrophil suspension per well depends on the 96-well imaging plate (Table 1). Avoid the formation of bubbles when pipetting. - Centrifuge the plate for 2 min at 100 x g and RT and insert the 96-well imaging plate in the live cell microscopy analysis system placed in an incubator at 37 °C and 5% CO2.
NOTE: Condensation can develop on the bottom of the 96-well imaging plate during the first minute of incubation.This should be removed with a tissue.
5. Setting live cell microscopy analysis system software for the acquisition
NOTE: Phase contrast and immunofluorescence images were acquired by a live cell microscopy analysis system controlled by its analysis software.
- Open the live cell microscopy analysis system software and click Connect to device. Enter username and password. Click Schedule to acquire and click the plus button (Launch add vessel). Subsequently, select Scan on Schedule and click Next.
- To create a new vessel from scratch, select New in the Create Vessel section and click Next. Select Standard in the Scan Type section and click Next.
- Select the following scan settings and click Next: Cell-by-cell: None; Image Channels: Phase contrast and Green (acquisition time 100 ms); Objective: 20x.
- Select the appropriate type of vessel to scan in the Vessel Selection section and click Next.
- If using a 96-well plate #1, select Corning, plate, 96, N/A, 3603, 96-well Corning (Blk/Wht), Microplates.
- If using a 96-well plate #2, select Nunc, Plate, 96, N/A, 152028, 96-well Nunc opt bottom (Blk/Wht), Microplates.
- Specify the location of the vessel in the Drawer and click Next. In the Scan Pattern section, select the wells that need to be scanned, select the number of images per well (scan 4 images per well to get a representative overview) and click Next.
NOTE: Do not select empty wells because it will affect the autofocus. - Provide information about the vessel by inserting, amongst others, the plate name in the vessel notebook section and click Next. Select Defer analysis until later in the Analysis Setup section and click Next.
- Define the scan schedule for the vessel in the Scan Schedule section. Select Create new schedule with scans at intervals of and select 1 hour. Select Stop scanning and 00:05 hours after the first scan. Click Next and click Add to Schedule when the scanning information is correct.
- When the scanning schedule needs to be edited, double-click on the Scanning Schedule on top of the screen. Right click on the Scanning Schedule and Edit and Adjust as desired. Click the Floppy disk icon to save the scanning schedule.
NOTE: When imaging multiple vessels (plates) in the same experiment, additional vessels can be added to the existing scan schedule by clicking the plus button (Launch add vessel), selecting Scan on Schedule, and clicking Next. Either create a new vessel from scratch (see step 5.2 in this protocol), copy an existing vessel, or use a previously scanned vessel. This results in sequential scanning at the same frequency and settings as the previous plate.
- When the scanning schedule needs to be edited, double-click on the Scanning Schedule on top of the screen. Right click on the Scanning Schedule and Edit and Adjust as desired. Click the Floppy disk icon to save the scanning schedule.
6. Live imaging microscopy NET assay analysis using the live cell microscopy analysis software
NOTE: Live cell microscopy analysis software was used to analyze phase contrast and immunofluorescence images (Table of Materials). When not using this system, similar NET analysis can be performed using a public-domain software package4,18,19,20.
- Open the live cell microscopy analysis software and click Connect to device. Enter username and password and click View recent scans. Open the experiment of choice to analyze by double-clicking the vessel name of the experiment.
- Click Launch analysis and select Create new analysis definition. Click Next.
- Select Basic Analyzer from the analysis type section and click Next. In the Image Channel section, select Green, deselect Phase, and click Next.
- Open the Image Layers window and select Green and deselect Phase. Turn off Autoscale in the Green section and manually set min and max for the green channel to distinguish NETs from the background.
NOTE: Phase contrast can be turned on and off when needed. For example, to determine whether NETs are expelled in the extracellular environment. - Open the Vessel Scan Times window and select the appropriate vessel scan time in which NETs must be present. Select a set of images representing the variability within the experiment (images from positive control wells with NETs and images from negative control wells without NETs). These images will be used to preview and refine the analysis. Click Next.
- Open the Analysis Definition Settings window and start to adjust the analysis settings for the green channel in such a way that the NET structures are outlined without creating false positive or false negative NETs. Use the following settings and click Preview Current or Preview All to apply the settings to the current or all images, respectively.
- For object name, select NETs.
- For segmentation, select No Background Subtraction - Adaptive.
- For threshold GCU, select between 3 and 5 (depending on the experiment).
- For edge split, select ON (between -10 and 0).
- For cleanup, select Hole Fill: 100 µm2 and Adjust size: -1 pixels.
- For filters, select depending on the experiment, but the recommended cut-off values are: Area: >200 µm2, Mean intensity: <24.6, Integrated intensity: >7000.
NOTE: Structures that are selected based on the used settings are outlined with magenta. Hovering with the mouse over these structures will give more information about the parameters of the objects (i.e., area, eccentricity, integrated intensity, and mean intensity), which helps to optimize the analysis related to inclusion or exclusion criteria for NET parameters. Check multiple images (from positive and negative control wells) to test whether the analysis settings are correct.
- When the settings for the NET analysis are correct, click Next. Select the time points and wells to analyze in the scan times and wells section and click Next. Insert the definition name in the save and apply analysis definition section and click Next. Click Finish when the analysis information is verified and correct.
NOTE: When analyzing multiple plates or using analyses from previous experiments, launch analysis and select Copy existing analysis definition or Use existing analysis definition and click Next. Select the appropriate existing analysis definition and click Next. For the subsequent analysis procedure, go to step 6.4 if copy existing analysis definition has been chosen, or step 6.7 when use existing analysis definition has been chosen. - Open the experiment analysis by clicking the analysis within the vessel of interest. Open the Graph Metrics window.
- Click the plus button (Create metric). Data can be presented as percentage NET confluency (the percentage of the image area marked as NET) or percentage netting neutrophils (number of NETs divided by the number of cells).
- When presenting data as a percentage NET confluency, select Area in the Metric section and select Confluence in the Value section. When presenting data as percentage netting neutrophils, select Object Count in the Metric section and select Per Image in the Value section.
- Click OK. Select NETs Area Confluence (%) or NETs Object Count Per Image (Per Image) in the User Defined Metrics section. Select all time points that need to be analyzed in the Select Scans section. Select all wells that need to be analyzed in the Select Wells section and click Export Data.
- Select the following settings in the Graphing Export section.
- Select Show each scan as its own table (columns: 1, 2… rows: A, B…).
- Select Show row and column labels.
- Select All scans in one file and click Browse to adjust the file location and name.
- Select Include experiment details in header.
- Select Break data down into individual images.
- Click Export to export the data as ".txt" file, which can be imported and further analyzed in a spreadsheet.
NOTE: To determine the percentage of netting neutrophils, the number of neutrophils at t = 0 needs to be determined. To do so, continue with the following steps of the protocol. - Go to step 6.1 to start the additional analysis necessary to count the number of neutrophils for images at t = 0.
- In step 6.3, select Phase and deselect Green in the image channel section.
- In step 6.4, select t = 0 in the vessel scan times section.
- In step 6.5, deselect Green, select Phase, and adjust the Phase Channel Settings when needed.
- In step 6.6, add Object Name, select Classic Confluence in the Segmentation section and set segmentation adjustment at 0 (Background), adjust Hole Fill to 100 µm2, and adjust Area to 50 µm2.
- In step 6.7, select t = 0 in the select scans section.
- In step 6.8, open Neutrophil Count Analysis.
- In step 6.9, select Object Count Per Image (Per Image) in the User Defined Metrics section.
- Finally, use the following calculation to generate the percentage of netting neutrophils: (number of NETs / number of neutrophils at t = 0) x 100%.
Results
Real-time high-throughput microscopy, in combination with an impermeable DNA dye allows to study the kinetics, characteristics, and underlying pathways of NETosis and enables the assessment of potential inhibitors of NET release. With this approach, NETs were defined as structures positive for DNA dye with a significantly larger surface area compared to the surface area of healthy neutrophils (Figure 1A), indicating that chromatin has been expelled into the extracellular environment18. The surface area-based analysis allowed us to distinguish between NETs and activated neutrophils with compromised plasma membrane integrity, showing bright intracellular DNA staining (Figure 1A).
Calcium ionophore (A23187) and PMA are commonly used to induce NETosis in vitro. Despite being non-physiological stimuli, they are valuable because they activate distinct NETosis pathways and ensure consistent NETosis induction with low variability between donors. A23187 triggers calcium influx, leading to PAD4 activation and release of NETs rich in citrullinated histones, while PMA activates the NADPH oxidase complex, resulting in reactive oxygen species (ROS) production and the subsequent release of NETs with low levels of citrullinated histones5,16,21. The speed and magnitude of the NETosis response depend on the concentration of each stimulus (Figure 1B,C), with A23187 inducing faster NETosis, and PMA resulting in a higher proportion of neutrophils releasing NETs (Figure 1D-F). NETs resulting from A23187 stimulation (Figure 1D; red arrow) were distinct from PMA-induced NETs (Figure 1D; yellow arrow) by being more diffuse beyond the neutrophil plasma membrane, while PMA-induced NETs remained more adjacent to the neutrophil plasma membrane. In addition, A23187 stimulation resulted in permeable non-netting DNA dye-positive neutrophils (Figure 1D; blue arrow), which did not expel their DNA into the extracellular space. The detection of permeable non-netting DNA dye-positive neutrophils was dependent upon the concentration of A23187 (Figure 1G) and almost absent regardless of the concentration of PMA used to stimulate NETosis (Figure 1D,H). Besides using the non-physiological NETosis stimuli A23187 and PMA, this assay is also suitable for studying disease-relevant triggers of NETosis. As an example, neutrophils activated with soluble immune complexes (sIC) or crystals present in calcium pyrophosphate disposition disease (CPPD) showed significantly increased NET release compared to no stimulus. A trend towards elevated NET levels was observed when neutrophils were activated with coated immune complexes (cIC), fMLP, and monosodium urate (MSU) crystals (Figure 1I); however, for these stimuli, we observed considerable donor-to-donor variation.
Pharmacological inhibition of the NETosis pathway and NETosis-associated enzymes has shown that NETosis-targeting therapeutics could be effective treatments for diseases where NET accumulation significantly drives pathology14,17,22,23,24. This real-time microscopy NET assay is an easy, reliable, and reproducible approach to studying NETosis antagonists in a high-throughput manner. To exemplify this, we have used a first-in-class humanized monoclonal antibody, CIT-013, that targets citrullinated histone H2A and H4 with high affinity15,16. A23187 activates the NETosis pathway, resulting in NETs containing citrullinated histones which are subsequently targeted by CIT-013 to perform its NETosis inhibitory function16. Indeed, NET release in response to A23187 was completely inhibited by CIT-013 (Figure 2A and Supplementary Video 1), with an IC50 of 4.6 nM (Figure 2B). The NETosis-inhibitory capacity of CIT-013 is unique since other commercial antibodies targeting different (non-) citrullinated histones were not able to inhibit NET release (Figure 2C).
Previously, we have shown that a highly similar precursor molecule of CIT-013 (differing two amino acids but binding similar epitopes with equal affinity) blocks NETosis in response to physiological stimuli such as activated platelets, gout synovial fluid as well as RA synovial fluid17. Here, we show that NET release induced by sIC can be inhibited by CIT-013 (Figure 2D). The therapeutic relevance of inhibiting NETosis induced by this stimulus is highlighted by SLE, RA, and other autoimmune diseases, where autoantibodies in serum or synovial fluid support the formation of IC, which triggers NETosis25,26.
Together, these data demonstrate that this real-time high-throughput microscopy approach is suitable for studying the kinetics and characteristics of NET release and allows the study of inhibitors of NETosis. Although this method has been optimized for the use of human neutrophils, with modifications it might also be suitable to study neutrophils from other species. The data generated with this assay is a cornerstone of the rationale for CIT-013 as a potent and efficacious therapy for NET-driven diseases.

Figure 1: Real-time high-throughput microscopy for studying NET release. Neutrophils isolated from the blood of healthy volunteers were stimulated with A23187 or PMA to trigger the NETosis pathway. NET release was visualized with real-time high-throughput microscopy using a plasma membrane impermeable DNA dye and quantified based on the surface area with the live cell microscopy analysis system software. (A) Analysis of the surface area of non-stimulated healthy neutrophils (gray), extracellular NETs, and permeable non-netting neutrophils with intracellular DNA staining (green). (B,C) Quantification of NET release over time from neutrophils stimulated with the indicated A23187 or PMA concentrations (n = 2). (D) Representative images of NET release in response to A23187 (red arrows) and PMA (yellow arrows) at different time points. Examples of permeable non-netting neutrophils are indicated with blue arrows. (E) Quantification of NET release over time presented as a percentage of NET confluency (n = 5). Statistics were performed on t = 240 min. (F) Quantification of NET release over time presented as a percentage of netting neutrophils (n = 2). (G, H) Quantification of permeable non-netting neutrophils over time from neutrophils that have been stimulated with the indicated A23187 or PMA concentrations (n = 2). (I) Quantification of NET release at t = 240 min induced by soluble immune complexes (sIC), coated IC (cIC), fMLP, monosodium urate (MSU) crystals, and crystals present in calcium pyrophosphate disposition disease (CPPD) (n = 8-28). Results are reported as mean ± standard error of the mean. **P < 0.01, and ****P < 0.0001, Repeated measures one-way ANOVA with Dunnett's multiple comparisons test (B), Kruskal-Wallis test with Dunn's multiple comparisons test (I). Panels A-F has been modified with permission from van der Linden et al.16. Please click here to view a larger version of this figure.
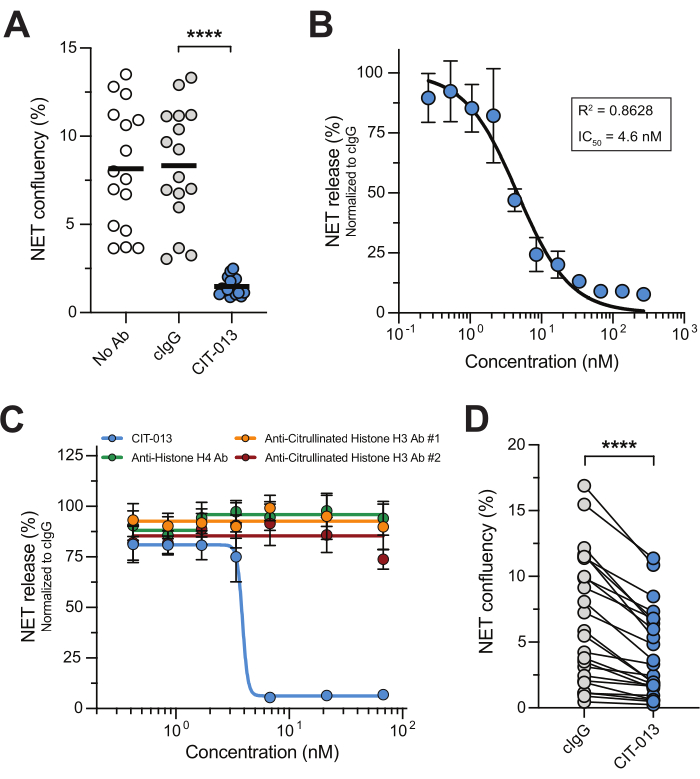
Figure 2: CIT-013 inhibits NET release. (A) Quantification of A23187-induced NET release at t = 240 min in the absence (No Ab) or presence of CIT-013 or isotype control antibody (cIgG). (B) Dose-dependent inhibition of A23187-induced NET release with CIT-013 at t = 240 min (n = 3). Data were normalized to cIgG (set as 100% NET release). (C) Quantification of A23187-induced NET release at t = 240 min in the presence of indicated concentrations of CIT-013, anti-histone H4 antibody, anti-citrullinated histone H3 antibody #1, or anti-citrullinated histone H3 antibody #2 (n = 6). (D) Quantification of NET release at t = 240 min induced by soluble immune complexes (ICs) in the presence of CIT-013 or cIgG. Results are reported as mean ± standard error of the mean. ****P < 0.0001, Repeated measures one-way ANOVA with Tukey's multiple comparisons (A) or two-tailed Wilcoxon matched-pairs signed rank test (D). Panels A, B, and D have been modified with permission from van der Linden et al.16. Please click here to view a larger version of this figure.
| 96-well plate #1 | 96-well plate #2 | |
| Volume 0.001% poly-L-lysine solution per well | 50 µL | 100 µL |
| Volume of neutrophil suspension per well | 50 µL | 87.5 µL |
| Number of neutrophils per well | 2 x 10⁴ cells | 3.5 x 10⁴ cells |
| Volume 4x concentrated (= 80 nM) DNA dye in NET assay buffer per well | 50 µL | 87.5 µL |
| Volume 4x concentrated NETosis stimuli in NET assay buffer per well | 50 µL | 87.5 µL |
| Volume 4x concentrated NETosis antagonists in NET assay buffer per well | 50 µL | 87.5 µL |
Table 1: Volumes and cell numbers optimized for different 96-well imaging plates.
| Concentration work solution (4x concentrated) | Final concentration | |
| Calcium ionophore (A23187) | 50 µM | 12.5 µM |
| PMA | 16 nM | 4 nM |
| fMLP | 4 µM | 1 µM |
| Monosodium urate (MSU) crystals | 400 µg/mL | 100 µg/mL |
| Calcium pyrophosphate disposition disease (CPPD) crystals | 400 µg/mL | 100 µg/mL |
| Soluble immune complexes (sIC) | 1. Add 5 µg/mL human serum albumin (HSA) in DPBS to 282.5 µg/mL polyclonal rabbit anti-HSA antibody in DPBS. | |
| 2. Incubate for at least 90 min at 37 °C. | ||
| 3. Homogenize by vortexing and add 50 µL sIC solution to the corresponding wells. | ||
| Coated immune complexes (cIC) | 1. Add 10 µg/mL HSA in DPBS in the corresponding wells of the 96-well plate. | |
| 2. Incubate overnight at 4 °C. | ||
| 3. Wash the wells 3 times with 200 µL 0.05% Tween-20 in DPBS (referred to as PBS/0.05%Tween hereafter). | ||
| 4. Block the wells with 200 µL 1% (w/v) bovine serum albumin in PBS/0.05% Tween (referred to as blocking buffer hereafter). | ||
| 5. Incubate for 120 min at room temperature and gentle agitation (400 rpm). | ||
| 6. Wash the wells 3 times with 200 µL PBS/0.05% Tween. | ||
| 7. Add 50 µL polyclonal rabbit anti-HSA antibody in blocking buffer to the corresponding wells. | ||
| 8. Incubate for 60 min at room temperature and gentle agitation (400 rpm). | ||
| 9. Wash the wells 3 times with 200 µL PBS/0.05% Tween. | ||
| 10. Finally, wash the wells 3 times with 200 µL DPBS. Wells are now ready for step 4.7 in the protocol. | ||
Table 2: Recommended concentrations for NETosis stimuli.
| Concentration work solution (4x concentrated) | Final concentration | |
| Anti-Hen egg lysozyme antibody (control antibody; cIgG) | 80 nM | 20 nM |
| CIT-013 | 80 nM | 20 nM |
Table 3: Recommended concentrations for NETosis antagonist.
Supplementary Video 1. Neutrophils were stimulated with A23187 in the presence of cIgG (left) or CIT-013 (right), and NET release was visualized over time using the plasma membrane impermeable DNA dye. NET release is inhibited in the presence of CIT-013. The movie is an overlay of DNA dye (green) and phase contrast. This video was obtained with permission from van der Linden et al.16. Please click here to download this Video.
Discussion
Since the discovery of NETs in 2004, many strategies have been developed to experimentally investigate NET release in vitro, with immunofluorescence microcopy being the most common technique to quantify NETosis27,28. Although microscopy is useful to visualize NET release, it has limitations since non-automated microscopic quantification of fixed time point images is rather inaccurate and can suffer from observer bias. Another technique used to study NET release is multispectral imaging flow cytometry29,30, which measures large numbers of netting neutrophils and adopts unbiased analysis but focuses on neutrophils in the early stages of NETosis and does not quantify neutrophils that have released their NETs. Many studies on NETosis kinetics use a DNA dye to quantify NET release in combination with a fluorescence plate reader31. This technique is unable to distinguish NETs from activated or dying neutrophils with intracellular DNA staining and, therefore, is unsuitable for quantification of NET release and studying NETosis antagonists. The above emphasizes that approaches currently in use to study NETosis are valuable but have their limitations.
The real-time microscopy method described in this study addresses many issues found in previously reported techniques. It offers unbiased, semi-automated, high-throughput, reproducible, and accurate NET quantification. Indeed, this approach minimizes pipetting artifacts, like the stretched morphology of NETs18, and it is able to distinguish NETosis from necrosis and apoptosis through the distinct morphology and kinetics of DNA release18,32. In addition, this approach provides the opportunity to study different biochemical pathways for regulated cell death, like NET formation in necroptotic neutrophils, which generate structures that meet the functional and phenotypical criteria of NETs33.
There are several critical steps in this protocol that need to be followed for successful quantification of NETs. First, the correct number of cells per well is important for accurate NET quantification. When neutrophil density is too high, cells and NETs will overlap with adjacent cells and NETs, which makes them hard to distinguish, and as a result, quantification will become inaccurate. Second, it is a prerequisite to use a low concentration of non-toxic plasma membrane impermeable DNA binding dye to stain NETs when secreted into the extracellular environment. Plasma membrane permeable DNA binding dyes can easily induce neutrophil activation or cell death. Third, multiple images per well must be scanned for a representative overview of NET release amongst the heterogeneous neutrophil population. Fourth, the phase contrast image of neutrophils at t = 0 is necessary to correct for the number of neutrophils per image and calculate the percentage of netting neutrophils.
Although this real-time, high-throughput microscopy approach has many advantages over other NET detection assays, there are limitations to this method since, as far as we are aware, there are no fluorescent dyes available to detect additional NET components to confirm the release of NETs. Fluorescent-labeled antibodies for detecting additional NET components can be used but could have unwanted effects since antibody-immune complexes influence neutrophil activation and possibly NETosis. Therefore, we prefer not to use additional antibodies in this assay setup and recommend using well-known NETosis inducing stimuli instead. When not yet established NETosis stimuli are used, we advocate the use of an ELISA to detect DNA complexed with NET-specific proteins such as citrullinated histones prior to the live imaging assay. Secondly, intra- and inter-assay variation may result from donor-to-donor variability, with neutrophils from healthy donors responding differently to various NETosis stimuli due to heterogeneity within the healthy population. To minimize assay variation, neutrophils must be isolated within 1 h from freshly drawn blood and used immediately in the experiment since neutrophils are short-lived and cannot be cryopreserved. Furthermore, it is important that a neutrophil isolation protocol is validated and adopted to minimize neutrophil activation. Neutrophils are sensitive cells and can change their responsiveness to stimuli during the purification process due to mechanical and other types of stress. Neutrophil activation status and NET release can be influenced by the type of needle, blood collection tubes used, incubation temperature, centrifugation speed and the time from blood collection to neutrophil isolation34,35,36,37. An additional neutrophil isolation method that can be considered is described by Krémer et al.36 using a negative immunomagnetic selection method without red blood cell lysis. This method resembles untouched neutrophils in whole blood and might be suitable to prevent any neutrophil activation during the purification process. All the above should serve to caution the field that data from different research groups need to be compared with great care.
Overall, the described real-time high-throughput microscopy method enables accurate quantification of NETs in a reproducible and efficient manner and can be used to study the characteristics, magnitude, and kinetics of NET release and enables the investigation of the activity of NETosis antagonists. As an example of the latter, we used the humanized anti-citrullinated histone H2A and H4 monoclonal antibody CIT-013, which is currently in clinical development.
Disclosures
The authors are employees of Citryll and have financial interests.
Acknowledgements
The authors would like to thank Paul Vink for managing part of the project regarding the live imaging microscopy method.
Materials
| Name | Company | Catalog Number | Comments |
|---|---|---|---|
| A-23187 Free Acid (Calcimycin) | Thermo Fisher | A1493 | |
| Ammonium chloride (NH4Cl) | Sigma Aldrich | A9434 | |
| Anti-Hen egg lysozyme (control antibody; cIgG) | CrownBio | C0001 | |
| APC-Cy7-conjugated mouse anti-human CD45 antibody (Clone 2D1) | Biolegend | 368515 | Use at 1 µg/mL final concentration |
| BD FACSCantoTM II system + FACSDiva software (version 8.0.1) | BD | n/a | Flow cytometry system |
| Bovine Serum Albumin (BSA) Fraction V | Roche | 10735108001 | |
| CaCl2 (1 M) | VWR | E506 | |
| Calcium pyrophosphate disposition disease (CPPD) crystals | InvivoGen | lrl-cppd | |
| Cellometer Auto T4 Bright Field Cell Counter + analysis software (version 3.3.9.5) | Nexcelom Bioscience | n/a | Bright field cell counter |
| CIT-013 | Citryll B.V. | n/a | |
| Costar black 96-well plate, clear bottom | Corning | 3603 | 96-well plate #1 |
| Dextran T500 | Pharmacosmos | 551005009006 | |
| DPBS (1x) | Gibco | 14190-144 | |
| Fetal Bovine Serum (FBS) | Serena | S-FBS-SA-015 | |
| Ficoll | GE Healthcare | 17-1440-02 | Density gradient solution |
| FITC-conjugated mouse anti-human CD66b antibody (Clone G10F5) | eBioscience | 17-0666-42 | Use at 1.5 µg/mL final concentration |
| Fixable viability dye eFluor 506 | eBioscience | 65-0866-14 | |
| Flow cytometry analysis software | FLowJo | Version 10.8.0 | |
| fMLP | Sigma Aldrich | 47729-10MG-F | |
| HEPES (1M) | Gibco | 15630-080 | |
| Human serum albumin (HSA) | VWR | 31020 | |
| Human TruStain FcX | Biolegend | 422302 | Fc receptor block |
| IBIDI 96-well plate, clear bottom | IBIDI | 89626 | 96-well plate #2 |
| IncuCyte SX3 + analysis software (version 2022B Rev1) | Satorius | n/a | Live cell microscopic analysis system |
| Monosodium urate crystals | InvivoGen | tlrl-msu | |
| Mouse anti-histone H3 (citrulline R2 + R8 + R17) antibody | Cayman | 17939 | Clone 11D3; referred to as #1 |
| Mouse anti-histone H4 (K8Ac + K12Ac + K16Ac) antibody (Clone KM-2) | Absolute Antibodies | Ab01681-2.0 | |
| Na2EDTA | Sigma Aldrich | E5134 | |
| NaCl (0.9%) | B. Braun | 25900 | |
| Penicillin (5000 U/mL) - Streptomycin (5000 µg/mL) | Gibco | 15070-063 | |
| PerCP-Cy5.5-conjugated mouse anti-human CD16 antibody (Clone 3G8) | Biolegend | 302027 | Use at 0.33 µg/mL final concentration |
| PMA | Sigma Aldrich | P1585 | |
| Polyclonal rabbit anti-HSA antibody | Sigma Aldrich | A0433-2ml | |
| Poly-L-Lysine (0.01%) | Sigma Aldrich | P4832 | |
| Potassium bicarbonate (KHCO3) | Sigma Aldrich | 237205 | |
| Rabbit anti-histone H3 (citrulline R2 + R8 + R17) antibody | Abcam | ab281584 | Multiclonal; referred to as #2 |
| RPMI 1640 with GlutaMAXTM supplement | Gibco | 61870-010 | Culture medium containing L-glutamine |
| RPMI 1640 without phenol red | Gibco | 11835-030 | Culture medium without phenol red |
| Sodium azide (NaN3) | Sigma Aldrich | S2002 | |
| Sterile H2O | Gibco | 15230204 | |
| Sytox Green Nucleid Acid Stain | Thermo Fisher | S7020 | DNA dye |
| Trypan blue solution (0.4%) | Gibco | 15250-061 | |
| Tween-20 | Sigma Aldrich | P1379 | |
| Vacutainer blood tubes Li-Heparin (17 IU/mL) | BD | 367526 |
References
- Brinkmann, V., et al. Neutrophil extracellular traps kill bacteria. Science. 303 (5663), 1532-1535 (2004).
- De Bont, C., Pruijn, G. J. M. Citrulline is not a major determinant of autoantibody reactivity to neutrophil extracellular traps. Philos Trans R Soc Lond B Biol Sci. 378 (1890), 20220249(2023).
- Urban, C. F., et al. Neutrophil extracellular traps contain calprotectin, a cytosolic protein complex involved in host defense against Candida albicans. PLoS Pathog. 5 (10), e1000639(2009).
- Hoppenbrouwers, T., et al. In vitro induction of NETosis: Comprehensive live imaging comparison and systematic review. PLoS One. 12 (5), e0176472(2017).
- Kenny, E. F., et al. Diverse stimuli engage different neutrophil extracellular trap pathways. ELife. 6, e24437(2017).
- Parker, H., Dragunow, M., Hampton, M. B., Kettle, A. J., Winterbourn, C. C. Requirements for NADPH oxidase and myeloperoxidase in neutrophil extracellular trap formation differ depending on the stimulus. J Leukoc Biol. 92 (4), 841-849 (2012).
- Neeli, I., Radic, M. Opposition between PKC isoforms regulates histone deimination and neutrophil extracellular chromatin release. Front Immunol. 4, 38(2013).
- Bosmann, M., Ward, P. A. Protein-based therapies for acute lung injury: targeting neutrophil extracellular traps. Expert Opin Ther Targets. 18 (6), 703-714 (2014).
- Papayannopoulos, V. Neutrophil extracellular traps in immunity and disease. Nat Rev Immunol. 18 (2), 134-147 (2018).
- Shiratori-Aso, S., Nakazawa, D. The involvement of NETs in ANCA-associated vasculitis. Front Immunol. 14, 1261151(2023).
- Byrd, A. S., et al. Neutrophil extracellular traps, B cells, and type I interferons contribute to immune dysregulation in hidradenitis suppurativa. Sci Transl Med. 11 (508), eaav5908(2019).
- Kimball, A. S., Obi, A. T., Diaz, J. A., Henke, P. K. The emerging role of NETs in venous thrombosis and immunothrombosis. Front Immunol. 7, 236(2016).
- O'Neil, L. J., et al. Neutrophil extracellular trap-associated carbamylation and histones trigger osteoclast formation in rheumatoid arthritis. Ann Rheum Dis. 82 (5), 630-638 (2023).
- Li, M., et al. A novel peptidylarginine deiminase 4 (PAD4) inhibitor BMS-P5 blocks formation of neutrophil extracellular traps and delays progression of multiple myeloma. Mol Cancer Ther. 19 (7), 1530-1538 (2020).
- Chirivi, R. G. S., et al. Anti-citrullinated protein antibodies as novel therapeutic drugs in rheumatoid arthritis. J Clin Cell Immunol. S6, 006(2013).
- Van der Linden, M., et al. Anti-citrullinated histone monoclonal antibody CIT-013, a dual action therapeutic for neutrophil extracellular trap-associated autoimmune diseases. MAbs. 15 (1), 2281763(2023).
- Chirivi, R. G. S., et al. Therapeutic ACPA inhibits NET formation: a potential therapy for neutrophil-mediated inflammatory diseases. Cell Mol Immunol. 18 (6), 1528-1544 (2021).
- Van der Linden, M., Westerlaken, G. H. A., Van Der Vlist, M., Van Montfrans, J., Meyaard, L. Differential signalling and kinetics of neutrophil extracellular trap release revealed by quantitative live imaging. Sci Rep. 7 (1), 6529(2017).
- Hoffmann, J. H. O., Schaekel, K., Gaiser, M. R., Enk, A. H., Hadaschik, E. N. Interindividual variation of NETosis in healthy donors: introduction and application of a refined method for extracellular trap quantification. Exp Dermatol. 25 (11), 895-900 (2016).
- Silva, L. M., Moutsopoulos, N., Bugge, T. H., Doyle, A. Live imaging and quantification of neutrophil extracellular trap formation. Curr Protoc. 1 (7), e157(2021).
- De Bont, C. M., Koopman, W. J. H., Boelens, W. C., Pruijn, G. J. M. Stimulus-dependent chromatin dynamics, citrullination, calcium signalling and ROS production during NET formation. Biochim Biophys Acta Mol Cell Res. 1865 (11 Pt A), 1621-1629 (2018).
- Gajendran, C., et al. Alleviation of arthritis through prevention of neutrophil extracellular traps by an orally available inhibitor of protein arginine deiminase 4. Sci Rep. 13 (1), 3189(2023).
- Biron, B. M., Chung, C. -S., O'Brien, X. M., Chen, Y., Reichner, J. S., Ayala, A. Cl-Amidine prevents histone 3 citrullination and neutrophil extracellular trap formation, and improves survival in a murine sepsis model. J Innate Immun. 9 (1), 22-32 (2017).
- Perdomo, J., et al. Neutrophil activation and NETosis are the major drivers of thrombosis in heparin-induced thrombocytopenia. Nat Commun. 10 (1), 1322(2019).
- Lood, C., et al. Neutrophil extracellular traps enriched in oxidized mitochondrial DNA are interferogenic and contribute to lupus-like disease. Nat Med. 22 (2), 146-153 (2016).
- Kraaij, T., et al. A novel method for high-throughput detection and quantification of neutrophil extracellular traps reveals ROS-independent NET release with immune complexes. Autoimmun Rev. 15 (6), 577-584 (2016).
- De Buhr, N., Von Köckritz-Blickwede, M. How neutrophil extracellular traps become visible. J Immunol Res. 2016, 1-13 (2016).
- Brinkmann, V., Laube, B., Abu Abed, U., Goosmann, C., Zychlinsky, A. Neutrophil extracellular traps: How to generate and visualize them. J Vis Exp. (36), e1724(2010).
- Zhao, W., Fogg, D. K., Kaplan, M. J. A novel image-based quantitative method for the characterization of NETosis. J Immunol Methods. 423, 104-110 (2015).
- Gavillet, M., et al. Flow cytometric assay for direct quantification of neutrophil extracellular traps in blood samples. Am J Hematol. 90 (12), 1155-1158 (2015).
- Sil, P., Yoo, D., Floyd, M., Gingerich, A., Rada, B. High throughput measurement of extracellular DNA release and quantitative NET formation in human neutrophils in vitro. J Vis Exp. (112), e52779(2016).
- Gupta, S., Chan, D. W., Zaal, K. J., Kaplan, M. J. A high-throughput real-time imaging technique to quantify NETosis and distinguish mechanisms of cell death in human neutrophils. J Immunol. 200 (2), 869-879 (2018).
- D'Cruz, A. A., et al. The pseudokinase MLKL activates PAD4-dependent NET formation in necroptotic neutrophils. Sci Signal. 11 (546), eaao1716(2018).
- Nash, G., Abbitt, K., Tate, K., Jetha, K., Egginton, S. Changes in the mechanical and adhesive behaviour of human neutrophils on cooling in vitro. Pflugers Arch. 442 (5), 762-770 (2001).
- Hundhammer, T., Gruber, M., Wittmann, S. Paralytic impact of centrifugation on human neutrophils. Biomedicines. 10 (11), 2896(2022).
- Krémer, V., Godon, O., Bruhns, P., Jönsson, F., De Chaisemartin, L. Isolation methods determine human neutrophil responses after stimulation. Front Immunol. 14, 1301183(2023).
- Freitas, M., Porto, G., Lima, J. L. F. C., Fernandes, E. Isolation and activation of human neutrophils in vitro. The importance of the anticoagulant used during blood collection. Clin Biochem. 41 (7-8), 570-575 (2008).
Reprints and Permissions
