Nuclear magnetic resonance (NMR) spectroscopy is used to identify dysregulation in the metabolites in patients with various diseases. This technique allows the quantification of the deranged metabolites, unraveling the pathophysiological insights. Here, we describe the step-by-step procedure of the NMR-based approach for the metabolic characterization of the patients.
A subscription to JoVE is required to view this content. Sign in or start your free trial.
Method Article
Identification and Quantification of Deranged Metabolites in Critically Ill Patients Using NMR-Based Metabolomics
In This Article
Summary
Abstract
Metabolomics is emerging as a significant approach to reflect the individual's response to pathophysiological conditions. Nuclear magnetic resonance (NMR) spectroscopy has evolved as a tool to identify metabolic dysregulations in critically ill patients afflicted with conditions like acute respiratory distress syndrome (ARDS), severe acute pancreatitis (SAP), acute kidney injury (AKI), and sepsis. The spectral data from the serum sample of the study and control group are recorded using an 800 MHz NMR spectrometer and processed using NMR processing and analysis tools. Furthermore, a rigorous statistical analysis, such as univariate and multivariate tests, is performed to pinpoint significant metabolites, which are then accurately identified and quantified using NMR metabolite quantification software. Additionally, pathway analysis highlights the deranged biochemical cycles that result in the severity of illness. Through this comprehensive approach, researchers aim to gain deeper insights into the metabolic alterations associated with these critical illnesses, potentially paving the way for a better understanding of the disease and improved diagnostics and treatment strategies.
Introduction
Despite continuous efforts to provide efficient disease diagnosis worldwide, targeted therapy has still not achieved its true potential. Various approaches, such as transcriptomics, proteomics, etc., have resulted in the identification of several biomarkers, but these did not hold enough clinical utility because of the lack of sensitivity and specificity1,2. Targeted therapy is a big challenge in some multifactorial diseases, eventually leading to higher mortality. There is a need for a better understanding of the underlying mechanism and pathophysiology of complex diseases existing with wide heterogeneity. So, in this regard, the evolvement of metabolomics has revolutionized therapeutic development, which eventually may aid in tailoring the treatment regimens for various critical illnesses such as acute respiratory distress syndrome (ARDS), sepsis, and severe acute pancreatitis (SAP).
Metabolomics is a comprehensive approach aimed at identifying and quantifying small molecular weight molecules (metabolites such as amino acids, lipids, peptides, organic acids, and vitamins) across various biofluids, cells, or tissue extracts. These metabolites, which typically weigh less than 1500 Da, play active roles in biochemical processes, reflecting a progressive outline of the organism's biological state. They include substrates for key enzymatic processes, intermediates in biological pathways, and by-products of cellular metabolism. Consequently, metabolomics captures a detailed fingerprint of dietary influences, drug interactions, and disease states. Metabolite changes are highly sensitive indicators of metabolism and biological pathways, allowing for correlations with phenotypic expressions and resultant pathophysiological abnormalities3,4. Initial variations in metabolites can serve as early indicators of disease severity, while temporal changes may help in monitoring treatment efficacy, disease progression, and clinical outcomes5,6,7. Metabolomics thus enhances clinical assays and various other omics approaches by redefining diseases through clinical, physiological, and biochemical endpoints8,9,10,11,12,13. The analytical capabilities of metabolomics are employed to monitor and determine disease susceptibility through altered metabolite concentrations14,15.
In this context, both mass spectrometry (MS) and nuclear magnetic resonance (NMR) spectroscopy have emerged as the primary analytical platforms for metabolite profiling in biological samples. These methods are used for both targeted and untargeted identification and quantification of metabolites16,17,18. Each platform has its advantages and limitations, but the non-destructive nature of NMR makes it preferable in various in vivo studies and for the characterization of the structure of unknown compounds, particularly in the initial stages of metabolomics research. The sample fractionation, derivatization, and ionization required before MS can introduce biases and often result in sample loss, affecting the dynamic features that NMR spectroscopy can capture with minimal or no sample preparation. The primary limitation of NMR is its lower sensitivity compared to MS, which offers a lower limit of detection, making it challenging to detect less abundant metabolites19. However, advancements such as high-resolution superconducting magnets, cryogenically cooled NMR probes, and techniques that enhance sensitivity have mitigated this limitation20,21,22. As a complementary approach to genomics and proteomics, metabolic profiling using NMR spectroscopy is gaining traction as a preferred technique23,24,25. NMR's minimal sample preparation, reproducibility, and repeatability make it a valuable tool for capturing the inherent dynamic features of metabolites despite its sensitivity challenges26.
Several research groups have performed metabolomics successfully, pinpointing the dysregulated metabolic profile of patients for various diseases27 such as ARDS28,29,30,31,32,33, pneumonia34, sepsis7, gallstones35, and pancreatitis36. NMR-based metabolomics studies of critically ill patients have been instrumental in tracking the progression from systemic inflammatory response syndrome (SIRS) to multiple organ dysfunction syndrome (MODS), which is a leading cause of intensive care unit (ICU) mortality and morbidity37. In a study by Stringer et al., plasma samples were used to examine metabolic alterations in patients with sepsis-induced acute lung injury (ALI) compared to control patients38. Key metabolites found elevated in this pilot study reflected the metabolic pathways involved and their association with clinical scores. This research was extended to serum metabolomics to differentiate sepsis from the early stages of lung injury mechanisms in ARDS32. Additionally, another study in ARDS identified potent serum biomarkers that distinctly differentiate between acute lung injury/ARDS and healthy controls, offering insights into systemic metabolic changes corresponding to the acute onset of lung injury39,40.
NMR spectroscopy is a high-throughput and automated analytical technique that delivers robust and unbiased information about the metabolic fingerprint revealing the underlying pathophysiology38. The clinical application and biological interpretation of NMR data hinge on obtaining high-quality spectra that contain rich information. Therefore, ensuring accurate, uniform, and well-formulated data collection, processing, and analysis is crucial. Therefore, the objective of this study is to leverage the essential steps of NMR-based metabolomics for the identification and quantification of metabolites. This study highlights the key steps of the protocol required for clinical metabolomics study (Figure 1), such as the selection of appropriate samples, collection and storage, sample processing and preparation, data acquisition and analysis, identifying and quantifying the metabolite of interest, and eventually, interpretation of the results in a clinical context to derive relevant insights. Each of these steps is essential for leveraging NMR spectroscopy in metabolomics to uncover significant biological and clinical insights.
Access restricted. Please log in or start a trial to view this content.
Protocol
Ethical approval (IEC code: 2022-71-PhD-126) was obtained from the IEC of Sanjay Gandhi Postgraduate Institute of Medical Sciences (SGPGIMS), Lucknow. Written and informed consents were taken from the patients or their relatives to perform the study and publish the data for research purpose. Moreover, the research was conducted following the institutional guidelines.
1. Study design and ethical clearance
- Determine the sample size for each group. Carefully review and establish the selection criteria for participants. Additionally, if the study design requires the inclusion of human or animal samples, then obtain ethical clearance from the appropriate institutional ethical committee (IEC) before beginning sample collection.
- Select ARDS patients categorized as mild, moderate, and severe, based on the diagnostic criteria of the Berlin 2012 definition based on the partial pressure of oxygen in arterial blood (PaO2) to the fraction of inspired oxygen (FiO2) (P/F) ratio. The ARDS patients with a P/F range of 300-200 are regarded as mild, 200-100 as moderate, and below 100 as severe38. Here, we have focused on two groups: mild and moderate ARDS patients (see Table 1).
NOTE: The study involves the use of serum obtained from blood samples to perform NMR-based metabolomics. In this study, the participants included for reference had a mean age of 42 years (± 10.9 years), with a gender distribution of 2 males and 6 females.
| Category | P/F ratio |
| Mild | 300-200 |
| Moderate | 200-100 |
| Severe | 100-0 |
Table 1: ARDS patients' categorization.
2. Sample selection, collection, and processing
- Perform serum isolation by following the steps described below.
- For experimenting, collect 2 mL of blood samples from the arteries using a sterile needle in a plain (with no additives) and sterile vial. Leave the sample to clot for 30 min at room temperature. For this study, 4 patients diagnosed with mild ARDS, and 4 patients having moderate ARDS were selected.
- Centrifuge the sample at 3100 x g for 15 min to separate the serum25. Transfer the serum into sterile microcentrifuge tubes, making aliquots of smaller volume (i.e., 400-500 µL), appropriately label them (Patient name, CR no., day point, etc.), and store them at -80 °C for future analysis.
NOTE: At this point, the experiment can be paused and resumed at a convenient time.
- Process the serum sample before NMR experiments using the following steps.
- Thaw the sample before performing the NMR experiments. Mix 250 µL of aliquot of the serum with 250 µL of saline phosphate buffer solution (containing 100% D2O, 0.9% NaCl, 50 mM sodium phosphate buffer, pH 7.4) to minimize pH variation.
- Vortex the mixture for a few seconds (~15 s) to ensure it is homogenously mixed. Finally, transfer the prepared sample to a clean NMR tube with a coaxial insert containing trimethylsilyl propionate (TSP) at a concentration of 0.05 mM, which serves as an external standard for calibration and quantification41.
NOTE: For reference, an inert and non-reactive compound that does not interact with the analytes is used. Other commonly used reference compounds include Tetramethylsilane (TMS) and sodium trimethylsilylpropanesulfonate (DSS).
3. NMR experimentation
NOTE: The focus is on identifying small molecules in the serum samples, therefore, we used the Carr-Purcell-Meiboom-Gill (CPMG) pulse sequence, which suppresses macromolecule signals. All the serum samples in this study were recorded using an 800 MHz NMR spectrometer equipped with a cryogenically cooled triple-resonance TCI 5 mm broadband inverse probe-head and shielded z-gradient.
- Place the sample into the magnet. Write the command wrpa (mention experiment number) and press enter to set up a proton experiment with the cpmg pulse program. Mention the patient's name and other details necessary by clicking on the option Title.
- Lock the magnetic field by Writing the command Lock, press enter, and select the option 90% H2O and 10% D2O further. Tune and match the probe manually by ATMM to optimize the efficiency of radio frequency pulses and maximize sensitivity. Carry out 1D gradient shimming by clicking on topshim.
- Set the following acquisition parameters, including a relaxation delay of 5 s, a spectral sweep width of 12 parts per million (ppm), and an echo time of 300 µs. All these parameters can be easily modified by selecting the option Acquisition Parameters in the upper panel.
- Apply line broadening of 0.3 Hz using an exponential window function, collecting data into 64,000 points over 128 scans. These parameters can be similarly modified by selecting the option Acquisition Parameters in the upper panel. By clicking on Acquisition Parameters, a list of specifications will appear, and the mentioned attributes, along with other parameters, can be modified during optimization.
- Acquire the NMR spectra using NMR processing and analysis tools. Once the final spectra are obtained, write command apk and absn and press enter to perform phase correction and baseline correction, respectively. Click on the Calibrate Axis option present on the upper panel and then either calibrate the TSP peak to 0 ppm automatically or manually.
- Transfer the acquired data from the system to the workstation, where further processing and analysis are done.
NOTE: The experimental phase is now complete and can be paused. Data preprocessing, analysis, and interpretation can be performed conveniently.
4. Data preprocessing
- Conduct the data preprocessing using NMR processing and analysis tools and NMR metabolite quantification software.
- Sometimes, only automatic correction is not enough, and in that case, manual correction is also necessary. To perform phase correction manually, click on the option Process on the top menu bar of NMR processing and analysis tools. Then click on Adjust Phase, drag the mouse, and observe until the spectra are phase corrected. Once done, click on the Save and Return option (present in the form of an icon) available in the same menu bar.
- To perform manual baseline (Whittaker method) correction, open the spectral file in the processor module of the NMR metabolite quantification software. Select the option Baseline Correction. Then select the option Whittaker Method. Now put the dots at the base of the peaks in the entire spectra (0.0 to 10 ppm usually in the case of serum or as per the availability of the metabolite in the spectra) to adjust the base. After all the spectral files have been corrected baseline, save them in a single folder. Further processing, either using the processor or the profiler module of the NMR metabolite quantification software, can be performed using the same file saved in the specific format.
- Perform binning using the profiler module of the same software. Select the option Tools, then Batch Process, and then Spectral Binning.
- To generate the final binning sheet to be used for statistical analysis, select the folder containing all the baseline-corrected spectral files after clicking on Spectral binning.
- Divide the spectra into a set number of equal-sized bins with a defined spectral width, ranging from 0.01 to 0.04 ppm (can be optimized as per the study). This process simplifies and organizes the spectral data, facilitating more consistent analysis. Specify the bucket size along with the start and end ppm values and designate the folder where the output binning sheets will be saved.
- Exclude the chemical shift regions corresponding to water and the solvent TSP (4.8-5.2 and 0.0-0.7 ppm) to prevent spectral interference42,43,44.
- This spreadsheet contains the sample names in one row and the different bin values along with ppm in the other rows. Before using this sheet for statistical analysis, modify it by organizing the samples into groups for analysis and saving it in comma-delimited (CSV) format only.
NOTE: For instance, when comparing the mild group with the moderate group of ARDS patients, we arranged the data with mild and moderate labels, added a serial number, and saved the file in CSV format.
5. Statistical analysis
NOTE: The binning sheet obtained from the previous step serves as the input file for statistical analysis. In this study, the statistical analysis (one factor) module of metabolomics statistical analysis software was used.
- Before statistical analysis, perform the normalization step using sum, log, and Pareto but it can vary across different studies45.
- Perform univariate and multivariate analysis to distinguish the different groups and determine the accuracy of the identified metabolites.
- Perform principal component analysis (PCA), partial least-square discriminant analysis (PLS-DA), and orthogonal partial least-square discriminant analysis (OPLS-DA) to observe discrimination between the groups yielding variable importance of projection (VIP) scores for every metabolite responsible for the difference in the metabolic profile.
- Perform univariate methods, such as the student t-test and ANOVA, to identify the significant metabolites based on the criteria of having a p-value less than 0.05. Both tests yield box whisker plots showing the difference in the relative concentration of the metabolites.
- Perform biomarker analysis, which yields an area under the receiver operating characteristic curve (AUROC) graph. The AUC (area under the curve) value > 0.8 is considered significant46.
- Select the final list of significant metabolites using the criteria VIP score>1, Bonferroni-corrected p-value<0.0544, and AUC > 0.846.
- Identify metabolites as described below.
- Binning provides significant metabolites in the form of ppm values rather than names. Identify the metabolites corresponding to specific ppm values using databases like the Biological Magnetic Resonance Bank (BMRB)47and the Human Metabolome Database (HMDB).
- Other than these, use previously published literature42,44 for identification and validation.
- Use the profiler module of NMR metabolite quantification software to confirm the identified metabolites with their ppm values.
6. Quantification of metabolites using NMR metabolite quantification software
NOTE: The profiler module of the software is used widely to quantify the identified metabolites.
- Before beginning the quantification, calibrate the reference compound selected for the study (tsp used in this study) using the processor module. Click on the option Calibrate CSI (chemical shape indicator). Mention the concentration of the reference compound (0.05 mM for this study). Then, drag the software peak onto the spectral reference peak and adjust its height and width properly. Once the spectral reference peaks fit the software's peak, click on Accept.
- Open the desired spectra in the profiler module and select the appropriate compound library for study.
- At the bottom of the screen, a list of metabolites is displayed. Select the metabolite of interest from this list. Once selected, the possible ppm of the chosen metabolite will appear in the top corner of the spectra.
- Select the Ppm Value at the top corner and zoom in on the spectra to the specific ppm scale of the metabolite.
- At this point, two peaks will appear on the screen: one representing the recorded data and the other, displayed as a dotted line, representing the software peak. Align both peaks. Drag the software peak and adjust its height and position to match the peak present in the sample.
- Once properly aligned, the concentration of the metabolite can be obtained from the value displayed under the heading concentration in mM for that metabolite (Figure 1).
- Follow the same procedure for all metabolites and samples and export the quantified values in a spreadsheet. To generate the output file, click on the Batch Operations option under the Tools menu. Specify the desired folder for saving the output file.
7. Pathway analysis
NOTE: The significant metabolites identified after analysis are utilized to determine the major pathways directly influencing the outcome in disease groups. The pathway analysis module of metabolomics statistical analysis software and the KEGG database are generally employed for this purpose.
- Input the obtained list of significant metabolites into the module. A list containing the names of pathways is generated.
- Select the final pathways based on a criterion of having an impact factor greater than 0.1. Significant impact values indicate disease-related pathways30.
- Analyze the resulting pathways thoroughly to elucidate the dysregulation associated with the severity of the disease. One of the demerits of this method is its inefficiency in identifying the dysregulated pathways when the significant metabolites are less than 3.
- To cope with the same, the identified metabolite and its correlation with the disease severity can also be determined by using the previously published literature. Perform a thorough literature survey and observe if the identified metabolite is also following the same trend as per your interest.
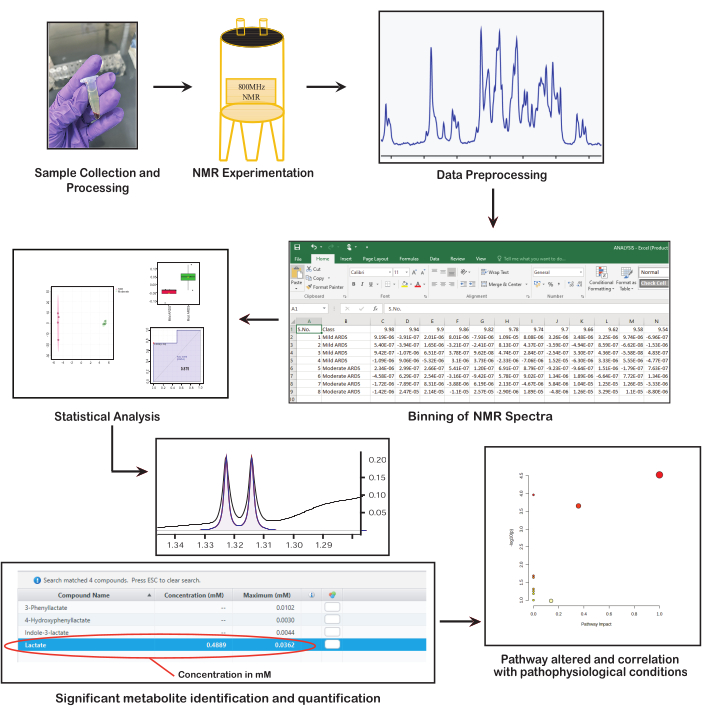
Figure 1: Fundamental steps in NMR-based metabolomics. The figure presents key steps in NMR-based metabolomics: collecting and preparing samples, performing NMR spectroscopy, preprocessing data, conducting statistical analysis, identifying and quantifying metabolites, and interpreting biological significance. Please click here to view a larger version of this figure.
Access restricted. Please log in or start a trial to view this content.
Results
To conduct a metabolomics study, it is essential to determine the sample size and the specific groups that will be analyzed. Selecting an adequate sample size is essential for obtaining significant results that accurately correlate with disease severity48. However, in this particular work, we used a small sample size to demonstrate the steps involved in the identification and quantification of metabolites using NMR-based metabolomics, which was intended primarily for reference. In this study, we e...
Access restricted. Please log in or start a trial to view this content.
Discussion
Metabolomics efficiently identifies and quantifies metabolites, targeting the metabolic cycles that become deranged during disease. The quality of the results depends on the meticulous execution of each step in the metabolomics approach. Every stage, from sample selection and collection to pathway identification, is critical in accurately identifying the primary factors contributing to the disease. Before performing metabolomics, a thorough review of the literature is essential, and careful attention must be paid at ever...
Access restricted. Please log in or start a trial to view this content.
Disclosures
The authors declare no competing financial interest.
Acknowledgements
AS acknowledges the Academy of Scientific and Innovative Research (AcSIR) for the registration (Registration No. 10BB22A71002). AS also acknowledges Defence Research and Development Organization (DRDO) for the fellowship. We acknowledge the Centre of Biomedical Research (CBMR) for providing the 800 MHz NMR spectrometer facility and funding through the intramural project (CBMR/IMR/0008/2021). We also acknowledge the Department of Critical Care Medicine (CCM), SGPGIMS, for constant support. We acknowledge the help of many nurses as well as, most importantly, the patients enrolled in this study. This study was funded by the intramural project (CBMR/IMR/0008/2021) of the Centre of Biomedical Research (CBMR) and by the extramural project (No. LSRB/01/15001/LSRB-404/PEE&BS/2023) of Defence Research and Development Organization (DRDO).
Access restricted. Please log in or start a trial to view this content.
Materials
| Name | Company | Catalog Number | Comments |
|---|---|---|---|
| Centirfuge | Sigma aldrich | 3-18KS | |
| Chenomx NMR suite | NMR Suite, v9, Chenomx Inc., Edmonton, Canada | NMR metabolite quantification software | |
| Co-axial insert | Sigma aldrich | Z278513 | |
| Deuterim oxide | Sigma aldrich | 151882 | |
| Eppendorf tubes | Tarsons | 500020 | |
| Metaboanalyst | Wishart Research Group | Metabolomics statistical analysis software | |
| NMR tube | Wilmad | Z412007 | 5mm diameter |
| Pipette | Eppendorf research plus | 3123000039 | 0-100 μl |
| Sample collection vials | Tarsons cryo chill vials | 523194 | |
| Sodium azide | Sigma aldrich | S2002 | |
| Sodium chloride crystal | Sigma aldrich | S9625 | |
| Sodium phosphate dibasic | Sigma aldrich | 567550 | |
| Sodium phosphate monobasic | Sigma aldrich | S0751 | |
| Topspin 3.6.4 | Bruker | NMR processing and analysis tool | |
| Tsp salt | Sigma aldrich | 269913 |
References
- Rubenfeld, G. D. Confronting the frustrations of negative clinical trials in acute respiratory distress syndrome. Ann. Am. Thorac. Soc. 12 (Supplement 1), S58-S63 (2015).
- Ware, L. B., et al. Prognostic and pathogenetic value of combining clinical and biochemical indices in patients with acute lung injury. Chest. 137 (2), 288-296 (2010).
- Johnson, C. H., Julijana, I., Gary, S. Metabolomics: beyond biomarkers and towards mechanisms. Nat Rev Mol Cell Biol. 17 (7), 451-459 (2016).
- Patti, G. J., Oscar, Y., Gary, S. Metabolomics: the apogee of the omics trilogy. Nat Rev Mol Cell Biol. 13 (4), 263-269 (2012).
- Nicholson, J. K., John, C. L. Metabonomics. Nature. 455 (7216), 1054-1056 (2008).
- Schnackenberg, L. K., Beger, R. D. Monitoring the health to disease continuum with global metabolic profiling and systems biology. Pharmacogenomics. 7 (7), 1077-1086 (2006).
- Pandey, S., Siddiqui, M. A., Azim, A., Sinha, N. Metabolic fingerprint of patients showing responsiveness to treatment of septic shock in intensive care unit. Magn Reson Mater Phys Biol Med. 36 (4), 659-669 (2023).
- Mamas, M., Dunn, W. B., Neyses, L., Goodacre, R. The role of metabolites and metabolomics in clinically applicable biomarkers of disease. Arch. Toxicol. 85, 5-17 (2011).
- Dunn, W. B., Broadhurst, D. I., Atherton, H. J., Goodacre, R., Griffin, J. L. Systems level studies of mammalian metabolomes: the roles of mass spectrometry and nuclear magnetic resonance spectroscopy. Chem Soc Rev. 40 (1), 387-426 (2011).
- Dettmer, K., Bruce, D. H. Metabolomics--a new exciting field within the" omics" sciences. Environ Health Perspect. 112 (7), A396-A397 (2004).
- Goodacre, R., Vaidyanathan, S., Dunn, W. B., Harrigan, G. G., Kell, D. B. Metabolomics by numbers: acquiring and understanding global metabolite data. Trends Biotechnol. 22 (5), 245-252 (2004).
- Lindon, J. C., Nicholson, J. K., Holmes, E., Everett, J. R. Metabonomics: metabolic processes studied by NMR spectroscopy of biofluids. Concepts Magn Reson Educ J. 12 (5), 289-320 (2000).
- Bernini, P., et al. Individual human phenotypes in metabolic space and time. J Proteome Res. 8 (9), 4264-4271 (2009).
- Nicholson, J. K., et al. Metabolic phenotyping in clinical and surgical environments. Nature. 491 (7424), 384-392 (2012).
- Vinayavekhin, N., Homan, E. A., Saghatelian, A. Exploring disease through metabolomics. ACS Chem Biol. 5 (1), 91-103 (2010).
- Dunn, W. B., Ellis, D. I. Metabolomics: current analytical platforms and methodologies. TrAC Trends Anal Chem. 24 (4), 285-294 (2005).
- Dunn, W. B., Bailey, N. J. C., Johnson, H. E. Measuring the metabolome: current analytical technologies. Analyst. 130 (5), 606-625 (2005).
- Bingol, K. Recent advances in targeted and untargeted metabolomics by NMR and MS/NMR methods. High-throughput. 7 (2), 9(2018).
- Emwas, A. H. M. The strengths and weaknesses of NMR spectroscopy and mass spectrometry with particular focus on metabolomics research. Methods Mol Biol. 1277, 161-193 (2015).
- Markley, J. L., et al. The future of NMR-based metabolomics. Curr Opin Biotechnol. 43, 34-40 (2017).
- Marchand, J., Martineau, E., Guitton, Y., Dervilly-Pinel, G., Giraudeau, P. Multidimensional NMR approaches towards highly resolved, sensitive and high-throughput quantitative metabolomics. Curr Opin Biotechnol. 43, 49-55 (2017).
- Eghbalnia, H. R., et al. Increasing rigor in NMR-based metabolomics through validated and open source tools. Curr Opin Biotechnol. 43, 56-61 (2017).
- Vignoli, A., et al. High-throughput metabolomics by 1D NMR. Angew Chem Int Ed. 58 (4), 968-994 (2019).
- Sundekilde, U. K., Eggers, N., Bertram, H. C. NMR-based metabolomics of food. Methods Mol Biol. 2037, 335-344 (2019).
- Garcia-Perez, I., et al. Identifying unknown metabolites using NMR-based metabolic profiling techniques. Nat Protoc. , 1-30 (2020).
- Dona, A. C., et al. A guide to the identification of metabolites in NMR-based metabonomics/metabolomics experiments. Comput Struct Biotechnol J. 14, 135-153 (2016).
- Siddiqui, M. A., Pandey, S., Azim, A., Sinha, N., Siddiqui, M. H. Metabolomics: an emerging potential approach to decipher critical illnesses. Biophys Chem. 267, 106462(2020).
- McNicholas, B. A., et al. Impact of early acute kidney injury on management and outcome in patients with acute respiratory distress syndrome: a secondary analysis of a multicenter observational study. Crit. Care Med. 47 (9), 1216-1225 (2019).
- Ambruso, S. L., et al. Inter-organ communication in homeostasis and disease: Lung metabolomics after ischemic acute kidney injury reveals increased oxidative stress, altered energy production, and ATP depletion. Am J Physiol Lung Cell Mol Physiol. 321 (1), L50(2021).
- Viswan, A., et al. Metabolomics based predictive biomarker model of ARDS: A systemic measure of clinical hypoxemia. PloS One. 12 (11), e0187545(2017).
- Metwaly, S. M., Brent, W. W. Systems biology ARDS research with a focus on metabolomics. Metabolites. 10 (5), 207(2020).
- Stringer, K. A., et al. Metabolic consequences of sepsis-induced acute lung injury revealed by plasma 1H-nuclear magnetic resonance quantitative metabolomics and computational analysis. Am J Physiol Lung Cell Mol Physiol. 300 (1), L4-L11 (2011).
- Singh, A., Siddiqui, M. A., Pandey, S., Azim, A., Sinha, N. Unveiling Pathophysiological Insights: Serum Metabolic Dysregulation in Acute Respiratory Distress Syndrome Patients with Acute Kidney Injury. J Proteome Res. 23 (10), 4216-4228 (2024).
- Slupsky, C. M. NMR-based analysis of metabolites in urine provides rapid diagnosis and etiology of pneumonia. Biomark Med. 4 (2), 195-197 (2010).
- Siddiqui, M. A., et al. NMR spectroscopy-based analysis of gallstones of cancerous and benign gallbladders from different geographical regions of the Indian subcontinent. Plos One. 18 (6), e0286979(2023).
- Li, J., et al. 1HNMR-based metabolomic profile of rats with experimental acute pancreatitis. BMC Gastroenterol. 14, 1-7 (2014).
- Mao, H., et al. Systemic metabolic changes of traumatic critically ill patients revealed by an NMR-based metabonomic approach. J Proteome Res. 8 (12), 5423-5430 (2009).
- Stringer, K. A., Jones, A. E., Puskatich, M. A., Karnovsky, A., Serkova, N. J. 1H-nuclear magnetic resonance (NMR)-detected lipids associated with apoptosis differentiate early acute respiratory distress syndrome (ARDS) from sepsis. C63. LUNG INJURY AND REPAIR: TWO TO TANGO. Am J Resp Crit Care Med. 189, A5000(2014).
- Viswan, A., Singh, C., Kayastha, A. M., Azim, A., Sinha, N. An NMR based panorama of the heterogeneous biology of acute respiratory distress syndrome (ARDS) from the standpoint of metabolic biomarkers. NMR Biomed. 33 (2), e4192(2020).
- Singh, C., et al. Metabolic profiling of human lung injury by 1 H high-resolution nuclear magnetic resonance spectroscopy of blood serum. Metabolomics. 11, 166-174 (2015).
- Pandey, S., Siddiqui, M. A., Trigun, S. K., Azim, A., Sinha, N. Gender-specific association of oxidative stress and immune response in septic shock mortality using NMR-based metabolomics. Mol Omics. 18 (2), 143-153 (2022).
- Nagana, G. A., Gowda, Y. N., Raftery, D. Expanding the limits of human blood metabolite quantitation using NMR spectroscopy. Anal Chem. 87 (1), 706-715 (2015).
- Gowda, G. A. N., Raftery, D. Quantitating metabolites in protein precipitated serum using NMR spectroscopy. Anal Chem. 86 (11), 5433-5440 (2014).
- Gowda, G. A. N., Raftery, D. NMR-based metabolomics. Adv Exp Med Biol. 1280, 19-37 (2021).
- Xia, J., Psychogios, N., Young, N., Wishart, D. S. MetaboAnalyst: a web server for metabolomic data analysis and interpretation. Nucleic Acids Res. 37 (suppl_2), W652-W660 (2009).
- orbacıoğlu, ŞK., Aksel, G. Receiver operating characteristic curve analysis in diagnostic accuracy studies: A guide to interpreting the area under the curve value. Turk J Emerg Med. 23 (4), 195(2023).
- Ulrich, E. L., et al. BioMagResBank. Nucleic Acids Res. 36 (suppl_1), D402-D408 (2007).
- Nyamundanda, G., Gormley, I. C., Fan, Y., Gallagher, W. M., Brennan, L. MetSizeR: selecting the optimal sample size for metabolomic studies using an analysis based approach. BMC bioinformatics. 14, 1-8 (2013).
- Beckonert, O., et al. Metabolic profiling, metabolomic and metabonomic procedures for NMR spectroscopy of urine, plasma, serum and tissue extracts. Nat Protoc. 2 (11), 2692(2007).
- Dona, A. C., et al. Precision high-throughput proton NMR spectroscopy of human urine, serum, and plasma for large-scale metabolic phenotyping. Anal Chem. 86 (19), 9887-9894 (2014).
- Ala-Korpela, M. Potential role of body fluid 1H NMR metabonomics as a prognostic and diagnostic tool. Expert Rev Mol Diagn. 7 (6), 761-773 (2007).
- Takeda, I., et al. Understanding the human salivary metabolome. NMR Biomed. 22 (6), 577-584 (2009).
- Callejon-Leblic, B. em, García-Barrera, T., Pereira-Vega, A., Gómez-Ariza, J. L. Metabolomic study of serum, urine and bronchoalveolar lavage fluid based on gas chromatography mass spectrometry to delve into the pathology of lung cancer. J Pharm Biomed Anal. 163, 122-129 (2019).
- Van Oort, P. M. P., et al. Exhaled breath metabolomics for the diagnosis of pneumonia in intubated and mechanically-ventilated intensive care unit (ICU)-patients. Int J Mol Sci. 18 (2), 449(2017).
- Serkova, N. J., Niemann, C. U. Pattern recognition and biomarker validation using quantitative 1H-NMR-based metabolomics. Expert Rev Mol Diagn. 6 (5), 717-731 (2006).
- Meiboom, S., Gill, D. Modified spin-echo method for measuring nuclear relaxation times. Rev Sci Instrum. 29 (8), 688-691 (1958).
- Xi, Y., Rocke, D. M. Baseline correction for NMR spectroscopic metabolomics data analysis. BMC bioinformatics. 9, 1-10 (2008).
Access restricted. Please log in or start a trial to view this content.
Reprints and Permissions
