Biological samples have distinct optical characteristics in the short-wave infrared (SWIR) compared to the visible (VIS) and near-infrared (NIR) wavelength ranges. However, recording pure SWIR absorption spectra is challenging and rarely conducted for biological molecules. This article presents a method to characterize the VIS-SWIR absorption spectra of biological absorbers.
Method Article
Characterization of Biological Absorption Spectra Spanning the Visible to the Short-Wave Infrared
In This Article
Summary
Abstract
For noninvasive light-based physiological monitoring, optimal wavelengths of individual tissue components can be identified using absorption spectroscopy. However, because of the lack of sensitivity of hardware at longer wavelengths, absorption spectroscopy has typically been applied for wavelengths in the visible (VIS) and near-infrared (NIR) range from 400 to 1,000 nm. Hardware advancements in the short-wave infrared (SWIR) range have enabled investigators to explore wavelengths in the ~1,000 nm to 3,000 nm range in which fall characteristic absorption peaks for lipid, protein, and water. These molecules are difficult to visualize in the VIS-NIR and can provide label-free sources of biological contrast. Furthermore, lower SWIR absorption has been observed for melanin, the primary chromophore responsible for skin pigmentation. In vivo optical devices like clinically standard pulse oximeters have been found to have reduced accuracy in people with darkly pigmented skin, possibly because of the stronger melanin absorption in the VIS range. Thus, error associated with skin pigmentation could be reduced by using devices operating in the SWIR. Optical instrument design is facilitated by the understanding of the absorption properties of core tissue components from the VIS to the SWIR range. This article describes protocols and instrumentation for obtaining VIS-SWIR absorption spectra of common tissue absorbers: oxygenated hemoglobin, deoxygenated hemoglobin, melanin, water, and lipid.
Introduction
Most biological absorbers have been optically characterized in the visible (VIS, ~400-700 nm) and near-infrared (NIR, ~700-1,000 nm) spectral ranges but not the short-wave infrared (SWIR, ~1,000-3,000 nm)1,2,3,4 (Figure 1). This is despite the SWIR offering deeper light penetration due to lower tissue scattering and reduced melanin absorption as well as additional label-free biological contrast for water, lipid, and protein1,5,6. The lack of absorption spectra spanning the VIS-SWIR has created a gap in knowledge that prevents the development of biomedical optical devices that take advantage of these SWIR benefits. While several attempts to characterize the spectra have been presented in the past, high-quality VIS-SWIR absorption spectra of pure components without significant solvent artifacts are lacking1,7,8. For example, water-soluble substances such as hemoglobin have been characterized in the SWIR using water as a solvent and subtracting pure water absorption from the resultant spectra9. However, the accuracy of this approach is unclear because water is a dominant absorber in this region.
Working in the SWIR has the additional advantage of reducing or possibly removing bias caused by strong melanin absorption in the VIS when using in vivo optical diagnostics. Numerous studies have found that pulse oximeters overestimate oxygenation in Black patients, and as such Black patients are more likely to have dangerously low oxygen levels that pulse oximeters did not detect10. This skin pigmentation bias has resulted in delayed and inadequate medical treatment of many Black hypoxic patients11,12 and prompted a call to action in the optics and engineering communities to improve the accuracy of optical devices for all skin tones13. Moving from the high melanin-absorbing VIS wavelengths to the NIR and SWIR is one exciting technical innovation that could reduce racial disparities in critically important biomedical optics technologies.
Recording ground-truth absorption spectra of biomolecules is essential for understanding the optical properties of tissue samples that are used in a variety of engineering and biomedical applications14. Absorption spectroscopy measures molecule-specific light absorption as a function of wavelength. The gold standard method of acquiring absorption measurements in solution is to direct collimated, monochromatic light through a dissolved sample and record the transmitted light with a detector placed on the opposite side of the sample from the light source. The absorption (A) of the sample is then defined by Eq. (1).
A = log10(I0/I) (1)
Where Io is the incident light intensity on the sample, and I is the intensity of light transmitted through the sample that hits the detector. Io is acquired by measuring a reference, which is typically the solvent of the solute of interest, using the same acquisition settings as I. Absorption spectroscopy provides quantitative absorption properties and is governed by the Beer-Lambert Law (Eq. 2), which does not apply to samples that have optical scattering. This equation states that optical absorption is determined by a sample's molar absorptivity coefficient (ε, units L·mol−1·cm−1) at wavelength λ multiplied by its molar concentration (C, units mol∙L-1) and the pathlength (L, units cm), which is defined as the distance traveled through the sample15:
A(λ) = ε(λ)*L*C (2)
Importantly, the molar absorptivity coefficient is unique to each biological absorber and indicates how strongly a sample absorbs light at a particular wavelength16.
When taking absorption spectroscopy measurements spanning from the VIS to the SWIR, adjustments to hardware, sample preparation, and spectral postprocessing are required beyond standard VIS-NIR spectra:
Hardware
VIS-NIR measurements typically use a silicon detector or photomultiplier tubes (PMT) with photocathodes sensitive to UV-VIS photons, while SWIR absorbance requires a photodetector that is sensitive to SWIR photons, such as an Indium Gallium Arsenide (InGaAs) detector17. VIS, NIR, and SWIR systems also typically require wavelength-specific dispersion elements, such as optical gratings, for light dispersion in these optical ranges. In addition, SWIR absorption requires glass or quartz cuvettes, which have higher transmission than plastic cuvettes in the SWIR, making them more suitable for VIS-SWIR spectra. A light source or sources with a broad and relatively uniform emission covering the VIS-SWIR, like a tungsten-halogen lamp (used in this protocol), should be selected. Adjusting the incident light power, the exposure time, or the duration for which the photodetector is exposed to light can help optimize absorbance measurements.
Sample preparation
The sample's concentration or cuvette's pathlength will linearly alter the amount of absorption that occurs as described above in Eq (2), and thus, either can be changed to achieve a high signal-to-noise ratio (SNR, herein calculated as the ratio of the peak amplitude divided by the standard deviation of a detrended region of the spectrum, typically SNR > 30 is considered high quality) measurements in different sections of the spectrum with relatively high or low absorbance. To optimize SWIR measurements in an aqueous solution, deuterium oxide (D2O), also referred to as heavy water or deuterated water, can be used instead of water (H2O), because it has significantly lower absorption peaks in the SWIR1. This allows for the characterization of the solute without interference of the dominant water absorption in the SWIR.
Spectral postprocessing
Postprocessing is required because VIS-SWIR spectra require two detectors, one for the visible-NIR (typically silicon or UV-VIS-sensitive PMT) and one for the SWIR (typically InGaAs), and the spectra must be stitched together to achieve a full VIS-SWIR spectrum. When spectra span the VIS-SWIR, the absorption can vary significantly depending on the wavelength region, and the sample may need to be diluted or the pathlength decreased in some areas to prevent saturation. Spectra must be linearly scaled to account for changes in sample concentration or pathlength and then stitched together to create a single spectrum that includes two wavelength regions.
The following protocols will detail the preparation and spectroscopic measurement from the VIS to the SWIR of five example biological absorbers: water (comprises ~60% of body weight), melanin (primary absorber for skin pigmentation), corn oil (used as an analog for human lipids because it has low variability between batches, close chemical composition to human and animal lipids, and minimal scattering), and oxygenated and deoxygenated hemoglobin (the primary absorbers in blood).
Protocol
1. Preparation of samples
- Preparation of water sample
- To prepare the sample, fill a clean container with ultrapure water and filter it using a 0.22 µm syringe filter. Make sure the output of the syringe is directed to a clean glass or quartz cuvette to take absorption spectroscopy measurements of the sample.
- To prepare the reference, fill a clean container with deuterated water and filter it using a 0.22 µm syringe filter. Make sure the output of the syringe is directed to an identical clean glass or quartz cuvette as the sample cuvette to serve as the reference.
NOTE: The filtering step will minimize optical scattering from the sample by filtering out small particulates in the water, which have strong contributions in the visible region.
- Preparation of melanin sample
- Prepare a 1.7 mg/mL solution of melanin by adding powdered melanin to a centrifuge tube filled with 3.5 mL of dimethyl sulfoxide (DMSO). To begin, measurements should start at the wavelengths with the lowest expected absorption, where the highest concentration of melanin is required. Begin melanin measurements with approximately 1.7 mg/mL for the SWIR and dilute it with DMSO later to a 10x dilution (approximately 0.17 mg/mL) for the VIS/NIR regions.
- Sonicate the tube for 10 min to ensure the powdered melanin dissolves in the DMSO and transfer the solution to a clean glass or quartz cuvette for spectroscopy measurements.
- Stay within the linear absorbance range of the spectrometer and ensure high SNR measurements by changing the concentration and/or pathlength (e.g., by switching from a short pathlength (1 or 2 mm) to a 10 mm pathlength cuvette). Melanin absorption has a wide range spanning from VIS to SWIR. For the VIS, use the lowest concentration and/or pathlength cuvette of melanin due to its high molar extinction coefficient; for the SWIR, use the highest concentration of melanin and/or pathlength cuvette to obtain a qualitatively clean spectroscopy measurement.
- Preparation of corn oil sample
- Add corn oil to a clean glass or quartz cuvette for spectroscopy measurements.
- Use open air as the reference. No cuvette or solution will be used as the reference.
- Preparation of oxygenated hemoglobin sample with whole heparinized human blood
NOTE: Whole heparinized human blood was purchased and was collected in FDA-licensed collection centers located in the United States.- To isolate hemoglobin from the red blood cells (RBCs) and remove as much water from the blood as possible, first pipette 1,800 µL of whole heparinized human blood into microcentrifuge tubes and centrifuge at 9.6 × g for 10 min.
NOTE: Approximately 4-6 microcentrifuge tubes are recommended - After centrifugation, remove the tubes from the microcentrifuge, then remove and discard the supernatant (will be approximately 850 µL) from the centrifuged blood sample without disturbing the pellet (Figure 2). The supernatant comprises the liquid (mainly plasma and platelets) above the red blood cell pellet. Look for the red blood cell pellet at the bottom of the microcentrifuge tube.
- Reconstitute each pellet with the same volume of deuterated water as the volume of supernatant that was discarded. Centrifuge again at 9.6 × g for 10 min.
- Remove the tubes from the centrifuge, then discard the supernatant without disturbing the pellet.
- Reconstitute the pellet with the same volume of deuterated water as the volume of supernatant that was discarded. Re-centrifuge at 9.6 × g for 10 min.
- Remove the tubes from the centrifuge, then remove the supernatant using a pipette and discard it.
- Lysing red blood cells (RBCs): Reconstitute the RBC pellets with a large volume (4.5 mL) of deuterated water, which will cause a hypotonic burst. If the pellet is sticking to the tube, rinse it with some of the measured 4.5 mL of deuterated water to loosen it.
NOTE: The volume of supernatant will increase after each centrifugation step. This volume of supernatant can range from 800 µL to 1,600 µL. The volume of deuterated water for lysing could change depending on the desired sample concentration but needs to be high enough to cause hypotonic burst. - Remove the lysed blood solution from the tube with a needle and syringe; then, carefully remove the blunt-tip syringe needle and discard it in a biohazard sharps container. Connect the syringe to a 0.22 µm syringe filter and push the syringe contents through the filter into a 10 mm pathlength, 3.5 mL glass or quartz cuvette.
NOTE: The filtering step will minimize optical scattering from the sample by filtering out the cellular organelles and membranes in the solution. If the sample is highly concentrated and the syringe filter becomes difficult to push, use multiple syringe filters. - Secure the cuvette with an air-tight stopper over the cuvette to prevent water vapor from the air contaminating the sample. Parafilm the outside of the stopper to further prevent contamination and ensure an air-tight seal.
NOTE: For measurements from 600 nm to 1,600 nm, approximately 1,200-1,600 µL of pellet dissolved in 4.5 mL of deuterated water will give qualitatively clean measurements.
NOTE: For spectral regions with high expected absorbance (400 nm to 600 nm), samples will need to be diluted using deuterated water to obtain non-saturated absorbance values and ensure absorbance values are within the linear range of the detector. In addition, the samples and the reference should be placed in short pathlength cuvettes (1 or 2 mm). For the spectra shown herein, samples were diluted 10x for 400-500 nm and 5x for 500-600 nm and measured in 2 mm pathlength cuvettes.
The shorter pathlength (1 or 2 mm) will allow for less light absorption in highly absorbing wavelengths, helping ensure some photons transmit through to the detector and remain within the linear detection range. - Obtain a clean cuvette with the same pathlength and volume as the sample cuvette containing the filtered blood solution and fill it with deuterated water for baseline and reference measurements. If changing cuvette pathlengths for different spectral ranges, record a new reference spectrum for each cuvette pathlength.
- To isolate hemoglobin from the red blood cells (RBCs) and remove as much water from the blood as possible, first pipette 1,800 µL of whole heparinized human blood into microcentrifuge tubes and centrifuge at 9.6 × g for 10 min.
- Preparation of deoxygenated hemoglobin sample with whole heparinized human blood
- Follow steps 1.4.1-1.4.8.
- Add sodium dithionite to the blood solution in the cuvette and gently stir. Secure the cuvette with an air-tight stopper over the cuvette to prevent water vapor from the air contaminating the sample. Parafilm the outside of the stopper to further prevent contamination and ensure an air-tight seal. Carefully tilt the cuvette side to side to ensure that the sodium dithionite dissolves in the solution; the blood solution will change from a red color to a darker purple-red color.
NOTE: To fully deoxygenate hemoglobin, the mass of sodium dithionite that is required is approximately 0.007 g per mL of blood solution. According to Briley-Sӕbø and Bjørnerud, at least 2.5 mg of sodium dithionite/g of blood is needed to fully deoxygenate whole blood18. However, this concentration was found to be insufficient in the studies here. A concentration of approximately 3.4 mg/g of whole blood was found to completely deoxygenate the blood solution without the introduction of optical scattering. For measurements from 400 to 600 nm, the blood solution will need to be diluted with deuterated water. Calculate the required sodium dithionite mass based on the volume of bood solution used and not the volume after dilution. For measurements from 600 nm to 1,600 nm, approximately 1,200-1,600 µL of pellet dissolved in 4.5 mL of deuterated water will give high SNR measurements.
A shorter pathlength cuvette (1 or 2 mm) will allow for less light absorption in highly absorbing wavelengths, helping ensure some photons transmit through to the detector and remain within the linear detection range. - Fill another cuvette with matching pathlength as the cuvette with filtered blood solution with deuterated water for baseline and reference measurements. If changing cuvette pathlengths for different spectral ranges, record a new reference spectrum for each cuvette pathlength.
2. Obtaining high-quality absorption measurements
- Prepare samples and reference as described in section 1 and place them in glass or quartz cuvettes for VIS NIR-SWIR measurements. Turn on the spectrometer lamp and detectors and allow the system to warm up for at least 5-20 min, depending on the spectrometer system and light source.
NOTE: Five minutes provided sufficient detector cooling and lamp output stability for the spectra collected herein, but this should be characterized for each system before the capture of absorbance measurements.
Keep the sample and reference handy during this period of collection. Make sure the lids on cuvettes are secure. Keep measurement space as dark as possible to prevent distortion of the absorption measurements by ambient light. - Repeat the following steps for different regions of the spectrum due to wide variance in absorption across the VIS-SWIR.
- If using a dual-beam configuration (two separate detectors for sample and reference), make sure the system is baselined. Acquire the baseline by placing identical reference samples containing the solvent in front of each detector and collect an absorbance measurement using the exact acquisition parameters to be used for the sample absorbance spectrum collection. While the detectors should theoretically show zero absorption, it is usually not perfect. Subtract the resulting absorbance spectrum from all sample absorbance spectra that are acquired using the same settings.
NOTE: The baseline should be repeated any time the acquisition settings for data collection are changed. - Place the sample in the spectrometer and choose the detector that is relevant to the region to be measured (VIS-NIR = silicon or UV-VIS PMT, SWIR = InGaAs) and view absorbance in Live Mode, in which the measurement continuously updates as measurement parameters are tuned.
- Starting with default spectrometer parameters, adjust incident light power and exposure time until a qualitatively clean absorption spectrum without saturation is obtained.
- If tuning the parameters does not result in qualitatively clean spectra, modify parameters such as incident light power, exposure time, pathlength, and sample concentration. First, try adjusting power and exposure time. If tuning these parameters does not result in a high SNR spectrum, change the sample concentration or the pathlength of the sample and the reference.
NOTE: Default parameters used in the collection of the spectra shown herein were incident light power of 15 nW at 400 nm and 20 nW at 1,000 nm, exposure time of 30 ms, cuvette pathlength of 10 mm, and sample specific concentrations: 100% water, melanin 1.7 mg/mL, 100% corn oil, oxygenated hemoglobin (15.9 g/dL), and deoxygenated hemoglobin (15.9 g/dL). - To increase the SNR, increase the number of data reads averaged per data point. The higher the number of data reads averaged, the longer the time per measurement.
- To increase spectral resolution, reduce the step size (nm) of the measurement down to the spectrometer's resolution limit. This will increase the time per measurement. Additionally, reduce the incident light power bandwidth to 1/10th of the narrowest peak's full width at half maximum19.
- Once the measurement settings are optimized for the sample, document the settings for each spectrum acquired.
- To obtain a spectrum, use the optimized settings to take a measurement of the reference only. Next, replace the reference cuvette with the sample cuvette and take another measurement. Make sure to save both the reference and sample measurements separately.
NOTE: It is imperative that the reference measurement does not saturate. If it does, reduce the incident light power and/or exposure time until there is no saturation. Keep all system parameters the same between the reference and sample measurements; if one needs to be changed, the other will also need to be repeated to match it. - For each paired set of reference and sample measurements, calculate the absorbance A (Eq 1) by treating the reference measurement as Io and the sample measurement as I.
- To stitch together different regions that required differences in sample concentration or pathlength, apply a multiplication factor to one of the spectral regions. For example, for a first region that had 1/10 of the concentration and identical pathlength as a second region, multiply the first spectral region by 10 to appropriately scale the two regions together.
NOTE: The multiplication factor should be the difference in concentration and/or pathlength between the regions. - Once the spectra have been corrected for differences in pathlength or concentration, choose an overlapping wavelength in the two spectral regions for stitching the two regions together.
- Truncate the two spectra to end at the overlap wavelength; choose one spectrum to include its transition spectral value. Concatenate the two truncated spectra to create a single resulting spectrum of a wider wavelength range.
- If tuning the parameters does not result in qualitatively clean spectra, modify parameters such as incident light power, exposure time, pathlength, and sample concentration. First, try adjusting power and exposure time. If tuning these parameters does not result in a high SNR spectrum, change the sample concentration or the pathlength of the sample and the reference.
- If using a dual-beam configuration (two separate detectors for sample and reference), make sure the system is baselined. Acquire the baseline by placing identical reference samples containing the solvent in front of each detector and collect an absorbance measurement using the exact acquisition parameters to be used for the sample absorbance spectrum collection. While the detectors should theoretically show zero absorption, it is usually not perfect. Subtract the resulting absorbance spectrum from all sample absorbance spectra that are acquired using the same settings.
Results
Data are available via the WUSTL Digital Research Materials Repository (DRMR) doi: https://doi.org/10.7936/6RXS-108249
Spectral characterization of water
Water, one of the most common biological absorbers, has characteristic, highly absorbing peaks in the NIR and SWIR. These characteristic peaks are so strong that when measuring the absorbance of water, it must often be diluted with deuterated water to prevent saturation. The difference in absorbance between water and deuterated water is shown in Figure 3, highlighting more than an order of magnitude increase in water absorbance over deuterated water. Strong water absorption in the SWIR also makes it difficult to obtain the absorption spectra of other biological absorbers that contain water in the sample or that use water as the solvent and reference. As a solution to this problem, deuterated water can be used instead of water. Deuterated water acts in a similar manner to water while being a much weaker SWIR absorber, making it an ideal replacement for water in SWIR spectroscopy measurements.
To measure the absorption spectrum of water, water was used as the sample and deuterated water as the reference. To prevent saturation in the SWIR, the sample was diluted with deuterated water in the SWIR region. The resulting water absorption spectrum shows low absorption in the VIS, which increases at longer wavelengths. Characteristic absorption peaks can be seen at approximately 750 nm, 970 nm, 1,200 nm, and 1,450 nm (Figure 4). The resulting water spectrum has an SNR of 3536.6 and was compared to Hale and Querry's water absorption spectrum20, showing a similar absorption curve from ~500 nm to 1,600 nm. However, from 400 to 500 nm, the absorption curves differ, with Hale and Querry showing a higher absorbance value at lower wavelengths. This difference could be due to residual small particles in the water that will have higher scattering at shorter wavelengths compared to longer wavelengths3 and may invalidate the assumptions of no scattering in Beer-Lambert law-based absorption measurements.
Spectral characterization of melanin
Melanin, the skin's primary optical absorber, was spectrally characterized using powdered melanin as the sample and DMSO as the solvent and reference. The resulting spectrum has a SNR of 172 and was compared to eumelanin data from Sarna et al.21,22 and Crippa et al.23 (Figure 5). Eumelanin is the primary pigment responsible for the color of skin and, therefore, provides the most accurate data for how melanin will impact optical devices. The spectrum collected using the protocol described herein shows high correlation to these literature values.
Spectral characterization of corn oil
To investigate the absorption spectrum of a lipid, corn oil was chosen due to its minimal optical scattering when compared to other lipids and its known similarity in chemical composition to animal fats1. To take the absorption spectrum of corn oil, corn oil was used as the sample with air as the reference. As seen in Figure 6, the corn oil spectrum contains characteristic peaks at approximately 930 nm, 1,210 nm, and 1,410 nm. The resulting corn oil spectrum has a SNR of 10363.1 and was overlaid with Cao et al.'s corn oil spectrum1, showing a strong correlation.
Spectral characterization of oxygenated and deoxygenated hemoglobin
While the characterization of the absorption of oxygenated and deoxygenated hemoglobin is one of the most important feats in biomedical optics, their absorption spectra spanning the VIS to the SWIR remains poorly understood. One of the most challenging aspects of determining the absorption spectrum of oxygenated and deoxygenated hemoglobin in the SWIR is removing the water in blood, which overwhelms the relatively small hemoglobin absorption. To disentangle the absorbance of hemoglobin and water, hemoglobin was first isolated from human whole blood using centrifugation and the supernatant was removed and replaced with deuterated water. Deuterated water was also used as the reference and solvent that hemoglobin was reconstituted in to cause hypotonic burst. As shown in Figure 3, deuterated water has a much lower optical absorption than water, making it an ideal solvent and reference for SWIR absorption measurements. The resulting oxygenated hemoglobin spectrum spans the VIS to the SWIR with a SNR of 23118.7 and matched very closely Prahl's published oxygenated hemoglobin spectrum4 (Figure 7). In the VIS, the oxygenated hemoglobin spectrum shows high absorption with characteristic absorption peaks at approximately 415 nm and a doublet peak from approximately 540 to 575 nm. In the NIR, the oxygenated hemoglobin spectrum shows a characteristic peak spanning a wider range of wavelengths, approximately 800 nm to 1,100nm. In the SWIR, the absorption of hemoglobin is low. However, from approximately 1,400 nm to 1,600 nm, the hemoglobin spectrum shows higher absorption with peaks, likely due to water in hemoglobin that was unable to be fully removed during the centrifugation process.
For deoxygenated hemoglobin, sodium dithionite was added to the hemoglobin solution to introduce dissociation of dioxygen from oxygenated hemoglobin and converting the sample to deoxygenated hemoglobin. The resulting spectrum has an SNR of 9813.9 and was compared against Prahl's deoxygenated hemoglobin spectrum and shows a very strong correlation between 400 nm and 1,000 nm4 (Figure 8). The resulting deoxygenated hemoglobin spectrum shows characteristic absorption peaks at approximately 430 nm, 560 nm, and 760 nm. After this, the absorption of deoxygenated hemoglobin drops off but contains smaller absorption peaks around 1,200 nm and from 1,400 nm to 1,600 nm. The absorbance between 1,400 and 1,600 nm is likely due to water that was not fully removed from the hemoglobin sample during the centrifugation process.
Comparison of biological absorbers from the VIS-SWIR
The full VIS-SWIR spectra from all the biological absorbers characterized in this protocol are shown in Figure 9, scaled based on their biological concentration in tissue2, which highlight the distinct spectral differences between biological absorbers. For instance, melanin, oxygenated hemoglobin, and deoxygenated hemoglobin have strong, characteristic absorption in the VIS that generally decreases with wavelength, whereas water and lipid show characteristic peaks in the NIR and SWIR. In biological tissue, the combination of decreases in melanin and hemoglobin as well as decreases in optical scattering provide increased optical penetration depth in the NIR and SWIR. Additionally, the NIR and SWIR's reduced melanin absorption enable optical investigation of oxygenated and deoxygenated hemoglobin, lipid, and water with minimal effects due to skin pigmentation.
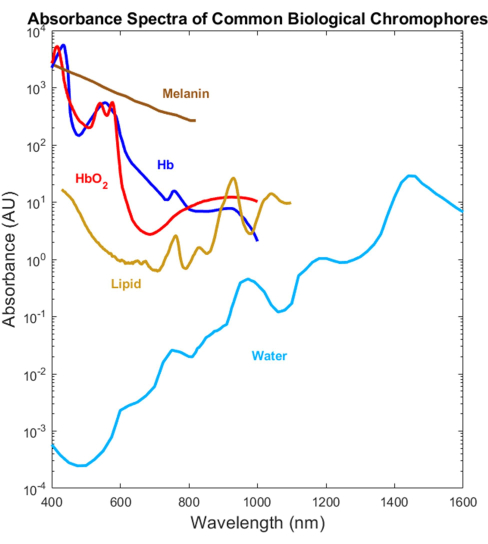
Figure 1: Previously published spectra of common biological absorbers across the UV to the SWIR. The oxygenated and deoxygenated hemoglobin spectra were plotted using data from Prahl4. The melanin spectrum was plotted using data from Sarna21 and Crippa23. The lipid spectrum was plotted using data from van Veen24. The water spectrum was plotted using data from Hale and Querry20. Abbreviation: SWIR = short-wave infrared. Please click here to view a larger version of this figure.
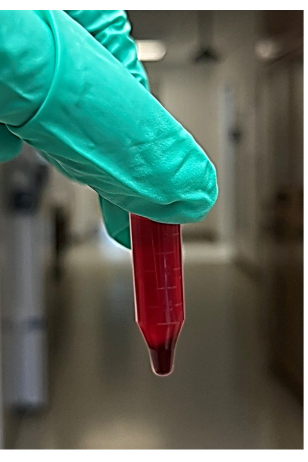
Figure 2: Photo of the supernatant and red blood cell pellet from centrifuged whole blood. Please click here to view a larger version of this figure.

Figure 3: Absorbance spectrum comparison of water and deuterated water collected with identical acquisition settings in log (left) and linear (right) absorbance scale. Please click here to view a larger version of this figure.

Figure 4: Comparison of water absorbance spectrum acquired using methods described herein versus Hale and Querry20. Please click here to view a larger version of this figure.

Figure 5: Comparison of melanin absorbance spectrum acquired using methods described herein versus Sarna et al.21,22 and Crippa et al.23. Please click here to view a larger version of this figure.

Figure 6: Comparison of corn oil absorbance spectrum acquired using methods described herein versus Cao et al.1. Please click here to view a larger version of this figure.

Figure 7: Comparison of oxygenated hemoglobin absorbance spectrum acquired using methods described herein versus Prahl4. Spectral features from 1,400 to 1,600 nm likely attributed to residual water in the sample. Please click here to view a larger version of this figure.

Figure 8: Comparison of deoxygenated hemoglobin absorbance spectrum acquired using methods described herein versus Prahl4. Spectral features from 1,400 to 1,600 nm likely attributed to residual water in the sample. Please click here to view a larger version of this figure.

Figure 9: VIS-SWIR spectra of common biological absorbers. Abbreviation: VIS-SWIR = visible-short-wave infrared. Please click here to view a larger version of this figure.
Discussion
The protocol(s) outlined in this article can be used to obtain VIS-SWIR absorption spectra of biological absorbers and contrast agents. Herein, we show specific steps to obtain spectra of water, melanin, corn oil, oxygenated hemoglobin, and deoxygenated hemoglobin spanning from 400 nm to 1,600 nm. The following discussion covers critical steps, tips for measurement optimization, limitations of the method, and applications of this protocol within biomedicine.
While all the protocol steps are important, a few critical steps must be followed to obtain accurate spectra with this protocol. First, the sample must be non-scattering; for example, when obtaining oxygenated and deoxygenated hemoglobin from blood, the scatterers in the sample must be filtered out (here, a 0.22 µm syringe filter was used). When preparing deoxygenated hemoglobin, the amount of sodium dithionite added should not exceed the weight provided, as it will turn the sample turbid at higher weight percentages and invalidate the Beer-Lambert law requirements.
Second, deuterated water must be used as the sample solvent and reference for water-soluble solutes such as hemoglobin. In the SWIR, water absorption is strong and can mask other absorbers. Third, measurements must be acquired within the linear range of the detector, defined as the region in which a change in photons reaching the detector results in a linear change in detector signal. If minimal absorption occurs, the detector may register an absorbance of zero, even if there is absorbance occurring. This occurs when the sample is too dilute, the exposure time is too low, and/or the cuvette pathlength too short, but can be remedied by an increase in sample concentration, cuvette pathlength, and/or exposure time. Similarly, if high absorption occurs, the detector may not register any photons and yield a flat line termed "saturation" that is not sensitive to changes in absorbance. This occurs when the sample is too concentrated, the exposure time is too low, and/or the pathlength is too long, but can be fixed by increasing sample concentration, increasing exposure time, and/or decreasing cuvette pathlength.
Fourth, the detectors used must be linear. If uncertain whether the detector shows a linear response to the number of photons reaching the detector, various dilutions of a sample can be measured with the same acquisition settings to check whether their absorbance values show the expected linear trend between absorbance and concentration. Alternatively, a single sample can be measured and the exposure time increased to test whether there is a linear increase in detector intensity. Both tests should yield a linear relationship if the user is operating within its linear limits (see the third critical point above).
Fifth, to stay within the linear range of the detector for the entire VIS-SWIR spectral range, the sample concentration, detector exposure time, and/or cuvette pathlength will need to be changed for different spectral regions with significantly higher or lower absorbance from the starting spectral region.
Sixth, spectra acquired using different sample concentrations or pathlengths for different spectral regions must be stitched together by linear scaling of one region based on known changes in concentration or pathlength. After scaling, the spectra should be stitched together at an overlapping wavelength between the two regions. If a measurement will span measurements from different detectors, there should be overlapping absorbance spectra that contain the desired detector transition wavelength (800 nm is commonly used when stitching UV-VIS and SWIR regions). Each spectrum is truncated at the detector transition wavelength, and one spectrum is chosen to include its original detector transition absorbance value. Then, the two truncated spectra are concatenated to create a single elongated spectrum.
Additional tips for acquiring high-quality absorption spectra include using a previously published spectrum of the sample of interest, even if it does not cover the full spectral range to be measured, to guide the measurements. Knowing a priori the wavelength range with the lowest absorbance, measurements can be started in this region with the highest concentration sample and then adjusted and diluted from there. It can help inform how many separate regions will need to be measured based on the magnitude of absorbance changes expected. It can also provide confidence that the expected spectrum has been obtained if it matches published spectra, or if it does not match published spectra, the sample preparation method can be re-examined along with issues that could be distorting the spectrum.
Absorption spectra may require postprocessing. For example, a digital moving average filter can be used to smooth absorption measurements and points of known error can be removed with a data set repair in which the erroneous points are deleted, and interpolation is performed between non-erroneous points.
Limitations of this method include inaccuracy for samples with optical scattering such as whole blood. To accurately measure hemoglobin, the blood sample is lysed and then syringe-filtered to remove most other residual cellular components that cause optical scattering. Similarly, this method is not used in vivo due to tissue scattering. While Beer-Lambert Law-based absorbance measurements may be tedious and sometimes difficult to perform, it is the gold standard method for pure optical absorption measurements. In addition, some solvents make it particularly challenging to acquire a pure absorbance spectrum of certain solutes. For example, oxygenated and deoxygenated hemoglobin's native solvent is water, but water's absorption is strong in the SWIR, dominating the oxygenated hemoglobin absorption. Therefore, we attempt to remove water from the blood via repeated centrifugation, removal of the supernatant, and re-constitution with deuterated water which has weaker SWIR absorption. The resulting oxygenated and deoxygenated hemoglobin spectra from whole heparinized human blood is suspected to contain small residual absorption due to water absorption from approximately 1,300 nm to 1,600 nm as seen in Figure 3. While likely not a perfect disentanglement of water from oxygenated and deoxygenated hemoglobin, we observe close alignment with highly cited published oxygenated and deoxygenated hemoglobin spectra from 400 nm to 1,000 nm and we extend the spectrum by several hundred nanometers2,3.
The protocols described herein will help researchers expand absorption spectra libraries to include VIS-SWIR spectra of a host of biological components and contrast agents. This knowledge can be used to improve understanding of basic biology and physiology through non-invasive biomedical imaging and sensing at deeper wavelengths than most systems currently operate. The addition of SWIR wavelengths broadens the type of tissue components that can be monitored non-invasively and could inform the development of novel monitoring and diagnostics. Furthermore, devices operating in the NIR and SWIR should help minimize skin pigmentation bias that has been reported for optical devices operating in the VIS and NIR ranges and is a promising strategy for creating equitable medical devices.
Disclosures
Christine O'Brien and Leonid Shmuylovich have a financial ownership interest in Armor Medical Inc. and may benefit financially if the company is successful in marketing its products that are related to this research.
Acknowledgements
This work is supported by grants from the National Institutes of Health (NIH) R00HD103954 and R21EB035823. Research reported in this publication was supported by the Washington University Institute of Clinical and Translational Sciences grant UL1TR002345 from the National Center for Advancing Translational Sciences (NCATS) of the National Institutes of Health (NIH). The content is solely the responsibility of the authors and does not necessarily represent the official view of the NIH. The authors would like to acknowledge assistance from O'Brien Lab members, Michael Vahey and his lab members, and Huanzhu Jiang.
Materials
| Name | Company | Catalog Number | Comments |
|---|---|---|---|
| 0.22 µm diameter syringe Filters | Sigma-Aldrich | SLGPM33RS | |
| 1000 µL Pipette | Millipore Sigma | EP3124000121 | |
| 200 µL Pipette | Millipore Sigma | EP3124000083 | |
| Conical Tubes | Avantor VWR | 21008-089 | |
| Corn Oil | Happy Belly | n/a | 48 Fl Oz |
| Deuterium Oxide | Cambridge Isotope Laboratories | DLM-4-100 | |
| Deuterium Oxide | Sigma-Aldrich | 7789-20-0 | |
| Dimethyl Sulfoxide (DMSO) | Sigma-Aldrich | D5879-1L | |
| Disposable 1 mL Syringe | BH Supplies | BH1LL | |
| Disposable Needle | Atshuhut/Amazon | 66941 | |
| Freezer (-80 °C) | Fisher Scientific | IUE386FARK | |
| Glass Beakers | Millipore Sigma | CLS1000PACK | |
| Glass or Quartz Cuvettes | Sigma-Aldrich | Z802875-1EA | 700 µL volume |
| Glass or Quartz Cuvettes | Thorlabs | CV10Q35EP | 3500 mL volume |
| Heparinized Human Blood | Lampire | 7203710 | |
| Microcentrifuge Tubes | Costar | 3213 | |
| Microcentrifuge--accuSpin Micro 17 | Fisher Scientific | 13-100-675 | |
| MilliQ Water | Millipore Sigma | ZMQSP0D01 | |
| OSRAM FCS 64640 150 W 24 V HLX Halogen Light Bulb | Amazon | B0001221DG | |
| Parafilm | Millipore Sigma | HS234526B | |
| Pipette Tips | Eppendorf | 22492055 | |
| Powdered Synthetic Melanin | Sigma-Aldrich | 8049-97-6 | |
| Scale | Sartorius | UX-11976-09 | |
| Sodium Dithionite | Sigma-Aldrich | 1065070500 | |
| Sonicator | Fisher Scientific | CPX1800 | |
| Spatula | Aozita | 000 00 0 1 2 3 | |
| UV/VIS/SWIR Spectrophotometer | On Line Instrument Systems | Olis Cary 14 | |
| Weigh Boats | Amazon | B07M5RMNPF |
References
- Cao, Q., Zhegalova, N. G., Wang, S. T., Akers, W. J., Berezin, M. Y. Multispectral imaging in the extended near-infrared window based on endogenous chromophores. J Biomed Opt. 18 (10), 101318(2013).
- Yao, J., Wang, L. V. Sensitivity of photoacoustic microscopy. Photoacoustics. 2 (2), 87-101 (2014).
- Jacques, S. L. Optical properties of biological tissues: a review. Phys Med Biol. 58 (11), R37(2013).
- Prahl, S. A. Optical absorption of hemoglobin. , https://omlc.org/spectra/hemoglobin/ (1999).
- Zhang, H., et al. Penetration depth of photons in biological tissues from hyperspectral imaging in shortwave infrared in transmission and reflection geometries. J Biomed Opt. 21 (12), 126006(2016).
- Du, T., et al. Hyperspectral imaging and characterization of allergic contact dermatitis in the short-wave infrared. J Biophotonics. 13 (9), e202000040(2020).
- Roggan, A., Friebel, M., Dörschel, K., Hahn, A., Mueller, G. J. Optical properties of circulating human blood in the wavelength range 400-2500 nm. J Biomed Opt. 4 (1), 36-46 (1999).
- Kuenstner, J. T., Norris, K. H. Spectrophotometry of human hemoglobin in the near infrared region from 1000 to 2500 nm. J Near Infrared Spectrosc. 2 (2), 59-65 (1994).
- Smith, B. C. Spectral subtraction. , https://www.spectroscopyonline.com/view/spectral-subtraction (2021).
- Sjoding, M. W., Dickson, R. P., Iwashyna, T. J., Gay, S. E., Valley, T. S. Racial bias in pulse oximetry measurement. N Engl J Med. 383 (25), 2477-2478 (2020).
- Fawzy, A., et al. Racial and ethnic discrepancy in pulse oximetry and delayed identification of treatment eligibility among patients with COVID-19. JAMA Intern Med. 182 (7), 730-738 (2022).
- Sudat, S. E. K., et al. Racial disparities in pulse oximeter device inaccuracy and estimated clinical impact on COVID-19 treatment course. Am J Epidemiol. 192 (5), 703-713 (2023).
- Keller, M. D., Harrison-Smith, B., Patil, C., Arefin, M. S. Skin colour affects the accuracy of medical oxygen sensors. Nature. 610 (7932), 449-451 (2022).
- Butler, W. L. Absorption spectroscopy of biological materials. Methods Enzymol. 24, 3-25 (1972).
- Tang, J., et al. Calculation extinction cross sections and molar attenuation coefficient of small gold nanoparticles and experimental observation of their UV-vis spectral properties. Spectrochim Acta A Mol Biomol Spectrosc. 191, 513-520 (2018).
- Rossman, G. R. Optical spectroscopy. Rev Mineral Geochem. 78 (1), 371-398 (2014).
- Thimsen, E., Sadtler, B., Berezin, M. Y. Shortwave-infrared (SWIR) emitters for biological imaging: a review of challenges and opportunities. Nanophotonics. 6 (5), 1043-1054 (2017).
- Briely-Sabo, K., Bjornerud, A. Accurate de-oxygenation of ex-vivo whole blood using sodium dithionite. Proc Intl Sot Mag Reson Med. 8, 2025(2020).
- Skoog, D. A., Holler, F. J., Crouch, S. R. Principles of instrumental analysis. Cengage Leaning. , (2019).
- Hale, G. M., Querry, M. R. Optical constants of water in the 200-nm to 200-microm wavelength region. Appl Opt. 12 (3), 555-563 (1973).
- Sarna, T., Sealy, R. Photoinduced oxygen consumption in melanin systems. Action spectra and quantum yields for eumelanin and synthetic melanin. Photochem Photobiol. 39 (1), 69-74 (1984).
- Nordlund, J. J., et al. The physical properties of melanins. The pigmentary system: Physiology and pathophysiology. , Blackwell Publishing Ltd. 311-341 (2006).
- Crippa, P., Cristofoletti, V., Romeo, N. A band model for melanin deduced from optical absorption and photoconductivity experiments. Biochim Biophys Acta. 538 (1), 164-170 (1978).
- van Veen, R., et al. Determination of visible near-IR absorption coefficients of mammalian fat using time- and spatially resolved diffuse reflectance and transmission spectroscopy. J Biomed Opt. 10 (5), 054004(2005).
Reprints and Permissions
