Optimizing in vitro transcription (IVT) is critical for cost-effective mRNA production. This protocol details an analytical chromatographic method for at-line analysis of IVT reaction, monitoring NTP depletion and mRNA production in batch or fed-batch modes, applicable to various RNA modalities, enhancing productivity and reducing costs.
Method Article
Optimization of In vitro Transcription Reaction for mRNA Production Using Chromatographic At-Line Monitoring
* These authors contributed equally
In This Article
Summary
Abstract
In vitro transcription reaction (IVT) is a complex, multi-component enzymatic synthesis of mRNA from a linear DNA template, catalyzed by an RNA polymerase, e.g. T7. Due to the high cost of IVT reagents, IVT is a critical step in the mRNA drug substance production process and has been the focus of intense optimization in the field. To decrease the cost of mRNA production, reagents must be utilized optimally. Effective optimization necessitates a comprehensive understanding of the impact of individual reagents on reaction kinetics, i.e., the consumption of nucleoside triphosphates (NTPs) and the production of mRNA. Traditionally, low-throughput, end-point analytical techniques have been used for the analysis of mRNA. Though such methods give valuable information on mRNA content, at-line, near real-time analytics is needed to fully understand IVT reaction. We demonstrate how a liquid chromatography analytical method that separates NTPs, as well as pDNA and mRNA, can be used in near real-time to study IVT reaction kinetics. With the knowledge of the influence of different IVT components on kinetics and yield, rapid chromatographic analysis can be used to convert batch IVT reaction into a fed-batch mode that further increases productivity and reduces the overall cost of the reaction.
Introduction
The COVID-19 pandemic has catalyzed an unprecedented revolution in biomedicine, leading to the rapid development and authorization of mRNA-based vaccines, such as BioNTech/Pfizer's Comirnaty and Moderna's Spikevax, in both Europe and the USA1,2,3. The impressive efficacy and rapid development of these vaccines have highlighted the immense therapeutic potential of mRNA technology, not only for infectious diseases but also for cancer immunotherapies, protein replacement therapies, regenerative medicine, and cellular reprogramming4,5. This era, often referred to as the mRNA revolution, underscores the need for efficient and cost-effective mRNA production processes.
The production of mRNA involves multiple unit operations, with the in vitro transcription (IVT) reaction being a critical and most cost-intensive unit operation6,7,8. The IVT reaction synthesizes mRNA from a DNA template using RNA polymerase, typically T7 RNA polymerase, and nucleoside triphosphates (NTPs) in the presence of magnesium ions. The process is relatively simple and allows for the production of large amounts of mRNA in a short time frame, achieving reaction yields of 2-5 g/L within a few hours and up to 14 g/L in some reports9,10,11. However, optimization of IVT reaction yield is crucial for reducing production costs and ensuring the scalability of mRNA vaccines and therapeutics12 and, due to sequence differences that influence NTP consumption, may be required for each construct or construct family.
The reaction is usually performed as a batch process, but recent advances in fed-batch processing and at-line analytics have opened new avenues for optimizing mRNA production7,13. Fed-batch reactions, which involve a bolus or continuous addition of reagents, can potentially extend reaction times and increase yields by preventing substrate inhibition and co-factor-dependent product degradation14,15.
The development of fast at-line analytics has been a significant advance in the field of IVT, enabling the monitoring of key reaction components such as NTPs and mRNA with minimal analytical lag13,16, adding an additional dimension to IVT monitoring, which is typically only focused on mRNA concentration17. Traditionally, mRNAs have been analyzed using techniques such as polyacrylamide gel electrophoresis (PAGE), agarose gel electrophoresis, or capillary electrophoresis. These are end-point methods and, therefore, cannot be used for real-time IVT monitoring. An alternative to analytics described in this protocol are methods using light-up RNA aptamer and fluorescence dye pairs. In this method, RNA aptamer is tagged to RNA and incubated with a light-up fluorescence dye. Transcription activity can then be visualized by fluorescence intensity17. This enables real-time analysis of the quantity and quality of transcribed mRNA during IVT 21 but does not allow simultaneous monitoring of other IVT components, e.g., NTPs. Another alternative that potentially affords real-time quantification of NTP and mRNA is Raman spectroscopy18, but to date, no report has shown its usefulness for IVT monitoring, suggesting that further optimization of the method is still required to derive the necessary selectivity and sensitivity.
Continuous development of faster and more selective analytics supports the optimization of IVT for higher yield in batch and fed-batch modes. The reaction remains a complex, multi-parameter process with multiple interacting factors, for which optima may differ between construct types (e.g., mRNA vs saRNA). The concentration and ratio of Mg2+ ions and NTPs are particularly influential, and their optimal levels must be carefully balanced to maximize mRNA yield while minimizing the formation of double-stranded RNA (dsRNA), a potent stimulant of the innate immune system19,20. Recently, feeding UTP at steady-state levels was reported as an approach to reduce dsRNA formation21. Monitoring UTP levels in near-real time would add an additional level of process control.
In this protocol, we demonstrate how at-line monitoring of the IVT reaction can increase the yield of mRNA production in batch and fed-batch mode.
Protocol
1. Buffer preparation
NOTE: All buffers must be prepared RNase-free, meaning that all chemicals and glassware must be used only for RNase-free work and handled with precaution. Water used for buffer preparation and cleaning of glassware must be certified as nuclease-free. Before conducting an experiment, all work surfaces and glassware must be sprayed with a decontamination reagent that eliminates RNases. The decontamination reagent must be thoroughly washed away with RNase-free water before glassware/work area is used. If possible, use sterile and one-use-only consumables.
- Preparation of IVT buffers: prepare 10x IVT buffer by adding 400 mM Tris, 10 mM DTT, 20 mM spermidine, pH 7.9. Prepare a quenching buffer containing 100 mM EDTA, pH 8. Filter each buffer through a 0.22 µm PES filter.
- Preparation of mobile phases: prepare mobile phase A (MPA) by adding 50 mM HEPES, pH 7.0, mobile phase B (MPB) by adding 50 mM HEPES, 100 mM Na4P2O7, pH 8.3, mobile phase C (MPC) by adding 0.1 M NaOH, 1 M NaCl, mobile phase D (MPD) by adding 0.5 M HEPES, pH 7.0. Filter each buffer through a 0.22 µm PES filter.
2. Preparation of in vitro transcription reaction (IVT)
NOTE 1: IVT reaction can be a batch reaction, where all reagents are added at the beginning, and the reaction is stopped after NTPs are depleted/mRNA production reaches a plateau, or can be a fed-batch reaction, where depleted NTPs are replenished with additional NTPs and with that mRNA production additionally increases. Linear pDNA template used in IVT reaction can be obtained by using restriction enzyme that cleaves right after poly(A) sequence in plasmid DNA or by PCR reaction. In both cases the reaction must be followed by purification, either chromatographic or using commercial DNA purification kits.
- Batch IVT reaction
- Set thermoblock to 37 °C and 300 rpm. Thaw all reagents listed in Table 1 except enzymes and pre-heat them at 37 °C in the thermoblock. Prepare 25 mM NTP mixture using 100 mM stock solution of ATP, CTP, UTP, and GTP.
- While reagents are thawing, prepare sample aliquots for time course experiment. Take 0.5 mL sterile tubes and pipette 2 µL of 100 mM EDTA into each tube. Mark each tube with a designated IVT number (e.g., IVT001, IVT002, etc.) and time point (e.g., 0 min, 15 min, 30 min, 60 min, etc.).
- When reagents are thawed and kept at 37 °C for approximately 15 min, remove enzymes (T7 RNA Polymerase, Pyrophosphatase, Rnase Inhibitor) from -20 °C freezer and keep it in a cooler until stored back in the freezer.
- For mixing individual IVT reagents (except enzymes), use a vortex. Mix enzymes by gently pipetting up and down.
- Mix IVT reagents in ratios set in the experimental design (e.g., generic IVT protocol is shown in Table 1) in a 1.5 mL tube. When performing IVT optimization, the final IVT volume can range between 50-100 µL. When designing the total IVT volume, consider the number of 2 µL samples to be taken out of the reaction during time course experiment. Ensure the total volume of samples does not exceed 50% of total IVT volume (e.g., if sampling 2 µL every 15 min for 3 h, the total volume of aliquots taken is 30 µL, meaning the total volume of IVT should be 60 µL minimum).
- Mix IVTs carefully, add T7 RNA Polymerase as the last reagent. When all reagents are added, mix IVT thoroughly by pipetting up and down, do not use vortex.
- Immediately after all IVT reagents are added and homogenized, remove 2 µL of IVT mixture from the tube and pipette it into previously prepared 0.5 mL tubes containing 2 µL of 100 mM EDTA described in step 2.1.2 (timepoint 0 min).
- Put reaction tubes containing IVT reaction mixtures in a thermoblock and incubate them at 37 °C.
- Set timer to desired time intervals (e.g., 15 min/30 min). At each timepoint take 2 µL of an IVT sample out of each prepared IVT reaction mixtures and pipette it into previously prepared tube (see step 2.1.2) containing 2 µL of 100 mM EDTA. These aliquotes will be used for chromatographic analysis (see step 3).
- After chromatographic analysis confirms complete depletion of NTPs, quench bulk IVT reactions with EDTA to a final concentration of 50 mM (e.g. 30 µL of IVT inactivate with 30 µL of 100 mM EDTA).
- Fed-batch IVT reaction
NOTE: mRNA production can be additionally increased by adding NTPs and Mg2+ ions after NTPs are depleted.- Mix batch IVT reaction and sample it as described in step 2.1. Prepare NTP+MgCl2 feed for fed batch. To prepare, e.g. 500 µL of NTP+MgCl2 mixture, mix 106 µL of each 200 mM NTP, 76.25 µL of 1 M MgCl2 and 5.5 µL of ddH2O. The final concentrations in the mixture are 42.4 mM each NTP and 152.5 mM MgCl2.
- Monitor NTP consumption with at-line analytics described in step 3. When at-line analytics confirms the NTP concentration to drop under 10% of the starting concentration, add the feed containing NTP+Mg2+ to bulk IVT.
- Measure/calculate the precise volume of bulk IVT reaction remaining in a 1.5 mL tube after all aliquots are taken for analytics. Add an appropriate volume of NTP+MgCl2 mixture to an IVT so that the final concentration is 4 mM of each NTP and 12 mM of MgCl2. For example, for 80 µL of bulk IVT left in a 1.5 mL tube, add 16.8 µL of NTP+MgCl2 mixture.
- Continue with sampling as written in step 2.1. After NTPs are depleted again, repeat section 2.2.2. Continue with feeding and sampling until desired mRNA production is achieved.
- After desired mRNA production is achieved, inactivate the whole reaction as in step 2.1.10.
3. Preparation of chromatographic analysis
- Standard and system suitability test (SST) preparation
- Prepare the SST by combining capping reagent, NTPs, pDNA template, and mRNA. Ensure the final concentrations are approximately 3 µM for the capping reagent, 5 µM for each NTP, 4 ng/µL for the pDNA template, and 10 ng/µL for the mRNA. Ensure the final SST contains 0.1 M NaCl.
- Prepare a new calibration curve before each analysis. Create the calibration standard by diluting a purified mRNA sample of known concentration with MPA. The calibration points should be 0.5 ng/µL, 2 ng/µL, 5 ng/µL, 10 ng/µL, 15 ng/µL, and 20 ng/µL, each with a final concentration of 0.1 M NaCl.
- If needed, prepare a calibration curve for all NTPs. Ensure the final concentrations of each NTP in the calibration standards are 0.5 µM, 2 µM, 5 µM, 10 µM, 15 µM, and 20 µM.
- Column conditioning and preparation for analysis
- Equilibrate 0.1 mL analytical column at room temperature for 12 h prior to analysis. Attach the column to the chromatographic system in the direction indicated on the column housing.
- Flush the column with a 1 mL/min flow rate: first with 50 column volumes (CV) of ddH2O and after with 50 CV of MPA.
- Run at least 3 blank samples (injecting only MPA) before analysis to set the baseline. Use the chromatographic method described in Skok et al.15.
- Once the baseline is stable and two consecutive blank measurements are comparable (reproducible baseline), proceed to run the SST sample and the calibration curve samples.
- If the SST criteria are met and the separation of the capping reagent and NTPs is satisfactory, proceed with the analysis of the IVT samples. After analyzing all IVT samples, inject an SST standard again to confirm that the system conditions remained stable throughout the analysis.
- Sample preparation
NOTE: Samples for chromatographic analysis are prepared immediately before analysis. Otherwise, the samples are kept in a freezer at -20 °C (maximum 24 h) or <-65 °C (more than 24 h).- Before dilution for chromatographic analysis, vortex and spin down the quenched IVT sample. Analyze all EDTA-inactivated IVT samples (see step 2.1.9) with chromatographic analysis using the method described in Skok et al.15.
- Before analysis, dilute the IVT samples to achieve concentration within the calibration curve. Use the same dilution factor throughout the time course experiment to ensure that NTP areas can be compared to determine when an NTP is depleted.
- To determine the minimal dilution needed for IVT samples, use the following formula: Dilution needed = (expected end mRNA concentration) / (dilution during inactivation) / (highest calibration standard)
For example, if an mRNA production of 8 mg/mL is expected in IVT, the concentration in quenched sample will be 4 mg/mL. To achieve concentration within the calibration curve, further dilute the sample 200-fold.
Dilution needed = (8000 ng/µL]) / 2 / (20 ng/µL) = 200 - Pipette the MPA and 4 M NaCl into a conical glass vial. Ensure the final concentration of NaCl in the sample is 100 mM. Lastly, add the quenched IVT sample.
- Vortex prepared the sample and insert it into the autosampler for analysis. Set the autosampler temperature to 4 °C.
- Inject 100 µL of diluted samples onto the analytical column. Measure absorbance A260 and A280 for each IVT sample.
- For analyzing samples with known concentrations, or if tracking NTP consumption based on area differences is not required, dilute the samples to achieve a target concentration of 10 ng/µL.
4. Sample quantification and data analysis
- Before the integration of each IVT sample, subtract the blank sample from the sample chromatogram.
- Integrate all NTP, pDNA, and mRNA peaks at A260 and use the peak areas to calculate the concentrations of NTPs and mRNA in the IVT.
NOTE: Alternatively, the peak areas can be used to compare the percentage of each NTP remaining in the IVT reaction, provided the dilution factor was consistent across all time points. - Based on mRNA/NTP concentrations, determined by at-line chromatographic analysis, decide if IVT can be inactivated or if additional NTPs should be fed into the IVT reaction (see step 2).
Results
The chromatographic analysis described in this protocol can be used either for IVT optimization or for converting a batch IVT reaction into a fed-batch reaction (Figure 1).
To test the effect of different buffer compositions on the kinetics of IVT reaction, three different IVT reactions were mixed according to the protocol written in Table 2. Buffer containing Tris, where pH was adjusted with HCl, was compared to Tris buffer, where pH was adjusted with acetic acid. Further, both Tris buffers were compared with the HEPES buffer, where pH was adjusted with NaOH. All 1x IVT buffer's composition was 40 mM Tris/HEPES, 10 mM DTT, 2 mM spermidine, and pH 7.9.
From 100 µL of IVT reactions mix, 2 µL of IVT sample was taken out of the IVT reaction and quenched with 2 µL of 100 mM EDTA every 15 min in the first hour of incubation and then every 30 min until 180 min of incubation. The expected final mRNA yield for this reaction condition was 15 mg/mL, meaning that 2-fold dilution due to quenching was followed by 400-fold dilution in MPA+NaCl for analysis. The sample was diluted 800-fold in total, meaning that even at 15 mg/mL production, mRNA concentration loaded onto the analytical chromatographic column was still within calibration curve concentrations.
NTP and mRNA areas at A260 were integrated for each individual sample at each individual timepoint (tx). Areas were then converted into concentrations for mRNA, using the mRNA calibration curve and consumption percentage for NTPs, using A260 area of NTPs at 0 min (t0) as a 100% (see equation below).

Results can be shown as graphs for each individual IVT reaction, where time is shown on the x-axis and mRNA concentration and remaining NTPs are shown on the y-axis (Figure 2A). All IVT, meaning mRNA concentrations in dependence on time, can also be plotted together in one graph, and mRNA production kinetics can be studied and optimal IVT conditions selected (Figure 2B).
For the fed-batch experiment, IVT was mixed as written in Table 3. From 300 µL of IVT reaction mix, 2 µL of IVT sample was removed from the IVT reaction and quenched with 2 µL of 100 mM EDTA every 30 min. Additionally, the sample was taken immediately after each bulk NTP+MgCl2 addition. A feed solution containing 42.4 mM of each NTP and 152.5 mM MgCl2 was prepared in advance, and 106 µL of each individual 200 mM NTP was mixed with 76.2 µL of 1 M MgCl2. A feeding regime was established, where bolus feed was added every hour (at 60 min, 120 min, 180 min, and 240 min of incubation). The feeding regime is described in Table 3 Samples were analyzed in near real-time with analytics as described for bulk IVT reaction. After 300 min of monitoring the IVT reaction was quenched.
Results can be shown as remaining NTPs/mRNA production over time of incubation. Since bolus feed additions also dilutes IVT reaction, mRNA concentration in IVT drops at each feed addition (Figure 3A). Increase in mRNA mass can also be measured and presented by transcription factors (defined as mmRNA/mpDNA), showing linear increase in mRNA production over time (Figure 3B).
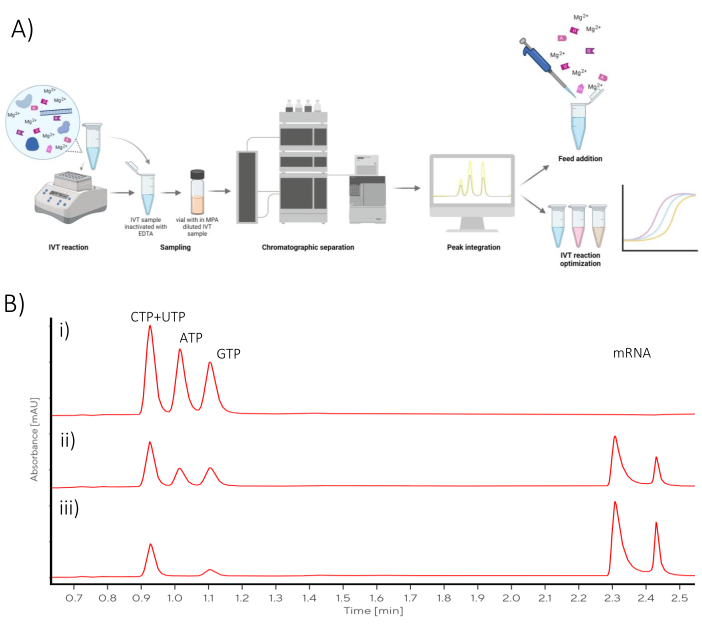
Figure 1: Schematic overview (A) Representation of IVT optimization workflow with at-line chromatographic analysis quantification of NTPs and mRNA. (B) Representative chromatograms of a batch IVT reaction sampled at (i) t0, (ii) mid-point, (iii) final reaction time-points. Please click here to view a larger version of this figure.

Figure 2: Batch IVT graphs. (A) Representative graph of IVT reaction with mRNA production and NTP consumption on the y-axis. mRNA concentration plateau visible at 120 - 180 min of incubation which correlates with NTP consumption as limiting NTP (ATP) is consumed at 120 min. (B) IVT graph showing the influence of IVT buffer on IVT kinetics. IVT containing Buffer A (Tris+acetic acid) showed the fastest mRNA production, followed by Buffer B (Tris+HCl) and Buffer C (HEPES+NaOH) as the slowest. Please click here to view a larger version of this figure.
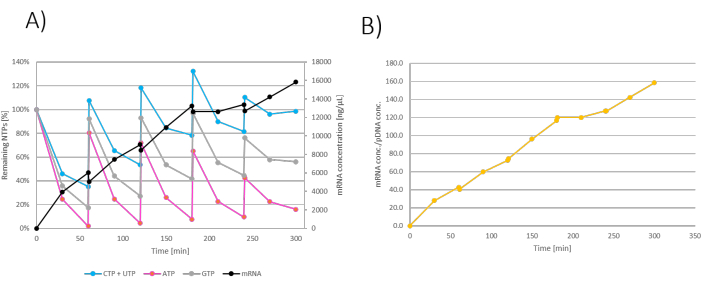
Figure 3: Fed-batch IVT graph. (A) IVT graph where NTP+MgCl2 feeds were added at 60-, 120-, 180-, and 240-min. mRNA concentration in the IVT reaction drops at every feed addition due to dilution with NTP+MgCl2 feed. (B) Increase in mRNA mass showed by transcription factor is linear throughout the reaction incubation. Please click here to view a larger version of this figure.
Table 1: Generic IVT protocol. Please click here to download this Table.
Table 2: Batch IVT protocol. Please click here to download this Table.
Table 3: Fed-batch IVT protocol. Please click here to download this Table.
Discussion
In this method, IVT samples are analyzed at different time points during incubation using an analytical chromatographic multimodal column that separates NTPs, pDNA, and mRNA, thus allowing close monitoring of NTP consumption and mRNA production. This method measures NTPs and mRNA concentration in a quantitative manner based on changes in A260 areas at designated time points. Since the method provides information on NTP and mRNA concentration, it is highly suitable for IVT optimization, where the primary goal is often to maximize mRNA yield and minimize reaction time; therefore, understanding the effect of different IVT reagents on the kinetics of mRNA production is critical22. We show how at-line monitoring can be applied to optimize IVT reaction in batch and fed-batch modes.
The main advantage of this method is an at-line analysis that allows for near-real-time monitoring of IVT as each sample is analyzed in sub-8 min. Preparation of samples for analytics is straightforward, as only dilution in MPA is required without any prior sample pre-treatment. The sample volume required for analysis is very low, e.g., 1 µL of IVT. This small pipetting volume could potentially result in analytical deviations due to pipetting errors. However, as the high throughput of the analytical approach allows for triplicate measurements, outliers are easily identifiable, and deviations from the expected kinetic curve are not hard to detect.
One of the limitations of the method is the chromatographic co-elution of UTP and CTP. Precise quantification of UTP and CTP is usually not necessary as the limiting NTP in an mRNA sequence is often either ATP or GTP. If separate quantification of UTP and CTP is required, the difference in UV absorbance at 260 nm and 280 nm for UTP and CTP can be harnessed to derive the relative abundance of each NTP in the chromatographic peak.
This analytical method does not separate RNA species above 100 nucleotides in length; therefore, it cannot be used to detect differences in mRNA quality, e.g., it does not differentiate between non-polyadenylated and polyadenylated mRNA, between dsRNA or abortive transcripts and ssRNA and is not suitable for stability studies as it cannot differentiate between degraded and nondegraded mRNA. However, the method can be utilized for the quantification of other RNA modalities, such as circRNA, tRNA, and saRNA. Although these molecules vary in size and structure, the same analytical method can be employed to study the production yields of each in an IVT reaction.
Disclosures
The authors have nothing to disclose.
Acknowledgements
The authors would like to thank Tomas Kostelec, Blaž Bakalar, Nejc Pavlin, Andreja Gramc Livk, and Anže Martinčič Celjar for helpful discussions.
Materials
| Name | Company | Catalog Number | Comments |
|---|---|---|---|
| 0.22 µm PES membrane filter, e. g. Sartolab BT 500 | Sartorius | 180E14---------E | |
| 0.5 mL plastic tubes; e. g. e. g. DNA LoBind, PCR clean | Eppendorf | 30108035 | |
| 1.5 mL plastic tubes; e. g. DNA LoBind, PCR clean | Eppendorf | 30108051 | |
| ATP Solution | MEBEP BIOSCIENCE | R1331T2 | |
| Benchtop cooler -20 °C | Brand | 114935 | |
| CIMac PrimaS 0.1 mL Analytical Column (2 µm) | Sartorius BIA Separations | 110.5118-2, 2 µm channels | |
| CTP Solution | MEBEP BIOSCIENCE | R3331T2 | |
| DTT | Sigma | 10197777001 | |
| EDTA-Na2 x 2H2O | Kemika | e.g. 11368 08 | |
| GTP Solution | MEBEP BIOSCIENCE | R2331T2 | |
| HEPES | Merck | 1.10110.1000 | |
| HPLC high recovery vial | Macherey-Nagel | 702860 | |
| MgCl2 | Invitrogen | AM 9530G | |
| Microvolume spectrophotometer | Thermo Scientic | Nanodrop | |
| mRNA standard, mFix4, 4000 nt | Sartorius BIA Separations | BIA-mFix4.1.1 | |
| Na4P2O7 + 10 H2O | Sigma | S6422-500G | |
| NaCl | Fluka | 31434-1KG-M | |
| NaOH | Merck | 1064691000 | |
| PATfix mRNA analytical platform | Sartorius BIA Separations | PAT0021 | |
| Pipette 100 – 1000 μL | Eppendorf | Reference 2 | |
| Pipette 2 – 10 μL | Eppendorf | Reference 2 | |
| Pipette 20 – 200 μL | Eppendorf | Reference 2 | |
| Pyrophosphatase | MEBEP BIOSCIENCE | M2403L | |
| Rnase Away Decontamination Reagent | Thermo Scientic | 10328011 | |
| RNAse inhibitor | MEBEP BIOSCIENCE | RNK3501 | |
| Spermidine | Sigma | 85558-5G | |
| T7 mRNA polymerase | MEBEP BIOSCIENCE | TR01 | |
| Thermoblock | Thermo Scientic | EPPE5382000.015 | |
| Trizma Base | Sigma | T6066-1KG | |
| UTP Solution | MEBEP BIOSCIENCE | R5331T2 | |
| Vial caps | Macherey-Nagel | 70245 | |
| Vortex | IKA | V1900 |
References
- Barbier, A. J., Jiang, A. Y., Zhang, P., Wooster, R., Anderson, D. G. The clinical progress of mRNA vaccines and immunotherapies. Nat Biotechnol. 40, 840-854 (2022).
- Baden, L. R., et al. Efficacy and safety of the mRNA-1273 SARS-CoV-2 vaccine. N Engl J Med. 384 (5), 403(2021).
- Lopez Bernal, J., et al. Effectiveness of Covid-19 Vaccines against the B.1.617.2 (Delta) Variant. N Engl J Med. 385 (7), 585-594 (2021).
- Sahin, U., Karikó, K., Türeci, Ö mRNA-based therapeutics - developing a new class of drugs. Nat Rev Drug Discov. 13, 759-780 (2014).
- Baptista, B. R., Carapito, N., Pichon, C., Sousa, F. mRNA, a revolution in Biomedicine. Pharmaceutics. 13, 2090(2021).
- Rosa, S. S., Prazeres, D. M. F., Azevedo, A. M., Marques, M. P. C. mRNA vaccines manufacturing: Challenges and bottlenecks. Vaccine. 39, 2190(2021).
- Whitley, J., et al. Development of mRNA manufacturing for vaccines and therapeutics: mRNA platform requirements and development of a scalable production process to support early phase clinical trials. Transl. Res. 242, 38-55 (2022).
- Kis, Z., Kontoravdi, C., Shattock, R., Shah, N. Resources, production scales and time required for producing RNA vaccines for the global pandemic demand. Vaccines. 9 (1), 3(2021).
- Hengelbrock, A., Schmidt, A., Helgers, H., Vetter, F. L., Strube, J. Scalable mRNA machine for regulatory approval of variable scale between 1000 clinical doses to 10 million manufacturing scale doses. Processes. 11, 745(2023).
- Rosa, S. S., et al. Maximizing mRNA vaccine production with Bayesian optimization. Biotechnol Bioeng. 119 (11), 3127-3139 (2022).
- Sari, Y., Sousa, S. S., Jeffries, J., Marques, M. P. C. Comprehensive evaluation of T7 promoter for enhanced yield and quality in mRNA production. Sci Rep. 14, 9655(2024).
- Kumar, A., et al. The mRNA vaccine development landscape for infectious diseases. Nat Rev Drug Discov. 21 (5), 333-334 (2022).
- Pregeljc, D., et al. Increasing yield of in vitro transcription reaction with at-line high pressure liquid chromatography monitoring. Biotechnol Bioeng. 120 (3), 737-747 (2023).
- Kern, J. A., Davis, R. H. Application of a fed-batch system to produce RNA by in vitro transcription. Biotechnol Prog. 15 (2), 174-184 (1999).
- Skok, J., et al. Gram-Scale mRNA Production Using a 250-mL Single-Use Bioreactor. Chemie Ingenieur Technik. 94 (12), 1928-1935 (2022).
- Welbourne, E. N., et al. Anion exchange HPLC monitoring of mRNA in vitro transcription reactions to support mRNA manufacturing process development. Front Mol Biosci. 11, 1250833(2024).
- Lee, K. H., Song, J., Kim, S., Han, S. R., Lee, S. W. Real-time monitoring strategies for optimization of in vitro transcription and quality control of RNA. Front Mol Biosci. 10, 1229246(2023).
- Matuszczyk, J. C., et al. Raman spectroscopy provides valuable process insights for cell-derived and cellular products. Curr Opin Biotechnol. 81, 102937(2023).
- Mu, X., Hur, S. Immunogenicity of in vitro-transcribed RNA. Acc Chem Res. 54 (21), 4012-4023 (2021).
- Cho, E., et al. Mesoporous silica particle as an RNA adsorbent for facile purification of in vitro-transcribed RNA. Int J Mol Sci. 24 (15), 12408(2023).
- Ziegenhals, T., et al. Formation of dsRNA by-products during in vitro transcription can be reduced by using low steady-state levels of UTP. Front Mol Biosci. 10, 1291045(2023).
- Höfer, K., Langejürgen, L. V., Jäschke, A. Universal aptamer-based real-time monitoring of enzymatic RNA synthesis. J Am Chem Soc. 135 (37), 13692-13694 (2013).
Reprints and Permissions
