Sprouting angiogenesis, fundamental for development and disease, involves complex molecular and mechanical processes. We present a versatile 2.5D ex vivo model that analyzes cellular sprouting from porcine carotid arteries, revealing stiffness-dependent angiogenesis and distinct leader-follower cell mechanics. This model aids in advancing tissue engineering strategies and cancer therapy approaches.
Method Article
2.5D Model for Ex Vivo Mechanical Characterization of Sprouting Angiogenesis in Living Tissue
In This Article
Summary
Abstract
Sprouting angiogenesis is the formation of new blood vessels from pre-existing vasculature and is of great importance for physiological such as tissue growth and repair and pathological processes, including cancer and metastasis. The multistep process of sprouting angiogenesis is a molecularly and mechanically driven process. It consists of induction of cellular sprout by vascular endothelial growth factor, leader/follower cell selection through Notch signaling, directed migration of endothelial cells, and vessel fusion and stabilization. A variety of sprouting angiogenesis models have been developed over the years to better understand the underlying mechanisms of cellular sprouting. Despite advancements in understanding the molecular drivers of sprouting angiogenesis, the role of mechanical cues and the mechanical driver of sprouting angiogenesis remains underexplored due to limitations in existing models. In this study, we designed a 2.5D ex vivo model that enables us to mechanically characterize cellular sprouting from a porcine carotid artery using traction force microscopy. The model identifies distinct force patterns within the sprout, where leader cells exert pulling forces and follower cells exert pushing forces on the matrix. The model's versatility allows for the manipulation of both chemical and mechanical cues, such as matrix stiffness, enhancing its relevance to various microenvironments. Here, we demonstrate that the onset of sprouting angiogenesis is stiffness-dependent. The presented 2.5D model for quantifying cellular traction forces in sprouting angiogenesis offers a simplified yet physiologically relevant method, enhancing our understanding of cellular responses to mechanical cues, which could advance tissue engineering and therapeutic strategies against tumor angiogenesis.
Introduction
Angiogenesis is the process of new blood vessel formation from pre-existing blood vessels. This process is essential during embryonic development, wound healing, and cancer progression, all of which are associated with biomechanical changes in the microenvironment1,2,3,4. At the onset of angiogenesis, hypoxic or injured tissues release vascular endothelial growth factor (VEGF) that will activate the endothelial cells of neighboring blood vessels to form endothelial sprouts - where two distinct leader and follower phenotypes are adopted through the molecular Notch signaling pathway5. Upon the formation of endothelial sprouts, a phenomenon known as sprouting angiogenesis, leader cells will degrade the surrounding extracellular matrix to collectively migrate towards the VEGF stimulus without losing cell-cell adhesions with the trailing follower cells6,7.
Over the past decades, there have been increasing numbers of sprouting angiogenesis assays described that investigate collective cell migration through various methodologies, each offering distinct benefits and limitations. These assays assess the coordinated movement of cell groups, such as endothelial cells, through 3D matrices, allowing for the study of cellular behaviors like sprouting, invasion, and collective migration in a controlled environment8,9,10. In vivo sprouting angiogenesis assays provide a comprehensive evaluation within a living organism, capturing intricate interactions, but are time-consuming, costly, prone to high variability, and difficult to quantify11,12. In vitro sprouting angiogenesis assays allow precise control over experimental conditions with high reproducibility and precise quantification but may not fully replicate in vivo complexities11,12,13. In contrast, ex vivo sprouting angiogenesis assays, of which the aortic ring assay is the most widely-performed model, use tissues outside the organism, preserving physiological relevance while avoiding in vivo complications14,15,16. Despite being technically challenging and sometimes struggling with tissue viability, ex vivo models offer a valuable balance between complexity and control, making them a promising approach for studying sprouting angiogenesis. While these models have been used extensively to study the molecular drivers of sprouting angiogenesis, the effect of mechanical cues and the mechanical behavior of cells remain poorly understood.
Multicellular migration during sprouting angiogenesis is highly dependent on cellular mechanics, as actomyosin-based contractile forces regulate endothelial cell invasion into the surrounding extracellular matrix17,18,19,20. Specifically, non-muscle myosin II motors, the major actin-based contractile machines within the cell21, have been observed to control cellular contractile forces during sprouting angiogenesis22,23. The leader cell is likely the predominant force-generating element of the sprout since deformations of the surrounding 3D extracellular matrix are significantly higher around the leader cell, specifically nearby actin-rich cellular protrusions23,24, compared to its followers22,23,25. Despite this growing evidence of the importance of cellular contractility in sprouting angiogenesis in 3D, a method for spatiotemporal mechanical characterization of cellular mechanics of sprouting angiogenesis is lacking.
The overall goal of this study is to develop a method that allows for the mechanical characterization of cellular migration during sprouting. By achieving spatiotemporal characterization of mechanical forces in a biologically relevant context, we aim to provide new insights into how cellular mechanics influence angiogenic sprout formation. To this end, we developed a 2.5D model system by creating a 2D polyacrylamide (PAA) hydrogel, seeding a carotid arterial sheet on it, and covering it with a thin layer of collagen type I gel to establish a localized 3D environment for the cells. Multicellular sprouts migrated out of the arterial sheet on the PAA-collagen gel interface. The advantage of this method compared to existing techniques is that the 2D PAA hydrogel allows analyses by traction force microscopy (TFM) - a well-known versatile technique where cells adhere to an elastic 2D substrate and will deform the substrate upon cellular traction forces26. These deformations can be captured, and cellular traction forces can be computed based on the mechanical properties of the substrate26. By adapting TFM for use in ex vivo living tissues, we aim to bridge the gap between in vitro control and in vivo relevance, providing a more comprehensive understanding of mechanical forces during angiogenesis.
Protocol
Porcine carotid arteries were used in this protocol. Porcine carotid arteries were harvested from Dutch Landrace hybrid pigs - aged 5-7 months and weight (alive) 80-120 kg - obtained from a local slaughterhouse. The protocols were compliant with the EC regulations 1069/2009 regarding slaughterhouse animal material for diagnosis and research as supervised by the Dutch Government (Dutch Ministry of Agriculture, Nature, and Food Quality) and were approved by the associated legal authorities of animal welfare (Food and Consumer Product Safety Authority). Ethical approval was not required since tissue was harvested from byproducts of already terminated animals. The time between death and tissue transport is 10-25 min, depending on the slaughterhouse.
NOTE: The Table of Materials summarizes details about the materials, equipment, and reagents used in this protocol. Protocols for 2D and 3D samples are described in the Supplementary File 1.
1. Preparation of 2D polyacrylamide (PAA) substrates
- In the fume hood, prepare bind-silane solution by mixing 12:1:1 absolute ethanol (for synthesis), acetic acid, and bind-silane at 4286 µL, 357 µL, and 357 µL, respectively. Incubate 120 µL/well bind-silane solution on a glass bottom 12 well plate for 1 h at room temperature.
CAUTION: Absolute ethanol is a highly flammable liquid and vapor (H225) and causes serious eye irritation (H319). Acetic acid is a flammable liquid and vapor (H226) and causes severe skin burns and eye damage (H314). Wear personal protective equipment and work in a fume hood. - In the fume hood, wash the glass-bottom 12-well plate 3x with absolute ethanol (industrial) using a spray bottle. Discard the ethanol.
- Dry the glass bottom 12-well plate using nitrogen gas. If a white glace appears on top of the glass bottom, washing was not sufficient. Rewash the glass bottom 12 well plate.
- Prepare the PAA gel mixture according to the ratios in Table 1.
- Add PBS to a microcentrifuge tube and resuspend 40% acrylamide, 2% bis-acrylamide, and fluorescent markers in the gel mixture. Vortex the solution right before gel preparation.
- As fast as possible, add 10% APS and TEMED to the solution and vortex after the addition of each element. Pipet a droplet of 11.5 µL of gel mixture on the glass bottom of each well and gently place a 13 mm coverslip on top of the droplet.
- Gently tap and swirl the plate to evenly spread the gel mixture under the coverslip. If air bubbles appear, remove them by gently lifting the coverslip. Leave the gels to polymerize for 1 h at room temperature. Check polymerization using the remaining gel mixture in the tube. Polymerized PAA gels in the 12-well plate will display an inner halo.
CAUTION: Acrylamide is harmful if swallowed or if inhaled (H302 + H332), causes skin irritation (H315), may cause an allergic skin reaction (H317), causes serious eye irritation (H319), may cause genetic defects (H340), may cause cancer (H350), suspected of damaging fertility (H361f), and causes damage to organs through prolonged or repeated exposure if swallowed (H372). APS may intensify fire (oxidizer, H272), harmful if swallowed (H302), causes skin irritation (H315), may cause an allergic skin reaction (H317), causes serious eye irritation (H319), may cause allergy or asthma symptoms or breathing difficulties if inhaled (H334), and may cause respiratory irritation (H335). TEMED is a highly flammable liquid and vapor (H225), harmful if swallowed (H302), causes severe skin burns and eye damage (H314), and is toxic if inhaled (H331). Wear personal protective equipment.
- After polymerization, add PBS to the well. Using tweezers and/or a bent needle, gently lift and remove the coverslip. Wash gels once in PBS.
- To facilitate collagen coating of the PAA gels, gels need to be functionalized using the crosslinker Sulfo-SANPAH. Add 75 µL of 1 mg/mL Sulfo-SANPAH dissolved in ultrapure water to the PAA gel and incubate for 5 min under 365 nm UV light.
NOTE: Keep Sulfo-SANPAH protected from light and add ultrapure water right before UV incubation. A discoloration is visible from light red (before UV-light incubation) to dark red (after UV-light incubation).
CAUTION: Sulfo-SANPAH causes serious eye irritation (H319). - In the biosafety cabinet, perform a quick sterile PBS wash of the Sulfo-SANPAH on the gels. Consequently, wash the functionalized PAA gels 2x in sterile PBS for 10 min.
NOTE: Starting from this point in the protocol, all steps will be performed under sterile conditions. - In the biosafety cabinet, prepare a 0.1 mg/mL collagen type IV solution in PBS on ice. Pipet 50 µL of 0.1 mg/mL collagen type IV droplet on top of the functionalized PAA gel and incubate overnight at 4 °C.
- Wash the gels 2x in sterile PBS. Remove the PBS and leave the gels to dry for 5 min.
- Pipet a 50 µL droplet of endothelial cell growth (ECG) medium on top of the gels and incubate for at least 1 h at 37 °C and 5% CO2.
NOTE: Incubating the gels in the ECG medium improves cell and tissue attachments to the gels.
2. Preparation of modified Krebs solution for transport
NOTE: Prepare the modified Krebs solution fresh. In this protocol, the modified Krebs solution is prepared 1 day before tissue harvesting.
- Sterilize a transport bottle by autoclaving. Fill a glass bottle with 90% (315 mL) of the total required transport volume (350 mL) of ultrapure water. Ensure water temperature is 15-20 °C.
- While gently stirring the water using a stirring magnet, add 9.6 g/L (3.36 g) Krebs-Henseleit Buffer and stir until dissolved. Using a Pasteur pipet, rinse the weigh boat with a small volume of solution to include all traces of powder in the solution. Do not heat the solution.
- While stirring, add 0.373 g/L (130.55 mg) calcium chloride (CaCl2) to the solution and stir until dissolved. Rinse the weigh boat with a small volume of solution.
CAUTION: H319 causes serious eye irritation. - While stirring, add 2.1 g/L (0.63 g) sodium bicarbonate (NaHCO3) to the solution and stir until dissolved. Rinse the weigh boat with a small volume of solution.
- While stirring, add 1 x 10⁻¹ mM (13.15 mg) papaverine to the solution and stir until dissolved. Rinse the weigh boat with a small volume of solution.
NOTE: Papaverine is a smooth muscle relaxant used to prevent excessive vasoconstriction caused by cutting and handling the vessel during harvesting.
CAUTION: H301 is toxic if swallowed. - In the fume hood, add 0.05 mM (1.2 µL) 2-mercaptoethanol to the solution and stir.
NOTE: 2-mercaptoethanol is used to keep a low level of oxygen radicals.
CAUTION: 2-mercaptoethanol is toxic if swallowed or if inhaled (H301 + H331), fatal in contact with skin (H310), causes skin irritation (H315), may cause an allergic skin reaction (H317), causes serious eye damage (H318), suspected of damaging the unborn child (H361d), may cause damage to organs through prolonger or repeated exposure if swallowed (H373), and very toxic to aquatic life with long-lasting effects (H410). Wear personal protective equipment and work in a fume hood. - While stirring, adjust pH to 7.2 by adding 1 N (1 M) HCl or 1 N (1 M) NaOH. The final pH aim is 7.4, but pH may rise 0.1-0.3 pH units during filtration.
CAUTION: HCl contains gas under pressure; it may explode if heated (H280), cause severe skin burns and eye damage (H314), and is toxic if inhaled (H331). Wear personal protective equipment. - Continue working in a biosafety cabinet. Add 10% ultrapure water to bring the solution to the final volume.
- Sterilize the solution immediately by filtration using a membrane with a porosity of 0.22 µm. Dispense the sterile solution directly in a sterile bottle. Add 7 mL of 2% Penicillin/Streptomyocin (P/S) to the solution.
NOTE: During transport, 2% P/S is added to the medium to remove all bacteria. During tissue culture, 1% P/S is added to the medium. - Store the modified Krebs solution at 4 °C until tissue harvesting.
3. Tissue harvesting
- Depending on the slaughterhouse, stun pigs through electrical shock or CO2. Subsequently, hang pigs from a hind limb, exsanguinated, and declared dead.
- Before entering the clean slaughtering process, scald pigs for hair removal, singe to remove the last hairs, and sterilize the outside of the carcass.
- Eviscerate the pigs by making a midline incision along the abdomen and carefully removing the internal organs. Depending on the slaughterhouse, the carotid artery was still attached to the carcass of the pig, or the carotid artery was already removed from the carcass with the pluck of thoracic organs.
- Using a sharp knife, harvest the carotid artery with some remaining surrounding tissue from the carcass or throat area tissue without touching the artery or applying mechanical strain.
- Place the tissue containing the carotid artery in the transport bottle containing sterile modified Krebs solution by briefly opening the bottle. Invert the bottle once to ensure that the entire tissue is covered in Krebs solution. Transport the tissues on ice to the laboratory. The transport takes approximately 30-45 min.
4. Tissue dissection
- Sterilize dissection equipment surgical tweezer (rough handling), epoxy-coated round tip tweezer (fine handling), scalpel, pincher, and coverslips by autoclaving.
- Prepare the biosafety cabinet before tissue harvesting/transport. Cover the dissection area with a surgical drape sheet. Mount dissection equipment (in sterile 50 mL tubes), surgical blades, and sterile coverslips. Fill two large Petri dishes with sterile PBS to prepare a dissection tray. Incubate the tissue culture in one small Petri dish with ECG medium at 37 °C.
- After tissue transport, within the biosafety cabinet, transfer the carotid artery from the transport bottle (filled with modified Krebs solution) to a large Petri dish filled with sterile PBS using the surgical tweezer.
- Remove excessive tissue surrounding the carotid artery using the surgical tweezer and scalpel to create a clear view of the carotid artery.
- Remove 2-3 cm from both ends of the carotid artery to eliminate areas close to artery bifurcations by cutting with a scalpel. Remove arterial fascia surrounding the carotid artery using the fine round-tip tweezer.
NOTE: Renewing the scalpel blade helps cut the fascia more precisely. - Transfer the carotid artery to a new large Petri dish filled with sterile PBS. Remove the remaining thin layer of arterial fascia as much as possible.
NOTE: The longer the carotid artery is in PBS, the more pieces of fascia tend to get loose. Removing fascia is important since it will obstruct vision during microscopy. - Cut the clean carotid artery into rings approximately 2 mm in width. Transfer the carotid artery rings into the prewarmed small Petri dish filled with ECG medium and keep at 37 °C.
5. Tissue seeding
NOTE: Tissue attachment was tested by adding no coverslip, a sterile untreated coverslip, or a sterile pluronic-treated coverslip (1% w/v pluronic in PBS, coverslips incubated overnight and washed in sterile ultrapure water before use) of different sizes on top of the arterial sheet after seeding on the PAA hydrogel.
- Remove ECG medium droplets from gels. Transfer a carotid artery ring to a clean medium Petri dish filled with sterile PBS.
- Using the round-tip tweezer and scalpel, cut the ring in half. Dissect half a ring into sheets of approximately 2 mm width to create arterial sheets with dimensions 2 x 2 mm. Mind the orientation of the endothelial side of the arterial sheet. Curvature and some remaining fascia of the arterial sheet may help determine this orientation.
NOTE: The size of the carotid artery rings might vary. Large rings yield approximately 6-8 sheets, while small rings yield 3-4 sheets. Large rings have enhanced attachment due to less curvature in the arterial sheet. - Using the round tip tweezer, grab the arterial sheet at the back of the sheet (outside of the vessel wall) and place the sheet at the edge of the PAA gel with the endothelial inner lining facing the PAA substrate to avoid damaging the PAA substrate when placing the sheet.
- Using the tweezer or pincher, move the arterial sheet very gently to the center of the PAA hydrogel without touching the gel. Place the arterial sheet at the edge of the gel (the tissue might stick to the tweezer or pincher).
NOTE: Small remnants of arterial fascia at the outside of the vessel wall create an easy handle for grabbing the arterial sheet while the endothelial inner lining of the vessel wall is very smooth. - Add 50 µL of ECG medium on top of the arterial sheet placed on the PAA substrate. Ty to keep the droplet of ECG medium on top of the gel.
- Using the round-tipped tweezer, place a dry 13 mm coverslip on top of the arterial sheet on the PAA substrate in medium. Use the inner rim of the glass bottom to gently lower the coverslip until it touches the medium droplet and the medium spreads underneath it.
NOTE: The 13 mm coverslips are advantageous because they closely match the size of the inner wall of the glass bottom well plate. If you lower the coverslip too fast, the tissue will move to the edge of the coverslip. - Leave the tissue to attach at 37 °C and 5% CO2 for 5 h before adding 1 mL of ECG medium to each well. Place the arterial sheet on the PAA substrate at 37 °C and 5% CO2 for 24 h.
6. Creation of the 2.5D model
- Autoclave a round-tip tweezer for coverslip removal. Prepare 1 M NaOH in ultrapure water, sterilize by filtration through a 0.22 µm pore size filter, and store at 4 °C.
NOTE: 1 M NaOH can be reused in future experiments. - Using a sterile sharp needle with a bent tip, lift the 13 mm coverslip from the arterial sheet very gently and remove the coverslip. Use the inner ring of the glass bottom well as a support to lift and remove the coverslip. Any sideward movement increases the risk of detachment of the arterial sheet from the PAA substrate.
- In a sterile microcentrifuge tube, prepare the collagen type I mixture according to Table 2 on ice. Upon addition of collagen type I and NaOH to the solution, resuspend very well and invert the tube once to ensure that the mixture is homogeneously mixed.
NOTE: Upon addition of collagen type I to the mixture, the light pink-colored mixture turns colorless. Upon the addition of NaOH, the colorless mixture turns light pink. - Remove the medium from the well using a vacuum suction system. Remove the medium surrounding the tissue as much as possible without touching the tissue.
NOTE: Too much medium surrounding the arterial sheet will prevent the collagen-type I gel from surrounding it. - Add a 10 µL droplet of collagen type I gel mixture on top of each arterial sheet and leave the collagen type I gel to polymerize for 1 h at 37 °C and 5% CO2.
- Very gently, add 1 mL of pre-warmed ECG medium to each well and place the samples at 37 °C and 5% CO2.
7. Live cell imaging
NOTE: Live cell imaging was performed using a Leica DMi8 or Nikon Ti2 Eclipse epi-fluorescence microscope equipped with thermal, CO2, and humidity control and controlled using Leica or NIS software. Adaptive focus control (Leica) and perfect focus system (Nikon) were used to maintain focus in time.
- After 24 h of culture in the 2.5D system, check for sprouting angiogenesis. Some arterial sheets already start to form cellular sprouts after 24 h of culture while other sheets need some more time to initiate endothelial sprouting.
- If sprouting angiogenesis has been initiated, refresh the ECG medium and place the 12-well plate in the stage holder within the 37 °C pre-warmed incubation box of the microscope.
- Choose the objective of interest. Different objectives were used in this study, use a 10x objective to create a global overview of the formation of cellular sprouts and a 20x objective to perform TFM.
- Define channel(s) of interest. For TFM purposes, visualize the cellular sprouts using phase contrast and visualize the fluorescent markers (dark red) in the PAA substrate using a fluorescent channel at a wavelength of 660 nm.
- Select (multiple) region(s) of interest and find the focus plane. Turn on the focus system (adaptive focus control at Leica DMi8 or perfect focus system at Nikon Ti2 Eclipse) to ensure stable focus over timelapse imaging.
- Define the timelapse of interest by selecting a time interval and timelapse length. Different time intervals (5-20 min) and timelapse lengths (4-24 h) were used for different purposes in this study.
- For TFM purposes, after timelapse imaging, remove outgrowing cells by adding several droplets of 5% SDS in ultrapure water and wait several minutes. For each selected position, take a z-stack (a z-height of 2 μm was defined with a step size of 0.2 μm) of the fluorescent markers in the PAA substrate to obtain a relaxed state of the fluorescent markers as the reference image.
NOTE: Z-stack imaging is performed since cells might pull or push the fluorescent markers in the z-direction.
8. Traction force microscopy analysis
- Align and crop timelapse images relative to the best reference image for precise analysis.
- To measure displacements of fluorescent markers in the PAA hydrogel, perform Particle Image Velocimetry (PIV) between any timelapse image and the reference image using customized MatLab codes. Within the PIV analysis, divide the images into interrogation windows of 32 by 32 pixels with 0.5 overlap.
- Compute traction forces from the fluorescent markers' displacements by Fourier transform-based traction microscopy of an infinite gel with a finite gel thickness using the Boussinesq equation27.
Results
By means of the described protocol, we can induce ex vivo sprouting angiogenesis from a porcine carotid artery on top of a 2D PAA hydrogel covered with a thin layer of collagen type I gel, thus creating a 2.5D ex vivo sprouting angiogenesis model. This model allows us to perform conventional TFM and measure the cellular traction forces of sprouting angiogenesis on the PAA gel interface in space and time.
To establish the 2.5D model, we first prepared a 2D polyacrylamide (PAA) hydrogel embedded with fluorescent markers, followed by overnight coating with type IV collagen (d-1 to d0). On day 0 (d0), a carotid arterial sheet was placed on the collagen IV-coated hydrogel and allowed to attach overnight (d0 to d1). Subsequently, a thin layer of collagen type I gel was applied over the arterial sheet, after which imaging was initiated on day 1 (d1) to monitor cellular sprouting and track fluorescent markers for mechanical analysis (d1 to d2). To verify sprouting angiogenesis in the 2.5D model, we performed the conventional ex vivo sprouting angiogenesis in a 3D collagen type I gel in parallel. For this, a thin layer of collagen type I gel was prepared, followed by the seeding of the carotid arterial sheet, and subsequently covered with an additional collagen layer (d0). Angiogenic sprouting was monitored over time. Additionally, we endeavored to induce sprouting angiogenesis in 2D to further decrease model complexity. The experimental procedure mirrored that of the 2.5D model, with the key difference being the exclusion of the top collagen type I gel layer. An overview of the three models, including their experimental procedures, is described in Figure 1. Carotid arteries were harvested from pigs from the local slaughterhouse and transported in sterile fresh Krebs solution. Within the biosafety cabinet, excessive tissue surrounding the carotid artery was removed to ensure no visual impairment of sprouting angiogenesis during live timelapse imaging (Figure 2A-E). Once the artery was clean from excessive tissue, the artery was cut into artery rings of 2 mm width, and rings were cut into arterial sheets with a dimension of 2 x 2 mm (Figure 2F).
To ensure sprouting angiogenesis on top of the PAA hydrogel interface within the 2.5D and 2D model, we seeded the arterial sheets with the inner endothelial cell side facing the collagen type IV coated PAA hydrogel and left them to attach. To optimize the attachment of the arterial sheet to the PAA hydrogel, we tested the effect of the addition of an anti-fouling coated 12 mm glass coverslip on top of the arterial sheet. After 24 h, the coverslip was removed, and the attachment efficiency was measured by means of the percentage of arterial sheets attached to the PAA hydrogel. We observed that the addition of a glass coverslip - independent of the anti-fouling coating - increased the attachment efficiency of the arterial sheets on top of the PAA hydrogel compared to no coverslip (Figure 3A-D). Next, we tested the effect of the diameter (12 or 13 mm) of the glass coverslip on the attachment efficiency of the arterial sheet, while the inner well of the plate was 14 mm. We observed that a 13 mm coverslip increases the attachment efficiency of the arterial sheets on top of the PAA hydrogel compared to a 12 mm coverslip (Figure 3E-G) since shear forces during coverslip removal are minimized. We continued using an untreated 13 mm coverslip for arterial sheet attachment to the PAA hydrogel in both the 2.5D and 2D models.
After the arterial sheet had been attached to the PAA hydrogel, we added a thin layer of collagen type I gel on top of the arterial sheet to create a 2.5D environment. We cultured the samples for 5 days and examined the samples for sprouting angiogenesis. We observed the formation of cellular sprouts in the 3D model (Figure 4A), consistent with previously reported ex vivo sprouting angiogenesis in the literature28,29,30. Within the 2.5D model, we observed a similar organization of cellular sprouts in comparison to the 3D model (Figure 4B). Cellular sprouts were formed at multiple heights (Video 1), including at the PAA interface. Additionally, sprouting angiogenesis is characterized by high proliferation of leader and follower cells, a phenomenon that we observed during sprouting within the 2.5D model (Video 2). When culturing an arterial sheet in 2D, cells from different origins (Supplementary Figure 1) migrate as monolayers out of the tissue, thus lacking the organization of cellular sprouts (Figure 4C). Since we did not observe sprouting angiogenesis in the 2D model, we excluded this model from subsequent analyses. Altogether, the arterial sheet needs a local 3D environment to induce sprouting angiogenesis, showing the potential of the 2.5D ex vivo model of sprouting angiogenesis.
Furthermore, the 2.5D model system is a versatile system that allows users to examine the effect of mechanical cues from the cellular microenvironment, e.g., matrix stiffness. Matrix stiffness of a 3D collagen type I hydrogel - the hydrogel that is commonly used for ex vivo sprouting angiogenesis - is dependent on the concentration of ECM protein, where an increase in protein concentration correlates with an increase in matrix stiffness32. The typical range of collagen type I concentration to make this 3D hydrogel induce sprouting angiogenesis is 1-4 mg/mL, corresponding to a matrix stiffness of 1 Pa to 1 kPa32,33,34. Lower concentrations may be too soft to provide structural support, while higher concentrations can inhibit cell movement. The physiological stiffness of endothelial tissue is 1 kPa35, which can be mimicked with a 3D collagen type I hydrogel. However, tumor formation and progression are associated with tissue stiffening4, thus emphasizing the need for a model that can achieve a higher matrix stiffness to study tumor angiogenesis. The substrate stiffness of PAA hydrogels - the stiffness sensed by the endothelial cells of the arterial sheet - can easily be tuned within the range of 1 to tens of kPa. Here, we examined the effect of PAA substrate stiffness on the onset of sprouting angiogenesis by means of the percentage of samples that initiated the formation of cellular sprouts on the day after the collagen type I layer was added. We observed that more arterial sheets showed early signs of cellular sprouts when cultured on a physiological soft (1 kPa) PAA hydrogel in comparison to a pathological stiff (12 kPa) PAA hydrogel (Figure 5), showing the potential of this model to study the effect of matrix stiffness on sprouting angiogenesis. In addition to tunable substrate stiffness, these substrates allow the systematic modulation of other mechanical cues (e.g., matrix composition and density) as well as chemical cues (e.g., inhibition of molecular regulators by conditioning of the culture medium), demonstrating the versatility of this 2.5D ex vivo sprouting angiogenesis model.
To quantify cellular mechanics in sprouting angiogenesis, we performed conventional Traction Force Microscopy (TFM) on cellular sprouts that formed on the 2D PAA interface. One day after the addition of the collagen type I layer, we performed live cell imaging of the cells (Figure 6A) and the fluorescent markers embedded in the PAA hydrogel. Displacements of the fluorescent markers were measured using Particle Image Velocimetry (Figure 6B), and cellular tractions were computed using the mechanical properties of the PAA hydrogel (Figure 6C). With this 2.5D ex vivo model, we observed initially pulling forces at the protrusions of the leader cell of a cellular sprout followed by pushing forces along the cellular sprout - both at the rear of the leader cell as well as the follower cells (Figure 6C).

Figure 1: Experimental models and procedures. (left) Experimental models tested. The 2.5D model represents an arterial sheet placed on top of a flat collagen type IV coated polyacrylamide (PAA) hydrogel and covered with a thin layer of collagen type I hydrogel. The 3D model represents an arterial sheet sandwiched between two layers of collagen type I gel, a system that is known to induce sprouting angiogenesis36. The 2D model represents an arterial sheet placed on top of a flat collagen type IV coated PAA hydrogel. (right) Experimental procedures for corresponding models. For both the 2D and 2.5D models, a PAA hydrogel was prepared the day before seeding (d-1), and collagen type IV coating was performed overnight. The carotid artery was harvested from pigs, dissected into arterial sheets, seeded on top of the hydrogel at day 0 (d0), and left to attach overnight (d1). For 2.5D samples, a thin layer of collagen type I gel was placed on top of the arterial sheet. Mechanical analysis was performed after the onset of sprouting at day 2 (d2). For 2D samples, the medium was refreshed on day 1 (d1). For the 3D model, a layer of collagen type I gel was prepared just before seeding on day 0 (d0). The arterial sheet was seeded on top of the collagen type I layer and covered with a second layer of collagen type I. Please click here to view a larger version of this figure.
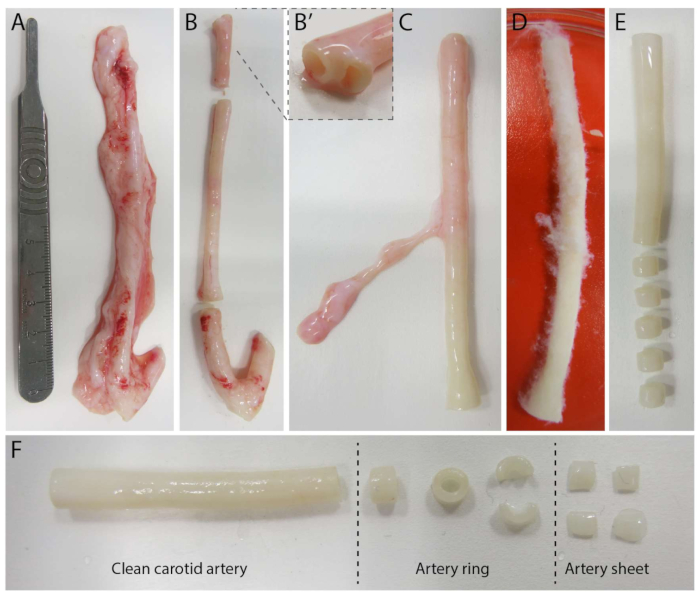
Figure 2: Carotid artery dissection steps (d0). (A) Carotid arteries of approximately 10 cm in length were harvested from pigs from the local slaughterhouse. (B) Excessive tissue and approximately 2 cm of the edge (to avoid being too close to branching points, (B') were discarded. (C-E) The carotid artery was skinned (C), soaked in PBS (D) and all remaining tissue was skinned to ensure clear visibility during imaging (E). (F) The clean carotid artery is sliced into artery rings with an approximate width of 2 mm. Each ring is cut into 4 arterial sheets with a dimension of approximately 2 x 2 mm. Please click here to view a larger version of this figure.
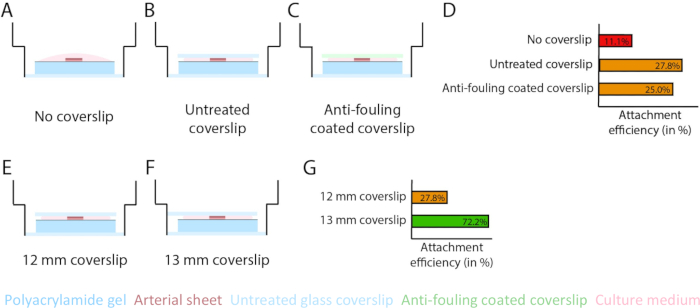
Figure 3: Arterial sheet attachment efficiency increases using a 13 mm glass coverslip (d1). (A-D) Effect of a glass coverslip on the attachment of arterial sheet to the polyacrylamide (PAA) hydrogel. A comparison was made between no glass coverslip (A), an untreated glass coverslip (B), and an anti-fouling coated glass coverslip using Pluronic F127 (C). Attachment efficiency was measured by the number of arterial sheets that attached to the PAA hydrogel after removal of the coverslip compared to the total number of samples: no coverslip (4 out of 36), untreated coverslip (10 out of 36), and anti-fouling coated coverslip (9 out of 36; D). (E-G) Effect of the size of an untreated glass coverslip on attachment of arterial sheet to the PAA hydrogel. A comparison was made between an untreated 12 mm glass coverslip (E) and an untreated 13 mm glass coverslip (F) within a 14 mm well. Attachment efficiency was measured by the number of arterial sheets attached to the PAA hydrogel after removal of the coverslip compared to the total number of samples: 12 mm coverslip (10 out of 36) and 13 mm coverslip (52 out of 72; G). Please click here to view a larger version of this figure.
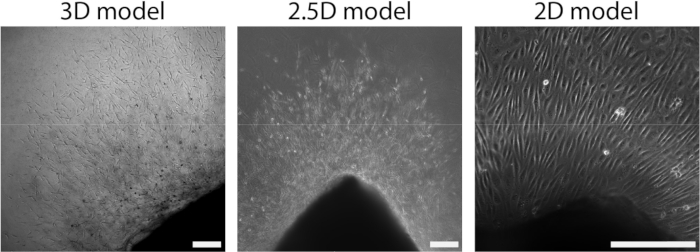
Figure 4: Dimensionality of the model defines organization during cellular outgrowth (d2+). Cells migrate out of the tissue in a sprout organization in the 3D model (left), similar to the 2.5D model (middle). Cells migrate out of the tissue in a monolayer organization in the 2D set-up (right). The scalebar represents 250 µm. Please click here to view a larger version of this figure.
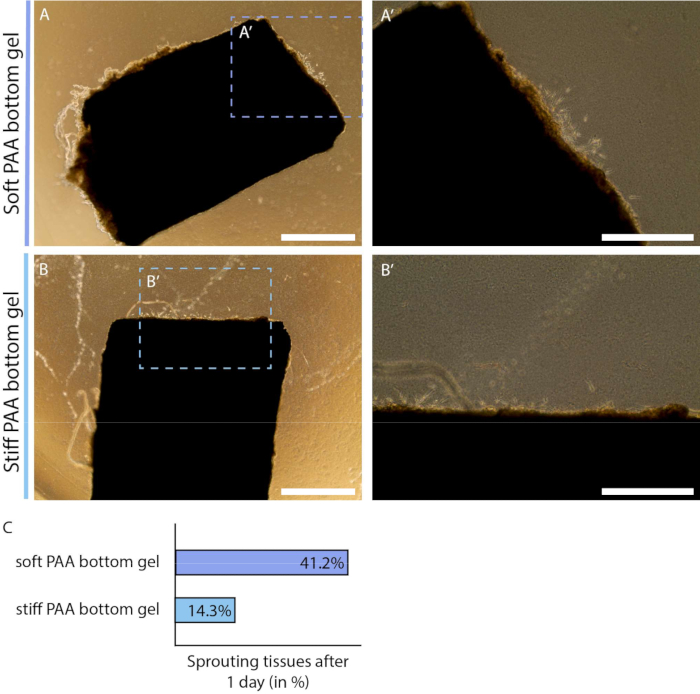
Figure 5: Onset of endothelial sprouting in 2.5D model depends on polyacrylamide hydrogel substrate stiffness (d2). (A-B) Arterial sheet covered with a thin layer of collagen type I gel on top of a soft (A; 1 kPa) or stiff (B; 12 kPa) polyacrylamide (PAA) hydrogel at day 2 of the protocol (1 day after addition of layer collagen type I gel). (C) Sprouting onset was measured by the number of arterial sheets that already show signs of cellular outgrowth compared to the total number of samples: soft (7 out of 24), and stiff (3 out of 24). Scalebar represents 1 mm (A, B) or 500 µm (A', B'). Please click here to view a larger version of this figure.
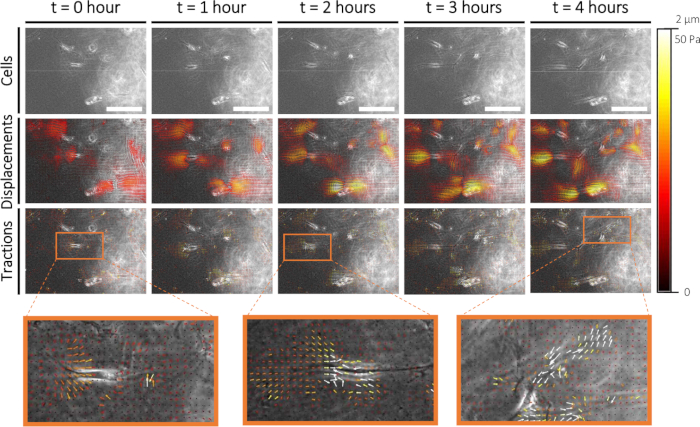
Figure 6: Traction force characterization during early sprouting angiogenesis. Imaging cells in time (0-4 h) is displayed in the top row. Corresponding fluorescent markers displacements (0-2 µm) and cellular tractions (0-50 Pa) on a 1 kPa PAA hydrogel substrate are displayed in the middle and bottom row, respectively. Zoom-ins of cellular tractions at 0 h, 2 h, and 4 h are displayed in orange. Please click here to view a larger version of this figure.

Figure 7: 2.5D ex vivo sprouting angiogenesis model method that allows for mechanical characterization of cellular sprouts. Please click here to view a larger version of this figure.
| 1 kPa | 12 kPa | |
| PBS | 435 µL | 373.7 µL |
| 40% acrylamide | 50 µL | 93.8 µL |
| 2% bis-acrylamide | 7.5 µL | 25 µL |
| Fluorescent marker (dark red) | 5 µL | 5 µL |
| 10% APS | 2.5 µL | 2.5 µL |
| TEMED | 0.25 µL | 0.25 µL |
Table 1: PAA gel mixture ratios.
| formula | Volume per 12-well plate (130 µL) | |
| ECG medium | VECG=Vfinal-Vcol1-VNaOH | 82.16 µL |
| Collagen type I | Vcol1=(Vfinal*Cfinal)/Cstock | 46 µL |
| NaOH | VNaOH=0.04*Vcol1 | 1.84 µL |
Table 2: Collagen type I gel mix volumes using abbreviations of volume (V) and concentration (C).
Video 1: Timelapse imaging of cellular sprout formation within the 2.5D model. Cells were imaged using Phase Contrast imaging over a time period of 22 hours with a time interval of 17.5 minutes. Cellular sprouts were formed on multiple heights within the collagen type I gel layer as observed by the different focal planes. The scalebar represents 100 µm. Please click here to download this video.
Video 2: High proliferation rate of cells within cellular sprouts within the 2.5D model. Cells were imaged using Phase Contrast imaging over a period of 22 h with a time interval of 17.5 minutes. Both leaders as well as follower cells proliferate during timelapse imaging. The scalebar represents 100 µm. Please click here to download this video.
Supplementary Figure 1: Cellular phenotype in 2D model (d2+) by immunofluorescence staining. (A) Immunofluorescence (IF) staining of cell nucleus (DAPI), endothelial cell marker (CD31), and fibroblast marker (alpha-smooth muscle actin; α-SMA). (B) IF staining of the cell nucleus (DAPI), endothelial cell marker (CD31), and smooth muscle cell marker (calponin). The scalebar represents 100 µm. Please click here to download this figure.
Supplementary File 1: Immunofluorescence staining protocol. Please click here to download this file.
Discussion
Sprouting angiogenesis - the formation of new blood vessels - is a complex process regulated by both molecular and mechanical mechanisms. Whereas many 3D models have been developed over the past decades to study the molecular drivers (e.g., VEGF and Notch signaling) of sprouting angiogenesis, only little is known about cellular mechanics due to model limitations. Traction Force Microscopy (TFM) is a well-known technique for quantification of cellular forces in space and time, where 2D substrate deformations are converted into cellular tractions. Therefore, in this protocol, we describe a 2.5D ex vivo model, meaning that we locally provide the cells with a 3D environment while preserving the simplicity of a 2D model that allows for the quantification of traction forces during sprouting angiogenesis (Figure 1). To do so, we prepared and seeded a porcine arterial sheet (endothelial side down; Figure 2) on top of a collagen type IV coated polyacrylamide (PAA) hydrogel containing fluorescent markers. After the attachment of the arterial sheet using a 13 mm glass coverslip (Figure 3), we add a thin layer of collagen type I hydrogel that allows the formation of cellular sprouts (Figure 4). Using this model, we show that during cellular sprouting22,23,24,25, leader cells exert pulling forces (as was observed in literature19,20,21,22), but also that follower cells exert pushing forces (Figure 6). The resolution of the traction field obtained through our protocol allows for quantitative analyses of cellular kinematics and dynamics both in time and space that are typical of works resorting to traction force microscopy on compliant substrates37,38,39.
Moreover, we demonstrate the versatility of this 2.5D ex vivo model of sprouting angiogenesis by changing the mechanical cues of the microenvironment (Figure 5). While sprouting angiogenesis normally occurs at a physiological stiffness of 1 kPa35 - which can be mimicked by a 3D collagen type I hydrogel, tumor angiogenesis occurs in a stiffened microenvironment40 - which is beyond the stiffness range of conventional 3D collagen type I hydrogels. PAA substrate stiffness can easily be adjusted by changing the ratio of crosslinkers to generate a higher substrate stiffness. Using this model, we reveal that the onset of sprouting angiogenesis is stiffness-dependent. These substrates not only offer tunable stiffness but also enable systematic modulation of various other mechanical cues, e.g., matrix composition and density. In addition, this model allows us to study cellular mechanics while manipulating molecular regulators using conditioning of the medium (e.g., the effect of inhibition on Notch signaling on cellular mechanics) to understand the mechanobiological mechanisms of sprouting angiogenesis. This demonstrates the utility of this 2.5D ex vivo model of sprouting angiogenesis in a swatch of different microenvironments.
The model that we present makes use of conventional 2D TFM, which offers simpler analysis, higher spatial resolution, and easier implementation compared to 3D (viscoelastic) TFM, making it more accessible and cost-effective26,41. However, 3D (viscoelastic) TFM provides a more physiologically relevant environment by capturing traction forces in all three dimensions and accounting for the complex mechanical properties of the extracellular matrix, offering deeper insights into cell behavior in a more realistic context42,43,44,45. This effect of dimensionality also points towards a limitation of this 2.5D model. We use 2D TFM on the assumption that cells are migrating on a 2D substrate. While this is the case in this 2.5D model, cells are in a local 3D environment and thus adhere to the collagen type I gel layer and exert forces in this gel layer. The assumption that we adopted within this analysis is that the collagen type I gel layer is not mechanically coupled (no force transmission between these two hydrogels) to the PAA interface due to the order of magnitude difference in matrix stiffness, therefore, minimizing the effect of cellular forces on the collagen type I layer. This makes the force characterization using the 2.5D ex vivo model a simplified representation of the forces generated by the cells. In addition, this protocol requires precision and is extensive with several steps where samples can be lost, e.g. (i) cell visibility difficulties due to excessive tissue surrounding the arterial sheet (Figure 2), (ii) one out of three samples does not attach to the PAA substrate (Figure 3), (iii) not all samples will initiate the formation of cellular sprouts (Figure 5), (iv) cellular sprouts do not form at the PAA substrate, and (v) out-of-focus fluorescent markers when using thick arterial sheet on top of a low stiffness PAA hydrogel. Therefore, we optimized this method for a 12-well plate to ensure plenty of regions of interest to perform mechanical analysis of sprouting angiogenesis.
In conclusion, the presented approach for the simplified characterization of cellular traction forces of sprouting angiogenesis of a living porcine arterial sheet using a 2.5D model (Figure 7) can aid in creating more accurate and real-time insights into the mechanical interactions during angiogenesis within a native tissue context, facilitating the study of dynamic cellular processes with reduced complexity and improved reproducibility compared to fully 3D systems. This could enhance our understanding of how cells respond to mechanical cues in a more physiologically relevant environment while maintaining the analytical simplicity of 2D methods. This knowledge could advance the field of tissue engineering with the aim of creating blood vessels but also finding therapeutic drugs for the prevention of tumor angiogenesis with the aim to limit tumor growth and reduce metastasis.
Disclosures
The authors have no conflicts of interest to disclose.
Acknowledgements
We thank the people from LifeTec for harvesting and transporting the porcine carotid arteries from the local slaughterhouse; Leon Hermans, Pim van den Bersselaar, and Adrià Villacrosa Ribas (TU/e, ICMS) for the fruitful discussions on experimental procedures and mechanical characterization analysis. We gratefully acknowledge support by grants from the European Research Council (771168), the Netherlands Organization for Scientific Research (024.003.013), the Academy of Finland (307133, 316882, 330411 and 337531), and the Åbo Akademi University Foundation's Centers of Excellence in Cellular Mechanostasis (CellMech).
Materials
| Name | Company | Catalog Number | Comments |
|---|---|---|---|
| 2% bis-acrylamide | Bio-Rad | 1610143 | |
| 2-mercaptoethanol | Merck Life Science | 60-24-2 | |
| 3-(Trimethoxysilyl)propyl methacrylate | Bind-Silane | Sigma-Aldrich | 440159-100ML |
| 40% acrylamide | Bio-Rad | 1610140 | |
| Aboslute ethanol (for analysis) | VWR International | 1.00983.1000 | |
| Absolute ethanol (industrial) | VWR International | 83813.41 | |
| Acetic acid, glacial 100% | Merck | 1000562500 | |
| Ammonium persulfate | APS | Bio-Rad | 7727-54-0 |
| antibody (primary) - calponin | abcam | ab46794 | |
| antibody (primary) - CD31 | Serotec | MCA1746 | |
| antibody (primary) - α-smooth muscle actin | αSMA | Dako | M0851 |
| antibody (secondary) - goat-anti-mouse-IgG1 Alexa 488 | Molecular Probes | A21121 | |
| antibody (secondary) - goat-anti-mouse-IgG2a Alexa 555 | Molecular Probes | A21137 | |
| antibody (secondary) - goat-anti-rabbit-IgG Alexa 555 | Molecular Probes | A21428 | |
| Autoclave | Astell | ||
| Calcium chloride dihydrate | CaCl2 | Calbiochem | 208291-250GM |
| Collagen type I, rat-tail | Corning | 354236 | |
| Collagen type IV, human placenta | Merck Life Science | C5533-5MG | |
| Endothelial Cell Growth Medium | ECG medium | Promocell | C-22111 |
| Expoxy-coated round tip tweezer | fine tweezer | Rubis Pinzette | E78144-2A |
| Fluorescent marker, dark red | Invitrogen | F8807 | |
| Glass coverslips, Ø13 mm, #1 | Epredia | CB00130RA120MNZ0 | |
| Glass coverslips, Ø13 mm, #1.5 | Epredia | CB00120RAC20MNZ0 | |
| Hydrochloride acid, 25% | HCl | Merck | 1.100316.1000 |
| Krebs-Henseleit buffer | Sigma-Aldrich | K3753 | |
| Microscope, Leica Application Suite X software, version 3.5.7.23225 | Leica Microsystems | ||
| Microscope, Leica DMi8 epifluorescent microscope | Leica Microsystems | ||
| Microscope, Nikon Ti2 Eclipse | Nikon | ||
| Microscope, NIS-Elements AR software | Nikon | ||
| N,N,N',N'-tetramethylethane-1,2-diamine | TEMED | Merck Life Science | 110-18-9 |
| Nalgene bottle | Thermo Scientific | 2187-0016 | |
| Needle, 21Gx1" | Henke Sass Wolf | HK4710008025 | |
| Normal serum, goat | Gibco | 10098792 | |
| Papaverine hydrochloride | Sigma | 61-25-6 | |
| Penicillin/Streptomyocin (10 000 U/mL) | P/S | Gibco | 15140163 |
| Petri-dish, large (145x20mm) | Greiner Bio-one | 639160 | |
| Petri-dish, small (60x15mm) | Greiner Bio-one | 628160 | |
| Phosphate Buffered Saline | PBS | Sigma | P4417 |
| Pluronic F-127 | Merck Life Science | P2443-250G | |
| Puncture needle, sharp closed tip | unknown | ||
| Scalpel, no. 4 | Swann-Morton | ||
| Sodium hydrogen carbonate | NaHCO3 | VWR International | 144-55-8 |
| sulfosuccinimidyl 6-(4'-azido-2'-nitrophenylamino)hexanoate | Sulfo-SANPAH | Thermo Scientific | 22589 |
| Surgical blade, no. 20 | Swann-Morton | ||
| Surgical drape sheet | Foliodrape | 2775001 | |
| Surgical tweezer | Lettix | 400024 | |
| Triton X-100 | Merck | 9036-19-5 | |
| UV lamp | Analytik Jena | 95-0042-13 | |
| well plate, 96-well, F-bottom | Greiner Bio-one | 655180 | |
| well plate, glass bottom 12-well | MatTek | P12G-0-14-F |
References
- Carmeliet, P. Angiogenesis in health and disease. Nat Med. 9 (6), 653-660 (2003).
- Folkman, J. Angiogenesis in cancer, vascular, rheumatoid and other disease. Nat Med. 1, 27-30 (1995).
- Kretschmer, M., Rüdiger, D., Zahler, S. Mechanical aspects of angiogenesis. Cancers. 13 (19), 4987(2021).
- Bordeleau, F., et al. Matrix stiffening promotes a tumor vasculature phenotype. Proc Natl Acad Sci U S A. 114 (3), 492-497 (2017).
- Blanco, R., Gerhardt, H. VEGF and Notch in tip and stalk cell selection. Cold Spring Harb Perspect Med. 3 (1), a006569(2013).
- Adams, R. H., Alitalo, K. Molecular regulation of angiogenesis and lymphangiogenesis. Nat Rev Mol Cell Biol. 8, 464-478 (2007).
- Carmeliet, P., De Smet, F., Loges, S., Mazzone, M. Branching morphogenesis and antiangiogenesis candidates: tip cells lead the way. Nat Rev Clin Oncol. 6, 315-326 (2009).
- Salam, N., et al. Assessment of migration of human mscs through fibrin hydrogels as a tool for formulation optimisation. Materials. 11 (9), 1781(2018).
- Solbu, A. A., et al. Assessing cell migration in hydrogels: An overview of relevant materials and methods. Materials Today Bio. 18, 100537(2023).
- Cao, W., Li, X., Zuo, X., Gao, C. Migration of endothelial cells into photo-responsive hydrogels with tunable modulus under the presence of pro-inflammatory macrophages. Regenerat Biomater. 6 (5), 259-267 (2019).
- Staton, C. A., Reed, M. W. R., Brown, N. J. A critical analysis of current in vitro and in vivo angiogenesis assays. Int J Exp Pathol. 90 (3), 195-221 (2009).
- Staton, C. A., et al. Current methods for assaying angiogenesis in vitro and in vivo. Int J Exp Path. 85, 233-248 (2004).
- Ngo, T. X., et al. In Vitro models for angiogenesis research: A review. Int J Tissue Regenerat. 5, 37-45 (2014).
- Tomita, Y., et al. An ex vivo choroid sprouting assay of ocular microvascular angiogenesis. J Vis Exp. (162), e61677(2020).
- Kapoor, A., Chen, C. G., Iozzo, R. V. A simplified aortic ring assay: A useful ex vivo method to assess biochemical and functional parameters of angiogenesis. Matrix Biol Plus. 6-7, 100025(2020).
- Stiffey-Wilusz, J., Boice, J. A., Ronan, J., Fletcher, A. M., Anderson, M. S. An ex vivo angiogenesis assay utilizing commercial porcine carotid artery: Modification of the rat aortic ring assay. Angiogenesis. 4 (1), 3-9 (2001).
- Kniazeva, E., Putnam, A. J. Endothelial cell traction and ECM density influence both capillary morphogenesis and maintenance in 3-D. Am J Physiol Cell Physiol. 297 (1), C179-C187 (2009).
- Davidson, C. D., Wang, W. Y., Zaimi, I., Jayco, D. K. P., Baker, B. M. Cell force-mediated matrix reorganization underlies multicellular network assembly. Sc Rep. 9 (1), 12(2019).
- Lyle, K. S., Corleto, J. A., Wittmann, T. Microtubule dynamics regulation contributes to endothelial morphogenesis. BioArchitecture. 2 (6), 220-227 (2012).
- Kniazeva, E., et al. Quantification of local matrix deformations and mechanical properties during capillary morphogenesis in 3D. Integrat Biol. 4 (4), 431-439 (2012).
- Quintanilla, M. A., Hammer, J. A., Beach, J. R. Non-muscle myosin 2 at a glance. J Cell Sci. 136 (5), jcs.260890(2023).
- Fischer, R. S., Gardel, M., Ma, X., Adelstein, R. S., Waterman, C. M. Local cortical tension by myosin II guides 3D endothelial cell branching. Curr Biol. 19 (3), 260-265 (2009).
- Yoon, C., et al. Myosin IIA–mediated forces regulate multicellular integrity during vascular sprouting. Mol Biol Cell. 30 (16), 1974-1984 (2019).
- Du, Y., et al. Three-dimensional characterization of mechanical interactions between endothelial cells and extracellular matrix during angiogenic sprouting. Sci Rep. 6, 21362(2016).
- Vaeyens, M. M., et al. Matrix deformations around angiogenic sprouts correlate to sprout dynamics and suggest pulling activity. Angiogenesis. 23 (3), 315-324 (2020).
- Style, R. W., et al. Traction force microscopy in physics and biology. Soft Matter. 10 (23), 4047-4055 (2014).
- Trepat, X., et al. Physical forces during collective cell migration. Nat Phys. 5 (6), 426-430 (2009).
- Santos-Oliveira, P., et al. The force at the tip - modelling tension and proliferation in sprouting angiogenesis. PLoS Comput Biol. 11 (8), e1004436(2015).
- Boreddy, S. R., Sahu, R. P., Srivastava, S. K. Benzyl isothiocyanate suppresses pancreatic tumor angiogenesis and invasion by inhibiting HIF-α/VEGF/Rho-GTPases: Pivotal role of STAT-3. PLoS One. 6 (10), 0025799(2011).
- Teng, R. J., Eis, A., Bakhutashvili, I., Arul, N., Konduri, G. G. Increased superoxide production contributes to the impaired angiogenesis of fetal pulmonary arteries with in utero pulmonary hypertension. Am J Physiol Lung Cell Mol Physiol. 297 (1), L184-L195 (2009).
- Costa, G., et al. Asymmetric division coordinates collective cell migration in angiogenesis. Nature Cell Biol. 18 (12), 1292-1301 (2016).
- Slater, K., Partridge, J., Nandivada, H. Corning tuning the elastic moduli of Corning Matrigel and collagen I 3D matrices by varying the protein concentration. , Corning Incorporated, Life Sciences, MA USA. (2019).
- Lee, J., et al. Effect of chain flexibility on cell adhesion: Semi-flexible model-based analysis of cell adhesion to hydrogels. Sci Rep. 9 (1), 2463(2019).
- Motte, S., Kaufman, L. J. Strain stiffening in collagen i networks. Biopolymers. 99 (1), 35-46 (2013).
- Butcher, D. T., Alliston, T., Weaver, V. M. A tense situation: Forcing tumour progression. Nat Rev Cancer. 9 (2), 108-122 (2009).
- Artym, V. V., Matsumoto, K. Imaging cells in three-dimensional collagen matrix. Curr Prot Cell Biol. 10, Unit 10.18.1-Unit 10.18.20 (2010).
- Labernadie, A., et al. A mechanically active heterotypic E-cadherin/N-cadherin adhesion enables fibroblasts to drive cancer cell invasion. Nat Cell Biol. 19 (3), 224-237 (2017).
- Bazellières, E., et al. Control of cell-cell forces and collective cell dynamics by the intercellular adhesome. Nat Cell Biol. 17 (4), 409-420 (2015).
- Uroz, M., et al. Traction forces at the cytokinetic ring regulate cell division and polyploidy in the migrating zebrafish epicardium. Nat Mater. 18 (9), 1015-1023 (2019).
- Dong, C., Nastaran, Z., Konstantopoulos, K. Biomechanics in oncology. , Springer Nature. Switzerland, AG. (2018).
- Schwarz, U. S., Soiné, J. R. D. Traction force microscopy on soft elastic substrates: A guide to recent computational advances. Biochim Biophys Acta. 1853 (11), 3095-3104 (2015).
- Toyjanova, J., et al. 3D Viscoelastic traction force microscopy. Soft Matter. 10 (40), 8095-8106 (2014).
- Legant, W. R., et al. Multidimensional traction force microscopy reveals out-of-plane rotational moments about focal adhesions. Proc Natl Acad Sci U S A. 110 (3), 881-886 (2013).
- Steinwachs, J., et al. Three-dimensional force microscopy of cells in biopolymer networks. Nat Meth. 13 (2), 171-176 (2016).
- Franck, C., Maskarinec, S. A., Tirrell, D. A., Ravichandran, G. Three-dimensional traction force microscopy: A new tool for quantifying cell-matrix interactions. PLoS One. 6 (3), e17833(2011).
Reprints and Permissions
