Here, we describe a method for creating double-emulsion droplets encapsulating one T cell and a cancer target cell to examine cell killing at the single-cell level. This method allows for dual quantification of both cytotoxic molecules and target-cell apoptosis within a large population of T cells.
Method Article
Droplet-based Cytotoxicity Assay to Assess Chimeric Antigen Receptor T cells at the Single-cell Level
In This Article
Summary
Abstract
The assessment of the cytotoxic potential of T cell-based therapies, such as chimeric antigen receptor (CAR) T cell treatments, is instrumental in assessing their efficacy and is a prerequisite for clinical application. However, traditional cytotoxicity assays are conducted as bulk assays and do not provide detailed information about the functional heterogeneity of the CAR T cell population. In this study, we describe a double-emulsion droplet-based method that allows for large-scale co-encapsulation of single effector CAR T cells with single target cells while enabling dual quantification of both cytotoxic effector molecules from T cells and cell death of the target cell. The protocol outlines a method for the generation and purification of CD19-specific CAR T cells, followed by their co-encapsulation in droplets with the CD19+ cell line JeKo-1, along with reagents to visualize cytotoxic effector molecule secretion (Granzyme B) and cell death (using propidium iodide, PI). We demonstrate how to generate droplets containing single CAR T and target cells using a commercially available microfluidics device for generating double emulsion droplets. Additionally, we provide examples of how to assay the functional diversity of CAR T cells in droplets using standard flow cytometry equipment. Finally, we briefly describe the temporal kinetics and heterogeneity of CD19-specific CAR T-cell killing. While this method focuses on cell death following a CAR T cell attack, it is also adaptable for examining other types of T cells, cytotoxic immune cells, and effector cell functions, such as cytokine secretion.
Introduction
Chimeric antigen receptor (CAR) T cell therapy is a rapidly expanding field of cellular cancer immunotherapy that has proven effective against various forms of leukemia, lymphoma1, and multiple myeloma2. CAR T cells are generated by modifying T cells with a synthetic antigen receptor that can selectively bind to surface proteins such as CD19 or B-cell maturation antigen (BCMA), expressed on B cells, plasma cells, and their malignant counterparts. Recent advances in CAR design have enabled the targeting of multiple antigens simultaneously3, relying on multiple input signals, or binding exclusively to tumor-associated antigens, such as specific protein isoforms4. Additionally, several CARs are now being tested against targets of non-hematological cancers5.
Cytotoxicity assays are essential for both CAR development and quality control before clinical products are released6,7,8. However, most current assays depend on bulk populations of effector CAR T cells added in excess to cancer cell lines, which can lead to false-positive results due to bystander effects9 and result in a poor correlation between in vitro and in vivo outcomes10. Since T cell proliferation and long-term persistence depend on the signals received during initial activation events11,12, closely examining cytotoxic events at the single-cell level is of great interest.
To address the limitations of bulk methodologies, cytotoxicity studies at the single-cell level can be performed using flow cytometry13,14,15,16,17 and imaging-based assays18. However, even though standard flow cytometry offers single-cell resolution for quantifying and characterizing both effector and target cells, it cannot directly determine the specific cytotoxic ability of individual CAR T cells towards target cells. Additionally, imaging individual CAR T cells interacting with their respective targets in bulk is challenging and time-consuming due to the consistent motility of cells. To address these challenges, novel tools for single-cell analysis have been developed that rely on pairing effector and target cells in spatially confined spaces using microwell arrays19,20,21, microraft arrays22, microchips23, and droplet microfluidics24,25,26. These tools provide enhanced measurement sensitivity, enabling the investigation of fewer cells using reduced reagent volumes. However, several challenges remain, including efficient cell pairing, the limited number of samples that can be analyzed, reliance on imaging-based analysis only, and difficulties retrieving viable cell populations for further analyses.
Here, we utilize a commercially available microfluidics device that allows for a massively simplified approach to droplet-based microfluidics. This device enables advanced single-cell analysis and assays to be performed using highly stable double-emulsion (DE) droplets. Compared to microwell- and traditional droplet-microfluidics assays, the protocol outlined here does not require extensive microfludics expertise.
DE droplets are small spherical compartments composed of an oil shell with an aqueous core suspended in an aqueous solution. The aqueous droplet contains and retains cells, cell secretome, cell medium, and assay reagents, allowing for complex assays to be performed within each compartment. Using the microfluidics device, DE droplets are generated with a set volume (approximately 100 pL) suitable for mammalian single-cell or cell-cell interaction assays, which can be generated in very high numbers (approximately 750,000 droplets per sample) and in a short timeframe (approximately 10 min for 8 samples) by general lab users without specialized knowledge in microfluidics. The generated droplets can be suspended in the cell medium, thus allowing trans-shell diffusion of O2 and CO2 and buffering of the interior while at the same time retaining hydrophilic and larger molecules such as cell-secreted effector molecules. The examined cells are thus adequately buffered, allowing for examination over time of cell-cell interactions and temporal dynamics. In contrast to single emulsion droplets (e.g., water-in-oil droplets)27, the DE droplets are robust structures that do not fuse or merge in standard cell incubators. Because of their stability and an aqueous outer phase, they are also compatible with downstream analysis procedures such as traditional flow cytometry. These picoliter droplets generated by the microfluidics device can, therefore, be used for high throughput single-cell analysis of cell function to elucidate functional heterogeneity hidden in traditional bulk assays.
Here, we outline a protocol that utilizes DE droplets to examine CD19-specific CARs' cytotoxic potential toward lymphoma cells. Our protocol allows for single-cell analysis of target killing and Granzyme B (GzmB) secretion and reveals that approximately 20% of the CAR T cells examined here have immediate killing potential.
Protocol
The CAR T cells used in this study were generated by lentiviral transduction of primary T cells with a CD19scFv-CD28-CD3ζ-tNGFR CAR construct in a certified biosafety GMO class 2 laboratory and declassified following 4 days according to institute standard. Purified T cells were from discarded surplus material from anonymized blood donations and were exempt from further ethical approvals as per Danish law.
1. Generation of CAR T cells
NOTE: The name of the reagents used below uses generic and abbreviated names. The full commercial name can be found in parenthesis in Table of Materials.
- T cell activation, transduction, and expansion
NOTE: Stable expression of CD19 CAR T cells was achieved through lentiviral transduction of primary human T cells isolated from fresh peripheral blood mononuclear cells (PBMCs) using a negative selection T cell isolation kit. The anti-CD19 CAR used is a second-generation construct composed of an FMC63 single-chain variable fragment (scFv), a CD28 hinge and transmembrane domain, a CD28 costimulatory domain, a CD3ζ activation domain28 and a truncated version of the nerve growth factor receptor (tNGFR) for monitoring and enrichment of CAR-expressing cells29. The transfer vector plasmid was synthesized de novo, and third-generation lentivirus was made by combining this with pMDLg/pRRE (Addgene plasmid #12251), pRSV-Rev (Addgene plasmid #12253), and pMD2.G (Addgene plasmid #12259)30. The later three plasmids were a gift from Didier Trono. The crude virus was concentrated using a PEG-based reagent, and the multiplicity of infection (MOI) was determined by transducing SUP-T1 cells and measuring tNGFR by flow cytometry as per standard protocol31.- Transfer 2 x 10⁶ primary human T cells to a 12-well culture dish and stimulate them with CD3/CD28-coated beads at a 1:1 bead-to-cell ratio in 1 mL of complete RPMI-1640 medium (10% heat-inactivated fetal bovine serum, 1% penicillin/streptomycin) supplemented with 100 units/mL recombinant human interleukin-2 (IL-2). Incubate the cells at 37°C in a humidified 5% CO2 incubator for 24 h.
- Add lentiviral particles to the activated T cells at an MOI of 5-10. Mix gently and incubate the cells for 72 h. Include non-transduced (NTD) T cells as a negative control.
- On day 3 post-transduction, remove the CD3/CD28 activation beads by harvesting the T cells into a 1.5 mL tube and placing the tube on a magnetic stand for 1-2 min. Transfer the supernatant containing the cells to a new 1.5 mL tube.
- Perform a cell count using an automated cell counter and adjust the cell density to 1 x 10⁶ cells/mL in a complete RPMI-1640 medium supplemented with 100 U/mL IL-2. Continue expanding the T cells until the total CAR T cell count reaches at least 1.5 x 10⁶ (usually around 6 x 10⁶ T cells in total) in the suspension before proceeding with NGFR enrichment (see below).
- Monitor the cell count every other day and adjust the concentration to 1 x 10⁶ cells/mL by adding fresh medium supplemented with 100 units/mL IL-2 to ensure optimal cell state during expansion.
- Enrichment of CAR-expressing T cells
- Transfer 6 x 10⁶ or more transduced T cells into a 15 mL tube and centrifuge at 300 x g for 5 min. Resuspend the cell pellet in 320 µL of PBS supplemented with 0.5% bovine serum albumin (BSA) to make PBSA and add 40 µL of anti-NGFR magnetic beads. Mix well and incubate on ice for 15 min.
NOTE: This protocol assumes a transduction efficiency of approximately 25%, resulting in >1.5 x 10⁶ CAR T cells after enrichment. We do not recommend starting with fewer than 6 x 10⁶ cells, as this may result in poor CAR T cell recovery. - Add 1640 µL of PBSA to bring the final volume to 2 mL, then proceed with magnetic separation using separation columns according to the manufacturer's instructions.
- Transfer 6 x 10⁶ or more transduced T cells into a 15 mL tube and centrifuge at 300 x g for 5 min. Resuspend the cell pellet in 320 µL of PBS supplemented with 0.5% bovine serum albumin (BSA) to make PBSA and add 40 µL of anti-NGFR magnetic beads. Mix well and incubate on ice for 15 min.
- Detection of CAR expression by flow cytometry
NOTE: We recommend determining the percentage of CAR-expressing cells and their viability at this point, to ensure proper cells before performing the assay below. CD4 and CD8 ratio and memory phenotype can also be determined at this point. See Figure 1 for representative plots.- Transfer 2.5 x 10⁵ T cells from both transduced and non-transduced cultures into separate flow cytometry tubes. Wash the cells 2x with 200 µL of PBS, centrifuging at 300 x g for 5 min after each wash.
- Prepare an antibody mix containing anti-CD19 CAR FMC63 Idiotype PE, anti-CD3 BV480 and anti-NGFR FITC antibodies, each diluted 1:100 in PBS. Resuspend the cells in 50 µL of the antibody mix and incubate at 4 °C for 20 min.
- Wash the cells 2x with 200 µL of PBS, centrifuging at 300 x g for 5 min after each wash. Resuspend the cells in 200 µL of PBS and analyze using flow cytometry.
2. Generation of droplets encapsulating T cells and target cells
NOTE: Prior to encapsulation, T cells, and JeKo-1 cells are stained with different cell stains to monitor droplet cellular content. Cells are encapsulated with assay reagents and incubated for 2-6 h before the droplets are analyzed on the flow cytometer (see Figure 2).
- Staining cells before encapsulation
- Prepare working solutions of two fluorescent dyes (we utilized a violet dye and a far-red dye) by diluting the stock solutions (prepared according to manufacturer's instructions) 1:5,000 in dPBS.
- For each donor, transfer 2.5 x 10⁶ CAR T, 2.5 x 10⁶ NTD T, and 15 x 106 JeKo-1 cells into separate centrifuge tubes (15 mL or 50 mL tubes) and centrifuge at 300 x g for 5 min. In this experiment, 0.5 x 10⁶ effector cells were encapsulated with 1.5 x 10⁶ target cells for each sample prepared.
NOTE: The number of cells transferred here is intended for 4x encapsulation samples with each effector cell type for each donor. Scale the number of cells and reagents down according to the number of samples needed. Additionally, the exact number of cells per sample can be scaled according to experimental needs. - Remove supernatant and resuspend effector cell pellets in the 1:5,000 working solution of the violet fluorescent dye and target cell (JeKo-1) pellets in the 1:5,000 working solution of the far red fluorescent dye. Resuspend the cells well with a pipette and to a cell concentration of 1 x 10⁶ cells/mL staining solution.
- Incubate the cells for 20 min in a 37 °C humidified CO2 incubator. Centrifuge the cells at 300 x g for 5 min, remove supernatant, and resuspend in 15 mL of complete RPMI-1640 medium to wash the cells.
- Repeat the wash and centrifuge at 300 x g for 5 min. Remove the supernatant and resuspend the effector cell pellets in 225 µL of complete RPMI-1640 and the target cell pellets in 450 µL of complete RPMI-1640.
- Add 30 µL of a gradient medium to the effector cell suspensions and 60 µL of the same gradient medium to the target cell suspensions. Resuspend the gradient medium stock solution well before pipetting.
- Add 15 µL of a 20 µg/mL PI stock to the effector cell suspensions and 30 µL of the PI stock to the target cell suspensions. The final PI concentration will eventually be 1 µg/mL after the Granzyme B (GzmB) substrate has been added below.
- Prepare a 1:10 dilution of GzmB substrate in complete RPMI-1640 and add 30 µL of this GzmB substrate dilution to the effector cell suspension and 60 µL of it to the target cell suspensions. Mix well with the pipet.
NOTE: The total volume of the reagents added to each effector cell pellets should now be 300 µL and to the target cell pellets 600 µL. The gradient medium concentration in these solutions should be 10%, the PI concentration 1 µg/mL, and the GzmB substrate concentration 1:100. - Alternative labelling using CD3, CD4, and CD8 antibodies
NOTE: In some instances, it might be of interest to further label effector cells before co-encapsulation with target cells. Here we show proof-of-principle for this type of labelling using CD3, CD4 and CD8 antibodies and PBMC (see Figure 3).- Transfer 2.0 x 10⁶ PBMC to a 1.5 mL tube and spin the cells down for 5 min at 300 x g. Remove the supernatant and resuspend the cell pellet in 200 µL of dPBS with 0.5% BSA. Divide the content into two 2 mL tubes.
- Add 5 µL of anti-CD3-APC and 5 µL of anti-CD4-StarBright Violet 760 to one of the tubes. Add 20 µL of anti-CD3-FITC and 5 µL of anti-CD8-StarBright Violet 760 to the other tube.
- Mix well and incubate for 30 min at room temperature in the dark. Add 1 mL of wash buffer to the cells, spin down at 300 x g for 5 min, remove the supernatant, and resuspend the cell pellets in 1 mL of dPBS with 0.5% BSA.
- Spin down the cells at 300 x g for 5 min, remove the supernatant, and resuspend the cell pellets in 150 µL of RPMI without phenol red and 10% gradient medium.Encapsulate as described in step 2.2 using RPMI without phenol red, 33% stabilizing solution for cells, and 10% gradient medium as the outer medium.
- Encapsulating the cells
- Preheat an encapsulation cartridge and stabilizing solution to room temperature before encapsulation. Prepare a stock of outer medium consisting of complete RPMI-1640 medium, 33% stabilizing solution for cells, and 10% gradient medium.
- For each encapsulation sample, prepare a cell sample solution with mixed-target-effector cells. Resuspend the cell solutions prepared well with a pipet and mix 65 µL of prepared effector cell suspension with 65 µL of prepared target cell suspension in 1.5 mL tubes (both prepared in step 2.1).
- Immediately proceed with loading the indicated wells of the encapsulation cartridge with reagents in the following order to ensure proper encapsulation. Load one set of wells for each encapsulation sample prepared.
Well #A: 400 µL of outer media.
Well #D: 40 µL of outer media on the small shelf.
Well #C: 120 µL of pre-mixed solution with target cells (JeKo-1) and effector cells. Resuspend cells well with a pipette right before loading.
Well #B: 250 µL of oil.
NOTE: Each cartridge can be loaded with up to 8 samples for encapsulation in parallel. - Immediately proceed with gasket sealing and loading the cartridge in the instrument while avoiding tilting, shaking, or bumping the loaded cartridge. Carefully seal the gasket onto the cartridge.
- Carefully transfer the cartridge to the microfluidics device and start the encapsulation as described in the user manual.
- The generated droplets have higher densities than the surrounding outer medium and will quickly sediment on the bottom of the collection well (Well #D). Collect each droplet production (all droplets and their surrounding outer medium) by resuspending the sedimented droplets from Well #D in the overlaying medium and transferring them to a 2 mL low-binding DNA tube with a lid. Wash Well #D with the remaining outer media from Well #A to collect the remaining droplets.
- When the droplets have sedimented in the collection tubes (it takes approximately 1 min), verify the droplet production by examining them in a bright-field microscope. To do this, fill a 10 µL pipette tip with a sample: ca. 1/3 with droplets from the surface of droplet phase (white phase) and ca. 2/3 with the overlaying outer medium to fil the tip. Immediately load the sample on an 8-chamber glass slide and examine the droplets by bright field microscopy at 4x and 20x magnification to confirm droplet loading with cells.
NOTE: It is important that the droplets in this way are aspirated in a larger volume of the surrounding medium.
- Incubation
NOTE: The droplets can now be incubated in 2 mL of DNA low-binding tubes in a standard humidified 37 °C, 5% CO2 incubator. We recommend using these tubes, as they have optimal surface properties for droplet culturing.- With a syringe needle (23G), carefully and safely puncture the lid of the required number of 2 mL low-binding DNA tubes. This will ensure free CO2/O2 diffusion while preventing media evaporation.
- Add 1 mL of outer medium to each incubation tube. The droplets should be incubated with at least 5x volume of outer media to ensure proper buffering. The volume of the outer medium added can be increased depending on the metabolism of the cells applied.
- Resuspend the droplets generated in the overlaying media and split each production in three of the prepared incubation tubes (one for each time point measurement). The droplets are heavy and sediment fast, and it is therefore important to resuspend the stock between each transfer.
NOTE: The number of incubation tubes into which the droplet productions are split can be varied, but we recommend splitting one production into no more than 4 incubation tubes to ensure that each sample contains enough events for analysis. - Place the tubes upright in the incubator for 2 h, 4 h, or 6 h incubation after droplet generation.
3. Downstream analysis of droplets
- Microscopy
- After incubation, transfer a small number of droplets to a microscope slide as described in step 2.2.7 and analyze them by bright field and fluorescence microscopy using a standard fluorescence microscope with appropriate laser and filter configuration.
NOTE: The droplets can be detected by bright-field microscopy. The violet-stained T cells can be detected with a DAPI filter, the far red-stained JeKo-1 cells with an APC filter, the GzmB-FAM signal with a FITC filter, and the PI signal with a PE filter. The PI signal of highest interest can be difficult to visualize by microscopy since early apoptotic cells have a lower peak emission than late apoptotic cells. See Figure 4 for representative data.
- After incubation, transfer a small number of droplets to a microscope slide as described in step 2.2.7 and analyze them by bright field and fluorescence microscopy using a standard fluorescence microscope with appropriate laser and filter configuration.
- Flow cytometry
- After incubation, resuspend each droplet sample in the overlaying medium and transfer it to 5 mL FACS tubes. Analyze the droplets using a standard flow cytometer by following the general guidelines listed below.
- Use a flow cytometer with appropriate laser and filter configuration. With the selected panel of cell stains and assay, color compensation is not required on the flow cytometer used here. If other colors are applied or the configuration of the applied flow cytometer is different, compensation may be necessary.
- Use FSC-H as the threshold trigger to exclude background noise from small oil events.
- Droplets are heavy and will sediment on the bottom of the FACS tubes. Ensure the SIP reaches the droplets. The droplets should be suspended in at least 5x volume of outer buffer to droplets before acquisition.
- Droplet events are acquired using high speed. Record intensity height (H) signals for FSC and SSC and the examined fluorophores since intensity height measurements are used when analyzing droplets. Adjust gains to have proper separation of positive and negative events.
NOTE: We used the FITC-channel to measure the GzmB signal, the Pacific Blue-channel to detect the violet-stained T cells, the APC-channel to detect the far red-stained JeKo-1 cells and the PE-channel to detect the PI signal. - Record enough events for downstream analysis. Here, we recorded 4.5 - 8.3 x 10³ of the co-encapsulating droplets per timepoint.
- Wash the flow cytometer through the SIP after each set of droplet acquisitions, using standard clean and rinse solutions. Clean the flow cytometer thoroughly at the end of the experiment. See Figure 4 and Figure 5 for representative data.
- After incubation, resuspend each droplet sample in the overlaying medium and transfer it to 5 mL FACS tubes. Analyze the droplets using a standard flow cytometer by following the general guidelines listed below.
- Analysis of data
- Calculate the percentage of T cells secreting GzmB based on the percentage of GzmB positive T cell and JeKo-1 cell co-encapsulations normalized to the T cell viability determined in the T cell-only droplet populations at the time point in question, as follows:
Droplets T cell+, Jeko-1+, GzmB+ / (Droplets T cell+, Jeko-1+ - Droplets dead T cell+, Jeko-1+)
where Droplets dead T cell+, Jeko-1+ is estimated from death in droplets with T cells only: Dropletsdead T cell+, Jeko-1+ = DropletsT cell+, Jeko-1+ x Droplets dead T cell+, Jeko-1- / DropletsTcell+, Jeko-1-. - Calculate the percentage of T cells that killed their target cells as follows:
Percentage cytotoxic T cells = (Observed death - Background death)/(100 - Background death)
where background death is the death present within (T cell+, Jeko-1+) droplets resulting either from non-kill related death or death occurred prior to encapsulation. - Estimate the background death from cell death in (T cell+, Jeko-1-) droplets and (T cell-, Jeko-1+) droplets:
Background death = (1- (1- death ratio in DropletsTcell-, Jeko-1+) x (1- death ratio in DropletsT cell+, Jeko-1-)) x 100
where the death ratio is measured directly as the % PI positive droplet in T-cell-only droplets and JeKo-1-cell-only droplets, respectively. All calculations are performed with sampling time-specific numbers.
- Calculate the percentage of T cells secreting GzmB based on the percentage of GzmB positive T cell and JeKo-1 cell co-encapsulations normalized to the T cell viability determined in the T cell-only droplet populations at the time point in question, as follows:
Results
Following transduction, the T cells were analyzed for CAR expression by flow cytometry using anti-CD3 and anti-NGFR antibodies. The CAR T cell population was subsequently enriched using anti-NGFR magnetic beads, resulting in a purity of over 98% for both donors (Figure 1A-B). The CD4/CD8 ratio and memory phenotype of sorted CAR cells used were also quantified, using a standard gate strategy utilizing CCR7 and CD45RA antibodies. These data show that the CD4/CD8 ratio of CAR T cells used was 0.73, and cells were primarily of naïve-like memory phenotype (Figure 1C-E).
CAR T cells and JeKo-1 cells were stained with violet and far-red dyes, respectively, and encapsulated in DE50 droplets together with assay reagents GzmB substrate and PI (Figure 2). Alternatively, CAR T cells can also be labeled using antibodies such as anti-CD4 or anti-CD8 (Figure 3), enabling a more detailed characterization of T cells. Each T cell suspension (CAR T or NTD) was mixed with a JeKo-1 cell suspension immediately before encapsulation at an effector: target cell ratio of 1:3 (0.5 x 10⁶ T cells and 1.5 x 10⁶ JeKo-1). Following encapsulation, each droplet production (CAR T cells + JeKo-1 and NTD + JeKo-1) was divided into three incubation tubes for 2 h, 4 h, and 6 h incubation, respectively. The cells were incubated inside the droplets at 37 °C in 5% CO2 and then analyzed by microscopy and flow cytometry at the indicated time points.
We performed fluorescence microscopy of double-emulsion droplets after 4 h of incubation (Figure 4). The intensity of the green fluorescence signal (FITC) illustrates the level of secreted GzmB activity of CAR T cells or NTDs inside the DE50 droplets. Figure 4B presents phase contrast and fluorescence microscopy images of a single GzmB-positive droplet containing a CAR T cell and a JeKo-1 target cell in close contact.
Next, DE50 droplets were analyzed by flow cytometry to quantify the percentage of CAR T cells with early GzmB secretion and cytotoxic cell-killing activity (Figure 5). Pre-incubation staining of JeKo-1 target cells with a far-red dye and effector T cells with a violet dye before encapsulation facilitated the identification of three distinct cell-containing droplet populations as the cells are distributed in droplets based on Poisson distribution. The droplet populations identified are droplets with T cells alone, JeKo-1 cells alone, and T cells and JeKo-1 cells together (Figure 5A). Droplets co-encapsulating T cells with JeKo-1 cells were gated and analyzed for signals indicating GzmB activity (Figure 5B) and cell death, as indicated by PI (Figure 5C).
The encapsulation of cells in droplets follows Poisson distribution, and four different droplet populations are obtained (Figure 6A). Figure 6B shows the level of GzmB positive droplets within all droplet populations after 6 h incubation of droplets from which the percentage of spontaneous GzmB-secreting T cells can be determined. These data indicate the high specificity of the method, as only CAR T-cells secrete GzmB.
Finally, we quantified GzmB and PI levels across time points, following 2 h, 4 h, and 6 h of co-incubation. For reference, the droplets containing only T cells and only JeKo-1 cells were analyzed to examine the background cell death in each population (Figure 6C). The background cell death was used to determine the percentage of live GzmB-secreting and target cell-killing T cells in the population of effector cells (Figure 7), as described in step 3.3. CAR T cells from two donors exhibited a time-dependent increase in both target-cell-induced GzmB secretion and cell-killing activity. Nearly 36% of the live CAR T cells from Donor 1 and 31% from Donor 2 had secreted GzmB after 6 h co-encapsulation with the target cell, a significant increase compared to NTD control T cells (Figure 7A). Correspondingly, about 21% of the live Donor 1 and 22% of the live Donor 2 CAR T cells had killed target cells, as indicated by a positive PI signal (Figure 7B). The percentage of CAR T cells that had secreted GzmB exceeded the percentage of killed target cells at each time point, consistent with the expected sequence of events in GzmB-mediated cytotoxicity. Taken together, these data show that the method presented here allows for the characterization of the heterogeneity in individual T cell cytotoxicity within a population of cells as well as comparisons between different populations.
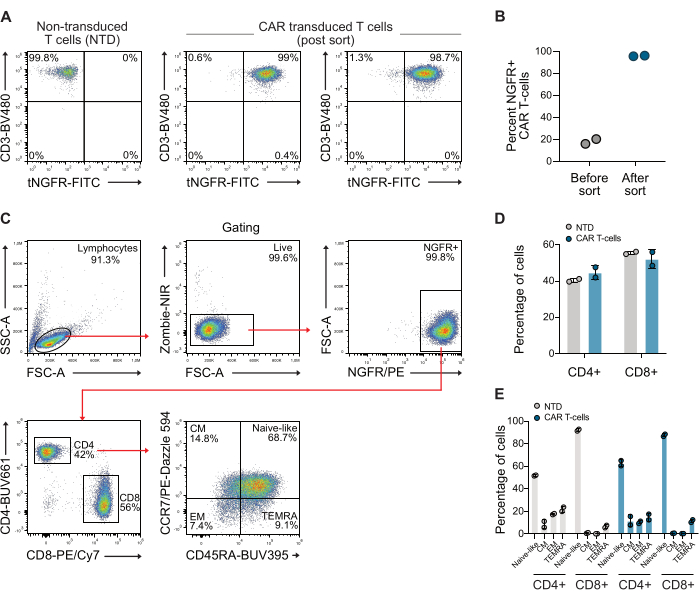
Figure 1: Representative flow cytometry plots following NGFR sorting. (A) Following approximately 10 days of expansion, CAR T cells were sorted using NGFR-specific microbeads and magnetic sorting, resulting in a population of CAR T cells that was >98% CAR T cells. (B) Quantification of CAR T cells from two donors used in this study before and after sorting. (C) Gating strategy used for examining CD4/CD8 ratio and memory phenotype of T cells. (D) Quantification of CD4 and CD8 of T cells used. (E) Quantification of memory phenotype of T cells used. Abbreviation: CM = central memory, EM = effector memory, NTD = non-transduced, TEMRA = terminally differentiated effector cells. Please click here to view a larger version of this figure.
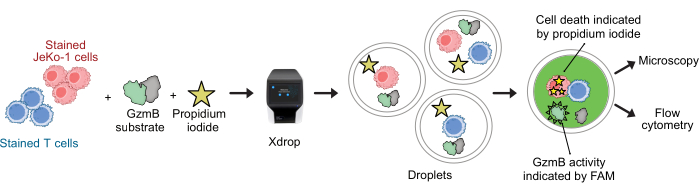
Figure 2: Workflow for the combined GzmB secretion and cytotoxicity assay with single-cell resolution in droplets. Before encapsulation in DE droplets, the target and effector cells are stained separately using violet and far-red cell stains. Using the microfluidics device and the encapsulation cartridge, effector cells are co-encapsulated with target cells in droplets together with cell medium, PI, and FAM-labeled GzmB peptide substrate. The assay and incubation take place within the droplets. Secreted GzmB activity is indicated by emission of green fluorescence that occurs after GzmB cleaves the substrate. Cell death is indicated by PI. After incubation, DE50 droplets are analyzed by microscopy and/or flow cytometry. Please click here to view a larger version of this figure.

Figure 3: Analysis of droplet encapsulated PBMCs pre-labelled with anti-CD3, anti-CD4, and anti-CD8 antibodies. (A) Microscopy images of droplets with encapsulated PBMCs pre-labelled with anti-CD3 (APC) and anti-CD4 (NIR) antibodies. Scalebar = 100 µm. (B) As (A), but with CD3 (FITC) and anti-CD8 (NIR) labeling instead. Scalebar = 100 µm. (C) Flow cytometry analysis of the same droplets. Please click here to view a larger version of this figure.
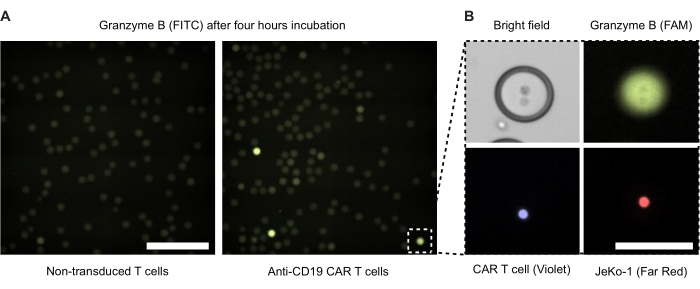
Figure 4: Microscope images of droplets with effector and target cells. Images were taken after 4 h incubation in a standard 37 °C, 5% CO2 humidified cell incubator. (A) Droplets from a sample with encapsulated NTD and JeKo-1 cells (left) or CAR T cells and JeKo-1 cells (right) imaged by fluorescence microscopy using the FITC channel to detect GzmB positive (green) droplets. Scalebar = 500 µm. (B) A single droplet imaged by phase contrast, FITC (GzmB), APC (JeKo-1 cell), and DAPI (CAR T cell). Scalebar = 100 µm. Please click here to view a larger version of this figure.
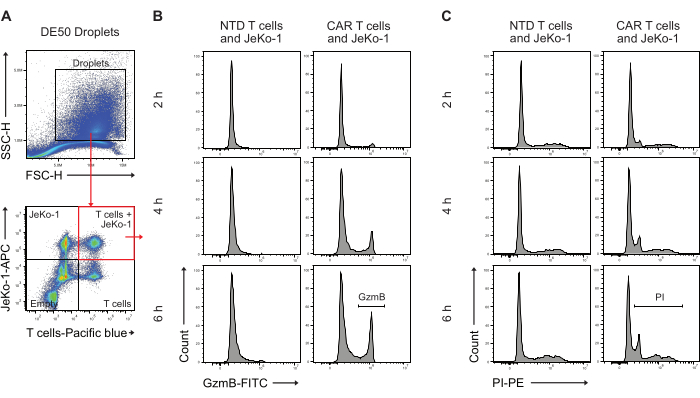
Figure 5: Gating strategy for analyzing droplets by flow cytometry following incubation. (A) Gating was done by forward and side-scatter to identify droplets, followed by selecting the gate containing the droplets. The events outside the gate represent oil droplets produced as a byproduct of double-emulsion droplet production. Subsequent fluorescence analysis of droplets in channels corresponding to the applied cell stains identifies four droplet populations: droplets containing both T cells and JeKo-1 cells (red square); droplets with JeKo-1 cells alone; droplets with T cells alone; and empty droplets. (B) Representative histograms for GzmB signal in double-positive droplets across time points and between NTD and CAR T cells. (C) Representative histograms for PI signal in double-positive droplets across time-points and between NTD and CAR T-cells. All droplet measurements are performed as intensity height (H) measurements. Please click here to view a larger version of this figure.
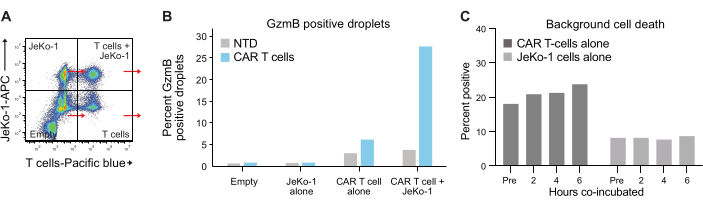
Figure 6: Internal control and reference populations. (A) Each of the four quadrants from Figure 5A was selected, and GzmB and PI were measured in each. This type of quantification allows for background signals to be measured and subtracted before a final analysis of T-cell efficacy is performed. (B) Graph showing the frequency GzmB positive droplets after 6 h incubation for each of the four droplet populations, exemplified with data from the Donor 1 CAR T sample. (C) Background cell death was determined in JeKo-1-only and T cell-only control droplet populations at each time point measured, with data from donor 1. The background cell death is used for calculating the frequency of live GzmB secreting and cell-killing effector cells shown in Figure 7 and explained in step 3.3. Abbreviations: Pre = encapsulation. Please click here to view a larger version of this figure.
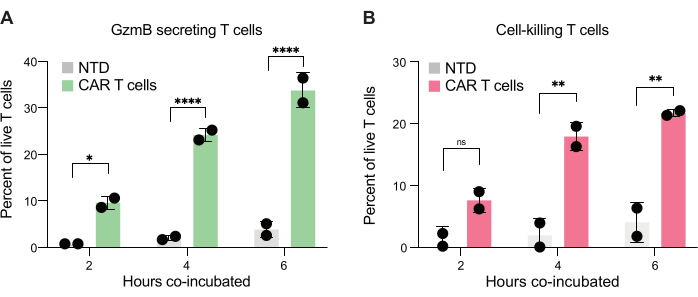
Figure 7: Quantification of T cells capable of secreting GzmB and killing JeKo-1 cells in double-positive droplets. Double positive droplets gated from two donors were examined following 2 h, 4 h, and 6 h co-incubation in droplets. (A) Frequency of target cell-encountering T cells secreting GzmB and comparison between NTD T cells and CAR T cells. (B) Frequency of target cell-encountering T cells killing the co-encapsulated target cell. Abbreviations: GzmB = granzyme B, NTD = non-transduced, PI = propidium iodide. * = P-value < 0.05, ** = P-value < 0.005, **** = P-value < 0.0001 by two-way ANOVA. Please click here to view a larger version of this figure.
Discussion
Here we present a method for examining T cells' cytotoxic potential at the single-cell level using an easy to use commercially available microfluids device to evaluate the cytotoxic potential of CD19-CD28-CD3z CAR T cells upon co-encapsulation with the CD19-positive mantle cell lymphoma cell-line JeKo-1.
There are several critical steps in this protocol. First, we recommend removing stimulation beads from T cells at least 48 h before performing any assays, to avoid false positive results. Secondly, T cell transduction efficiency with constructs such as CARs or T-cell receptors can vary considerably. Without a subsequent purification step of the transduced T cells, results may be challenging to interpret. Here, a pure population of CAR T cells was used and therefore a high degree of certainty can be expected when characterizing CAR T cells as being killers or non-killers at each time point. Alternatively, tagging CARs with fluorescent protein or genetic tag may be applied to indicate cells which are CAR-positive and then gated upon when analyzing droplets. If tagging is used, the fluorescent molecules selected should not interfere with the fluorescent emissions from any of the other assay fluorophores. For example, using GFP-tagging would interfere with the FAM-labeled GzmB substrate applied in the experiments performed here and is thus not recommended.
A major advantage of the protocol outlined here is that the droplet generation itself is simplified and automated. However, in order to ensure single-cell encapsulation, it is important that cells resuspend thoroughly before cartridge loading. For this reason, working at a fair pace is recommended when preparing to load the cartridge. A similar consideration applies when adding the GzmB substrate, as some cells are high secreters of GzmB. The resuspension of cells will also prevent clogging of small cartridge microfluidic channels. Proper encapsulation of cells is easily checked by microscopy, as outlined above.
Because the droplet encapsulates the cell medium and retains cellular products secreted from cells, other cytokines, antibodies, and compounds may be analyzed. Indeed, we have tested other relevant immune cell-secreted molecules, such as IFN-γ and TNF-α, which require modifications of the current protocol. For cytokine detection, a different type of assay format than we utilize here for GzmB may be applied, such as the generation of an ELISA sandwich on the effector cell surface32. Additionally, cell stains and assay colors can be changed, e.g., carboxyfluorescein succinimidyl ester (CFSE), but it is important to ensure minimal or no bleed-through across different color combinations, as would be done in standard flow cytometry.
Furthermore, this protocol is not limited to analyzing CAR T cells. It can also be extended to study other T cell/target interactions or other immune cells such as CAR NK cells. More advanced experiments can also be envisioned, for example labeling CD4 and CD8 T-cell subsets with additional fluorophores to perform broader functional immunophenotyping. Indeed, here we show that CD4 and CD8 can be detected in the droplets, thus enabling further characterization of the effector T cells and their cytotoxic capacity.
Optimizing this protocol, we specifically aimed for it to work on standard flow cytometry instruments. While droplet flow cytometry is not complicated, we have noticed that oil buildup may occur if the flow cytometer is not properly rinsed at certain intervals or as recommended here after the analysis of samples at each time interval. The best rinse protocol might be specific for each individual flow cytometer.
One of the significant advantages of this method is its high-throughput capability, allowing the monitoring of single-cell effector-mediated cytotoxicity against target cells without the need for extensive expertise or highly specialized equipment. The assay can easily be done using existing tools, such as flow cytometry or microscopy. Double emulsion droplets are also amenable to sorting using cell sorters30,31,which may enable isolation of cells with specific functionalities, e.g., CAR T cells with and without cytotoxic potential, followed by single-cell transcriptome analysis.
The technology is not without limitations. While some cell lines will tolerate culture in droplets for 24 h and beyond, primary cells may have significantly lower viability after 24 h. This represents a time constraint on the assays in general, but for the current assay, noticeable GzmB, and cell-killing activity can be observed within 4-6 h, likely because the small droplet compartment ensures rapid encounter of the effector and target cells. Likewise, the small droplet volume will ensure a fast buildup in concentration to detectable levels of the secreted GzmB-cleaved substrate. Another limitation of the technology is the inability to detect serial killing by effector cells when using standard flow cytometers. However, this could possibly be achievable with image flow cytometers or image cytometry technologies, which will have to be investigated.
The adoptive transfer of CD19 CAR T cells has shown remarkable success in treating patients with hematological malignancies. Despite this, there is a large variation of response and unpredictable toxicity in patients32, which may be partly due to the heterogeneity within the CAR T infusion product. As a result, there is a growing interest in analyzing the phenotypic composition and cytotoxic ability of individual CAR T cells within a population. This will be particularly important as CAR therapy is increasingly tested in autoimmune conditions and in other forms of cancer. The microfluidics device and protocol described here offer a robust and versatile approach to examining the heterogeneity of CAR T cells and other cell-based therapies.
Disclosures
The authors declare the following competing interests: M.B.B. has received consulting honorariums from Janssen, Roche, and Kite/Gilead, unrelated to the present work. D.L.P. and P.M. are employees of Samplix.
Acknowledgements
The authors wish to thank members and employees of CITCO and Samplix for helpful discussions and suggestions. M.B.B. is supported by Early-Career Clinician Scientists' fellowship from the Lundbeck Foundation (R381-2021-1278). This work is supported through an elite-research grant from Odense University Hospital. Furthermore, this research was supported by a grant from the European Innovation Council Project 190144395 to Samplix ApS.
Materials
| Name | Company | Catalog Number | Comments |
|---|---|---|---|
| Reagents | |||
| Blocker BSA (BSA) | Thermo Scientific | 37525 | |
| CellTrace Far Red Cell Proliferation Kit (far red fluorescent dye) | Invitrogen | C34564 | |
| CellTrace Violet Cell Proliferation Kit (violet fluorescent dye) | Invitrogen | C34557 | |
| DE Stabilizing Solution (stabilizing solution) | Samplix | REDIVSTABSOL1500 | |
| DPBS (dPBS) | Gibco | 14190-094 | |
| Dulbecco’s PBS (dPBS) | Capricorn Scientific | PBS-1A | |
| Dynabeads Human T-Activator (CD3/CD28 activation beads) | Gibco | 11132D | |
| Fetal Bovine Serum (FBS) | Capricorn Scientific | FBS-HI-12A | |
| Lenti-X Concentrator (PEG-based reagent) | Takara Bio | 631232 | |
| MACSelect LNGFR Microbeads (anti-NGFR magnetic beads) | Miltenyi Biotec | 130-091-330 | |
| OptiPrep density gradient medium (gradient medium) | Stemcell | 7820 | |
| Penicillin-Streptomycin (P/S) | Capricorn Scientific | PS-B | |
| Propidium iodide (PI) | Invitrogen | BMS500PI | |
| Recombinant Human IL-2 (IL-2) | Peprotech | 200-02 | |
| RPMI-1640 with Stable Glutamine (RPMI-1640) | Capricorn Scientific | RPMI-STA | |
| RPMI-1640 without L-Glutamine and phenol red | Gibco | 32404-014 | |
| Xdrop DE oil I (oil) | Samplix | REOILDEC1900 | |
| Xdrop Granzyme B substrate (GzmB substrate) | Samplix | REGRB100 | |
| Zombie-NIR viability dye (viability dye) | BioLegend | 423106 | |
| Plasticware etc. | |||
| 8-chamber glass slide | Chemometec | 942-0003 | |
| Cell culture plate, 12 well | TH Geyer | 7696791 | |
| DNA LoBind tube, 2 mL (DNA tube) | Eppendorf | 30108078 | |
| Eppendorf tube, 1.5 mL (1.5 mL tube) | Eppendorf | 30108051 | |
| Falcon tube, 15 mL (15 mL tube) | TPP | 91015 | |
| Falcon tube, 5 mL (5 mL tube) | Falcon (VWR) | 734-0443 | |
| Green cell suspension flasks for cell incubations (T75 flask) | Sarstedt | 148.19.22 | |
| Green cell suspension plates for cell incubations (96 well plate) | Sarstedt | 148.32.20 | |
| LS Separation Columns (separation column) | Miltenyi Biotec | 130-042-401 | |
| Xdrop DE Gaskets (gaskets) | Samplix | #GADEA100 | |
| Xdrop DE50 Cartridge (encapsulation cartridge) | Samplix | #CADE50A100 | |
| Antibodies | |||
| anti-CCR7 PE-Dazzle 594 | BioLegend | 353236 | |
| anti-CD19 CAR FMC63 Idiotype Antibody, PE | Miltenyi Biotec | 130-127-342 | |
| anti-CD3 APC | Biolegend | 300439 | |
| anti-CD3 BV480 | BD Biosciences | 566105 | |
| anti-CD3 FITC | BD Biosciences | 345763 | |
| anti-CD4 BUV661 | BD Biosciences | 612962 | |
| anti-CD4 StarBright Violet 760 | Bio-Rad | MCA1267SBV760T | |
| anti-CD45RA BUV395 | BD Biosciences | 740298 | |
| anti-CD8 PE-Cy7 | BioLegend | 344712 | |
| anti-CD8 StarBright Violet | Bio-Rad | MCA1226SBV760 | |
| anti-NGFR FITC | BioLegend | 345106 | |
| anti-NGFR PE | BioLegend | 345106 | |
| Cells | |||
| JeKo-1 Mantle-cell lymphoma cell-line (JeKo-1) | ATCC | CRL-3006 | |
| Primary peripheral blood mononuclear cells (PBMCs) | |||
| Equipment | |||
| Countess 3 Automated Cell Counter | Thermo Fisher Scientific | A50298 | |
| DynaMag-2 Magnet | Invitrogen | 12321D | |
| NovoCyte Quanteon Flow Cytometer (flow cytometer) | Agilent | 2010011AA | |
| Xdrop (microfluidics device) | Samplix | IN00110-EU |
References
- Pasqui, D. M., Latorraca, C. D. O. C., Pacheco, R. L., Riera, R. CAR-T cell therapy for patients with hematological malignancies. A systematic review. Eur J Haematol. 109 (6), 601-618 (2022).
- Krejcik, J., et al. Harnessing the immune system to fight multiple myeloma. Cancers. 13 (18), 4546(2021).
- Tokarew, N., Ogonek, J., Endres, S., von Bergwelt-Baildon, M., Kobold, S. Teaching an old dog new tricks: next-generation CAR T cells. British J Cancer. 120 (1), 26-37 (2019).
- Bogetofte Barnkob, M., Vitting-Seerup, K., Rønn Olsen, L. Target isoforms are an overlooked challenge and opportunity in chimeric antigen receptor cell therapy. Immunother Adv. 2 (1), ltac009(2022).
- Daei Sorkhabi, A., et al. The current landscape of CAR T-cell therapy for solid tumors: Mechanisms, research progress, challenges, and counterstrategies. Front Immunol. 14, 1113882(2023).
- Considerations for the Development of Chimeric Antigen Receptor (CAR) T Cell Products. , Center for Biologics Evaluation and Research. https://www.fda.gov/regulatory-information/search-fda-guidance-documents/considerations-development-chimeric-antigen-receptor-car-t-cell-products (2024).
- Roddie, C., O'Reilly, M., Dias Alves Pinto, J., Vispute, K., Lowdell, M. Manufacturing chimeric antigen receptor T cells: issues and challenges. Cytotherapy. 21 (3), 327-340 (2019).
- Wang, L., et al. Improvement of in vitro potency assays by a resting step for clinical-grade chimeric antigen receptor engineered T cells. Cytotherapy. 21 (5), 566-578 (2019).
- Burrows, S. R., Fernan, A., Argaet, V., Suhrbier, A. Bystander apoptosis induced by CD8+ cytotoxic T cell (CTL) clones: implications for CTL lytic mechanisms. Int Immunol. 5 (9), 1049-1058 (1993).
- Gattinoni, L., et al. Acquisition of full effector function in vitro paradoxically impairs the in vivo antitumor efficacy of adoptively transferred CD8+ T cells. J Clin Invest. 115 (6), 1616-1626 (2005).
- Chen, G. M., et al. Integrative bulk and single-cell profiling of premanufacture T-cell populations reveals factors mediating long-term persistence of CAR T-cell therapy. Cancer Dis. 11 (9), 2186-2199 (2021).
- Frazer, G. L., Gawden-Bone, C. M., Dieckmann, N. M. G., Asano, Y., Griffiths, G. M. Signal strength controls the rate of polarization within CTLs during killing. J Cell Biol. 220 (10), e202104093(2021).
- Hermans, I. F., et al. The VITAL assay: a versatile fluorometric technique for assessing CTL- and NKT-mediated cytotoxicity against multiple targets in vitro and in vivo. J Immunol Meth. 285 (1), 25-40 (2004).
- Zaritskaya, L., Shurin, M. R., Sayers, T. J., Malyguine, A. M. New flow cytometric assays for monitoring cell-mediated cytotoxicity. Expert Rev Vaccines. 9 (6), 601-616 (2010).
- Piccinini, C., et al. In vitro CAR-T cell killing: validation of the potency assay. Cancer Immunol Immunother CII. 73 (9), 168(2024).
- Martinez, E. M., et al. High-throughput flow cytometric method for the simultaneous measurement of CAR-T cell characterization and cytotoxicity against solid tumor cell lines. SLAS Disc Adv Life Sci. 23 (7), 603-612 (2018).
- Jedema, I., van der Werff, N. M., Barge, R. M. Y., Willemze, R., Falkenburg, J. H. F. New CFSE-based assay to determine susceptibility to lysis by cytotoxic T cells of leukemic precursor cells within a heterogeneous target cell population. Blood. 103 (7), 2677-2682 (2004).
- Liu, L., et al. Cellular and molecular imaging of CAR-T cell-based immunotherapy. Adv Drug Delivery Rev. 203, 115135(2023).
- Liadi, I., et al. Defining potency of CAR+ T cells: Fast and furious or slow and steady. Oncoimmunology. 8 (10), e1051298(2019).
- Xhangolli, I., et al. Single-cell analysis of CAR-T cell activation reveals a mixed TH1/TH2 response independent of differentiation. Genom Proteom Bioinfo. 17 (2), 129-139 (2019).
- Zhou, Y., et al. Evaluation of single-cell cytokine secretion and cell-cell interactions with a hierarchical loading microwell chip. Cell Rep. 31 (4), 107574(2020).
- LaBelle, C. A., Zhang, R. J., Hunsucker, S. A., Armistead, P. M., Allbritton, N. L. Microraft arrays for serial-killer CD19 chimeric antigen receptor T cells and single cell isolation. Cytometry J Int Soc Anal Cytol. 103 (3), 208-220 (2023).
- Hellmann, M. J., et al. Heterogeneously deacetylated chitosans possess an unexpected regular pattern favoring acetylation at every third position. Nat Comm. 15 (1), 6695(2024).
- Wong, K. U., et al. Assessment of chimeric antigen receptor T cytotoxicity by droplet microfluidics in vitro. Antibody Therapeut. 5 (2), 85-99 (2022).
- Antona, S., Platzman, I., Spatz, J. P. Droplet-based cytotoxicity assay: Implementation of time-efficient screening of antitumor activity of natural killer cells. ACS omega. 5 (38), 24674-24683 (2020).
- Subedi, N., et al. An automated real-time microfluidic platform to probe single NK cell heterogeneity and cytotoxicity on-chip. Sci Rep. 11 (1), 17084(2021).
- Zhang, Y., et al. Enhanced CRISPR/Cas12a-based quantitative detection of nucleic acids using double emulsion droplets. Biosens Bioelect. 257, 116339(2024).
- Kochenderfer, J. N., et al. Construction and preclinical evaluation of an anti-CD19 chimeric antigen receptor. J Immunother. 32 (7), 689-702 (2009).
- Michaels, Y. S., et al. Precise tuning of gene expression levels in mammalian cells. Nat Comm. 10 (1), 818(2019).
- Yuan, Y., et al. Droplet encapsulation improves accuracy of immune cell cytokine capture assays. Lab on a Chip. 20 (8), 1513-1520 (2020).
- Brower, K. K., et al. Double emulsion flow cytometry with high-throughput single droplet isolation and nucleic acid recovery. Lab on a Chip. 20 (12), 2062-2074 (2020).
- Kirouac, D. C., et al. Deconvolution of clinical variance in CAR-T cell pharmacology and response. Nat Biotechnol. 41 (11), 1606-1617 (2023).
Reprints and Permissions
