This method describes the exploitation of the endogenous signal in an ARL13B-CENTRIN-2 transgenic mouse model to image primary cilia in situ, in three dimensions across large areas of mineralized tissue, from tissue collection to analysis of cilia organization. This protocol may also be applied to other types of tissues.
Method Article
Volumetric Imaging and Analysis of Primary Cilia in Musculoskeletal Tissue using the ARL13B-CENTRIN-2 Mouse Model
In This Article
Summary
Abstract
The primary cilium is a non-motile, solitary organelle assembled by most cell types. It is essential to the development and homeostasis of the skeleton and in coordinating cell responses to biochemical and mechanical cues from their surrounding environment. Due to its micrometer-scale size, the primary cilium is challenging to image in situ to characterize in tissues, in a high throughput manner and without optical biases. An understanding of its organization in its 3D environment in vivo will be key to understanding ciliary roles in physiology and disease. The ARL13B-CENTRIN-2 mouse line presents an mCherry tag on the ciliary axoneme protein ARL13B and a green fluorescent protein (GFP) tag on the centriole protein CENTRIN-2, localized to the base of the cilium. This mouse line allows for imaging of the primary cilium without the need for staining, which reduces the number of steps in image collection and circumnavigates issues with signal-to-noise. This publication describes a step-by-step protocol to image primary cilia in musculoskeletal tissues whilst preserving the fluorescent signal. It also describes a universally applicable image analysis pipeline, enabling unbiased quantification of cilia features, such as length and 3D orientation.
Introduction
The primary cilium is an essential organelle in the development and homeostasis of many tissues and organs, including the skeleton. During postnatal growth, it regulates cartilage mineralization during endochondral ossification1. In humans, genetic mutations that affect cilia-related proteins cause a range of diseases and developmental disorders, known as ciliopathies. An understanding of the organization of primary cilia inside tissues is important in understanding how they regulate cellular behavior at the organ level. Incidence, length, and orientation of primary cilia have been shown to vary within and between tissues, suggestive of a role for tissue organization to their function2,3,4. The growth plate, the layer of cartilage at the end of long bones where most postnatal bone growth occurs from early life and through adolescence, is a highly organized tissue with chondrocyte cells arranged in columns. In the growth plate, chondrocytes go through stages of differentiation, from the resting to proliferating to hypertrophic.
This cellular organization is lost in some ciliopathies, which suggests primary cilia may play a role in coordinating this cellular organization and/or, at the very least, be associated with cellular polarization. In addition, primary cilia orientation appears to play a role in their mechanosensory function, with differences observed between load-bearing and non-load-bearing regions in articular cartilage4. Our own recent studies have implied differential roles within different regions of articular cartilage and the growth plate5,6. Previous studies that have imaged primary cilia in the growth plate have been limited to 2D, which loses information related to cilia organization in tissue or are limited to a small number of cells in 3D, which reduces the scale and power of the analysis7,8.
Among the challenges to imaging the primary cilium are its micrometer-scale size and the non-specificity of immunohistochemistry antibodies. Using a native fluorescent signal ensures strong localization and specificity. Native fluorescent signals can, however, be challenging to image in mineralized tissues, as the long decalcification process to embed tissues in paraffin can result in loss of signal. Cryosectioning samples frozen in the native state prevents this loss by speeding up the embedding and sectioning process.
To image primary cilia in situ, a double transgenic mouse line was generated by Bangs et al., which expresses ADP-ribosylation factor-like protein (ARL13B) fused to mCherry and CENTRIN-2 fused to GFP9. ARL13B is a small GTPase localized to the primary cilium membrane, and CENTRIN-2 is a centriolar protein localized to the two centrosomes at the base of the cilium10,11. This mouse line, therefore, allows fluorescently labeled primary cilia to be imaged without the need for immunohistochemistry.
The protocol described here makes use of this transgenic line to image primary cilia in 3D in murine postnatal growth plates with confocal microscopy, only requiring additional 4',6-diamidino-2-phenylindole (DAPI) staining. Hundreds of primary cilia in hundreds of cells can be imaged and analyzed collectively in a tissue context. An image analysis pipeline subsequently measures primary cilia incidence, length, and orientation in the different regions of the growth plate. The pipeline is also able to quantify these features for centrioles. An outline of the steps in the protocol is presented in Figure 1.
Protocol
Animal husbandry and experiments were conducted in accordance with the University of Oxford ethical frameworks and under a Project license as granted by the UK Home Office. This protocol was performed on mice between the ages of 2 and 10 weeks but would work in the cartilage of mice beyond this age.
1. Tissue collection
- Euthanize mice by filling a box containing the mice with carbon dioxide up to 80% by volume and maintaining its concentration for 5 min. Perform cervical dislocation.
- Dissect out the tissue of interest.
NOTE: Below is a protocol for dissecting the hind leg knees, including the tibial and femoral growth plates and articular cartilage.- Incise the skin at the foot and cut to the top of the thigh. Remove skin from the incision line with forceps.
- Trim the muscle and fat tissue from the legs.
- To detach the leg from the body, cut cleanly through the femur at the top of the hip. Cut the foot at the bottom of the tibia.
- Remove any excessive muscle and fat tissue left on the leg.
2. Tissue fixation and embedding
NOTE: Throughout the protocol, take care to keep the tissue in the dark to avoid fluorescent signal loss.
- Fix the tissue in 10% formalin at room temperature for 4 h.
- Transfer the tissues to 2.5% formalin at 4 °C overnight.
- Transfer the tissues to 30% sucrose in distilled water (dH2O), and gently rotate at room temperature overnight or for 3 days at 4 °C. Fill the tubes to the top to ensure complete immersion of the tissue during the rotation. Following this incubation, the tissue will sink to the bottom of the tube.
- Place a small amount of dry ice in a separate box and position the cryomold on top. Trace a line of super cryoembedding medium (SCEM) and place the limb along it, with the kneecap facing down and opening the tibia and femur apart for the leg to be as flat as possible. Hold in place with forceps until the SCEM has started to solidify and the limb no longer moves when not held down.
- Cover completely with SCEM, filling the mold to the top. Place the sample in the dry ice box, keeping the sample flat to avoid movement of the tissue, until the SCEM completely solidifies.
- Transfer to -20 °C.
3. Sectioning
- Remove the block from the mold and trim to a size that fits on the chuck of a cryostat. Attach the block to the chuck by applying SCEM on the chuck and placing the block on top.
- Allow to solidify for at least 5 min at -20 °C in the cryostat.
- Attach the chuck to the sample holder and a blade to the blade holder.
- Trim the block until the tibial growth plate is reached. Ideally, section with the tibia pointing upwards.
- Cut cryofilm tape to a size that fits the sample with enough space surrounding it. Mount the cryofilm to the cut surface, ensuring tight adhesion of the cryofilm with a fitting tool. Cut 40-60 µm-thick sections to obtain two-cell thick sections. Collect the tape using forceps and place on a slide, sample side up, and the tibial growth plate in line with the short slide of the slide.
- Store the sample slides at -20 °C.
4. Slide preparation and mounting
- Thaw the slide horizontally at room temperature.
- Wash the slide with a drop of PBS for 3 x 5 min to remove the SCEM.
- Stain with 10 µM DAPI for 1 min.
- Wash the slide with a drop of PBS for 2 x 5 min.
- Mount, cover with a coverslip, and leave at room temperature overnight. Seal the edges of the coverslip with coverslip sealant.
- Image the following day.
5. Imaging by confocal microscopy
NOTE: The resolution of the 40x/1.4 objective on the confocal microscope used is 240 nm.
- Set up the microscope.
- Turn on the microscope and open the software. Click on the System button.
- Under the Acquisition tab, click on Smart Setup to set up the channels. Select and add the GFP, mCherry, and DAPI channels. Select the Airyscan option and the SR8Y function in the Airyscan triangle (between resolution and speed-multiplex 8Y). Click on Best Signal | OK (Supplemental Figure S1A).
- In the Locate tab, under Microscope Control, select the 40x/1.4 objective with oil immersion.
- Locate the region of interest.
- Place the slide in the slide holder and bring the objective up until the oil touches the coverslip.
- Position the growth plate or other region of interest underneath the light path.
- In the Locate tab, click on Fluorescence, select DAPI, and using the eyepiece, move the slide holder with the joystick to position the growth plate or region of interest under the field of view.
- In the Acquisition tab, start by selecting the DAPI channel only.
- Click on Continuous to view the image of that channel on the screen and ensure the growth plate is in view.
- Open the Tile viewer by clicking on Show viewer in the Tiles tab. Add the number of tiles required (usually 1 tile in the x direction and 3-5 in the y direction) and click on Preview and Start (Supplemental Figure S1B).
- Check that the tiles cover the three zones of the growth plate-resting, proliferation, and hypertrophic. Adjust the tile position and number as required.
- Set up the imaging parameters.
- Click on Continuous in the Acquisition tab. In the Channels tab, adjust the Gain (Master) and Laser power to view the nuclei clearly on the screen. Allow the Airyscan Detector to align. Open the Airyscan Detector Adjustment window by clicking on the tiled rosette symbol at the bottom of the window; once it has aligned, all the tiles will turn green (Supplemental Figure S1C).
- Select the GFP and mCherry channels individually and repeat these steps-setting the Gain (Master), Laser power, and align the Airyscan Detector.
- Select all three channels and click on Continuous. Allow the Airyscan Detector to align.
- In the Acquisition Mode tab, define the Image Size, Pixel, Size, Frame Size, Speed, and Averaging values. See Supplemental Figure S1D,E for values of Acquisition Mode settings, Gain (Master), and Laser power for the channels used.
- Acquire images.
- In the Acquisition tab, click on the Z-Stack tick-box.
- With just the DAPI channel selected, click on Continuous to view the image on the screen. Move the objective down to the closest plane to be imaged. In the Z-Stack tab, click on Set First plane, focus away to the last plane to be viewed, and click on Set Last plane. Image 30-40 µm z-stacks.
- Set the interval to 0.15 µm.
- Move to the center of the z-stack. In the Tiles tab, under Tile Regions, click on Verify and click on Set Z & move to next.
- Under the Focus Strategy tab, check that the focus strategy is set to Use Z Values/Focus Surface defined in the Tiles Setup.
- Click on Start Experiment to start the image acquisition.
- Image processing
- In the Processing tab, select Single or Batch mode. Select Airyscan processing. Tick 3D processing and select Standard Autofilter. Select the raw image acquired and start processing (Supplemental Figure S2A).
- Once the Airyscan Processing is completed, select Stitching in the processing methods. Select New Output, Fuse Tiles, Correct Shading, and All by reference, with the reference as DAPI. Select the Airyscan processed image and start processing (Supplemental Figure S2B).
- Save the raw and double-processed images. The latter is saved automatically in Batch mode.
6. Image analysis
NOTE: The analysis pipeline used here was customized to the purposes of this study. The details of the pipeline operations are shown in Supplemental Figure S3.
- Import the czi image file into the software. Open the analysis panel; in the dropdown select New Pipeline…
- To create a cell detection pipeline, import the Cellpose Python Segmenter into the pipeline12. Set Model_Name to cyto2, Input_channel to 2, Second_channel to 3, Diameter_in_µm to 10, Flow_threshold to 0.4, and Cellprob_threshold to 0. Add an Import Document Objects (renamed to Import Manual Labels) before and an Object Feature Filter (renamed to Size Filter) operator after the pipeline by clicking on + Add Operation. See Supplemental Figure S3A for the values of the pipeline settings.
- Move viewer to the first plane of interest
- Click on the Draw Objects Tool icon
- Click on the Polygon mode icon
- Draw area to analyzed
- Move viewer to the last plane of interest
- Draw area to be analyzed
- Click on the green tick Apply Changes
- Click on the Show Objects Table icon
- Right-click on the created object and select Rename Object to rename the object to an appropriate name. Right-click on the created object and click on Add Tag. Add a tag called Analysis Region.
- Run this pipeline by clicking on the forward blue arrow at the top of the Analysis panel.
- To create a primary cilia and centriole detection pipeline, open the analysis panel, in the drop down select New Pipeline…. Add the following operators to the pipeline: Import Document Objects (renamed to Import Manual Labels), two Intensity Threshold Segmenter operators (renamed to Cilia Threshold and Centriole Threshold), Splitting (renamed to Centriole Splitting), Object Feature Filter (renamed to Centriole Splitting size filter) and Compartment (renamed to Compartment - Cell). See Supplemental Figure S3B for the values of the pipeline settings.
- Run this pipeline by clicking on the forward blue arrow at the top of the Analysis panel.
- Open the Objects window. Click on Im/Export…, select Excel Export…. Select the following features to save: # Children, Name, Parent Names, 3D oriented bounds Short side, Middle side, Long side, Angle XY, Angle XZ, Angle YZ, Bounding Box X1, X2, Y1, Y2, Z1, Z2, SizeX, SizeY, SizeZ, Center of Geometry X, Y, Z, Plane First, Last, Count, Sphericity (Mesh), Volume (Mesh), Surface Area (Mesh).
Results
The growth plate of 6-week-old mouse was imaged using the described protocol and primary cilia organization mapped in the tissue. An image of all three regions of the growth plate -- resting, proliferative, and hypertrophic -- was captured and run through the analysis pipeline (Figure 2A). Individual cells can be identified with the DAPI staining, with their ciliary axoneme in red and their centrioles in green. The resolution using this method is high enough to discriminate individual centrioles (Figure 2B). At this resolution, the cilia can be visualized in their 3D environment, pointing in different directions (Video 1).
Lower resolution images, with higher magnification objectives, can also be captured to visualize primary cilia across a larger region of tissue; however, these are not suitable for analysis of cilia orientation in 3D. For instance, the primary cilia in articular cartilage were imaged with the 20x objective, demonstrating that the method also works on other tissues (Figure 2C). At this resolution, the ciliary axonemes in red can be identified, but the centrioles are more difficult to discriminate. Subchondral bone tends to present a lot of GFP background signal, making the identification of centriole difficult in this tissue.
The pipeline can detect individual cells, primary cilia, and centrioles, and it works for highly organized young growth plates and older growth plates where the columns are less well defined, as in 10-week-old mice (Figure 3). Cells and cilia are detected in 3D, as can be viewed across the z-stack.
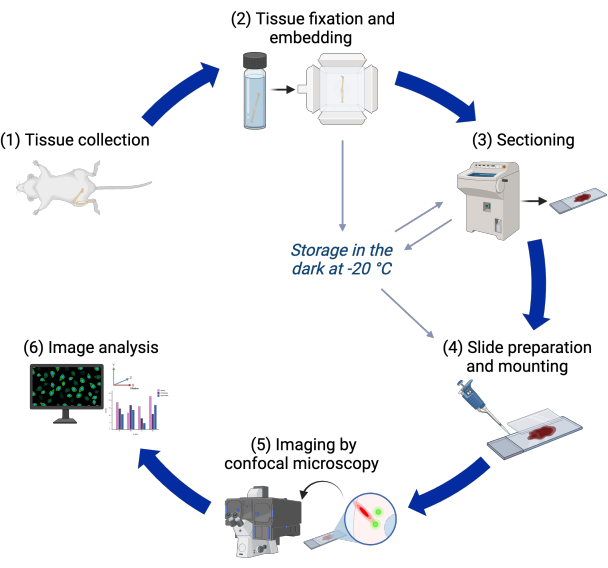
Figure 1: Experimental workflow. Flowchart of the different steps in the protocol from tissue collection to image analysis. Please click here to view a larger version of this figure.

Figure 2: Primary cilia in murine tissues of the ARL13B-CENTRIN-2 mouse. (A) A 6-week-old growth plate, with DAPI in white, CENTRIN-2 in green, and ARL13B in red, imaged with the 40x objective. (B) Zoom in on an individual primary cilium and its two centrioles. (C) Articular cartilage and subchondral bone of a 4-week-old mouse, imaged with the 20x objective. (D) Kidney of a 6-week-old mouse imaged using the same pipeline as for musculoskeletal tissue. (E) Magnification of the white box in D showing individual primary cilia and their centrioles in the kidney. Scale bars = 20 µm (A,D), 4 µm (B), 60 µm (C), 6 µm (E). Please click here to view a larger version of this figure.
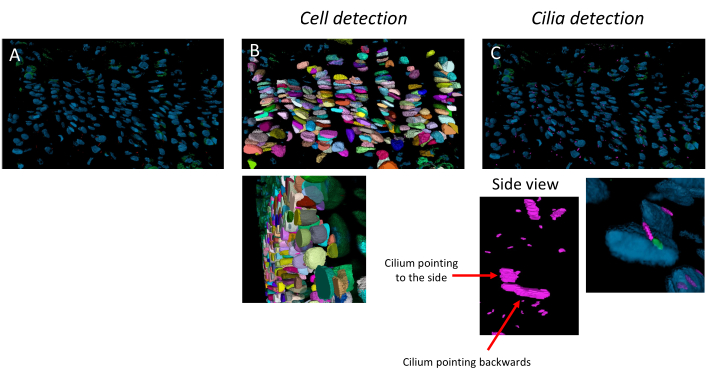
Figure 3: Cell and cilia detection pipeline. Example application of the image analysis pipeline on a 10-week-old growth plate. (A) Image opened in the software. (B) Result of the cell detection pipeline. (C) Result of the cilia and centriole detection pipeline. Cilia are in pink and centrioles in green. The side view exemplifies that the resolution is high enough to discriminate cilia oriented in different directions in 3D. Please click here to view a larger version of this figure.
Video 1: Three-dimensional reconstruction of a 6-week-old growth plate from the ARL13B-CENTRIN-2 mouse. The three-dimensional reconstruction was conducted in the Imaris software and recorded as an animation video. Please click here to download this Video.
Supplemental Figure S1: Image acquisition settings on the microscope system. (A) Smart Setup window to add the channels and choose the Airyscan mode. (B) Tile viewer to select and preview the tiles to image. (C) Airyscan Detector Adjustment window, where the alignment of the Airyscan detectors is confirmed once all the tiles turn green. (D) Laser settings for the three channels. (E) Acquisition Mode and Z-Stack settings. Please click here to download this File.
Supplemental Figure S2: Image processing settings on the microscope system. (A) Airyscan Processing settings. (B) Stitching settings. Please click here to download this File.
Supplemental Figure S3: Custom image analysis pipelines. (A) Cell detection pipeline using the GFP and DAPI channels. (B) Primary cilia and centriole detection pipeline using the mCherry and GFP channels, respectively. Please click here to download this File.
Discussion
In this protocol, it is essential to proceed with the tissue processing and embedding steps immediately after collection. The blocks and slides of tissue, however, can be kept for at least 3 months at -20 °C. Several steps in this protocol can be modified to suit different applications, in particular, section thickness, magnification, and z-stack parameters. This will impact the depth of imaging and the resolution obtained. Changes in numerical aperture and resolution mode could be used to obtain an even higher resolution and the z-stacks interval size decreased. However, this would increase imaging time or reduce the size of the field of view that can be imaged. The imaging parameters described are the minimum requirements identified for 3D analysis of primary cilia orientation.
The choice of mounting medium is important to obtain high resolution. The refractive index of the mounting medium must be similar to that of the immersion medium to minimize image degradation in the z-stack. The refractive index of the mountant and the immersion oil used here have refractive indexes of 1.52 and 1.518, respectively. The Airyscan function on the confocal microscope used here offers super-resolution images. Other super-resolution microscopes could be used; however, we found that the confocal mode only was not sufficient to obtain the resolution required for the size of the areas imaged. The maximum resolution of the Multiplex SR-8Y Airyscan mode is 120/160 nm in x/y and 450 nm in z, and a maximum number of frames/s of 47.5. We found the Multiplex SR-4Y Airyscan mode, which presents a maximum resolution of 140 nm in x/y and 450 nm in z but images at half the speed with a maximum number of frames/s of 25, not to present a significant difference for imaging primary cilia in 3D. Similarly, the Airyscan super-resolution (SR) mode, which offers the highest resolution on this microscope -- 120 nm in x/y and 350 nm in z -- would take longer to image, as its maximum number of frames/s is 4.713.
Background GFP signal can be observed in other tissues such as the muscle. To minimize this, the range of the lasers can be narrowed to reduce overlap with other wavelengths. This line has previously been used to image primary cilia in the embryo, primary cell cultures, muscle fibers, and the retinal pigment epithelium9,14,15. We have successfully imaged primary cilia in kidney, cartilage, and bone tissue. Some optimization of imaging settings will likely be required for different tissues; however, this cryosection protocol should ensure preservation of the signal.
Two-cell thick sections (40-60 µm) sections are sufficient to obtain 3D orientation information in the growth plate, as this allows imaging of whole cells and their primary cilia. For other tissues where cells are larger than chondrocytes, such as adipocytes, thicker sections may be required to collect cell population data. Depending on the depth resolution of the microscope used, it may not be possible to image deep into thicker sections. Tissue clearing techniques would likely lead to loss of the endogenous mCherry and GFP signal due to the time it requires. This was explored, as clearing methods were used for other imaging in the limb but it was not found necessary in this context. Our experience with endogenous CD31-RFP suggested clearing techniques would need careful, bespoke to sample, optimization.
This ARL13B-CENTRIN-2 line can be crossed with other mouse lines to further study the organization of primary cilia in tissues. For example, we have crossed it with an aggrecan-Cre IFT88fl/fl to conditionally knock out IFT88, a primary cilia protein whose deletion prevents ciliation, in aggrecan-expressing cells (postnatal chondrocytes)5,6. These ARL13B and CENTRIN-2 fluorescent signals can then be used to measure the efficiency of genetic perturbations at the level of ciliary structure in tissues and any associated changes in ciliary organization. Ongoing work is currently doing exactly this. Our first aim will be to quantify, with this more robust methodology, the effect of IFT88 deletion on cilia prevalence. Previously, we have gauged this by using immunofluorescence and estimated this to be a 20% reduction6. This method can also be combined with immunohistochemistry to image primary cilia in combination with other proteins, for example, a cell membrane protein.
The transgene on ARL13B may have an effect on ARL13B expression and primary cilia length. Previous studies have measured different primary cilia lengths with the ARL13B-CENTRIN-2 line compared to non-transgene ARL13B in certain regions of the mouse brain, with no difference in others16. Another study observed differences in primary cilia length in a GFP-tagged ARL13B mouse line compared to untagged ARL13B in mouse embryonic fibroblasts10. Ongoing work is verifying any changes in primary cilia length in the growth plate and other tissues by comparing the results using the ARL13B-CENTRIN-2 mouse line with antibody staining against non-transgenic ARL13B.
The image analysis pipeline in this protocol was designed to subsequently measure the ciliation percentage, length, and 3D orientation of primary cilia, as well as centriole number and position in the growth plate. The image analysis software allows for custom pipelines to be made by changing the steps involved. The output of this pipeline is a spreadsheet with the measures of the chosen features for the cells, cilia, and centrioles detected. Postanalysis can then be performed in R or other software according to the purposes of the study. As with the imaging settings, the pipeline steps and specific settings can be changed to work on different images and according to the aims of the study. Overall, this method allows high-throughput analysis of primary cilia than has been published previously in the growth plate. The number of cells and associated cilia that can be studied allows for larger and more reliable measurements.
Disclosures
The authors have no conflicts of interest to declare.
Acknowledgements
We thank all members of the BSU staff at the Kennedy Institute of Rheumatology, particularly Albertino Bonifacio, for animal husbandry. We thank the Oxford-ZEISS Centre of Excellence of Biomedical Imaging for assistance in using the microscope, in particular, Dr. Jacky (Ka Long) Ko for help in developing the image analysis pipeline. This work was supported by the Kennedy Trust of Rheumatology Research studentship (Johnson) and the Biotechnology and Biological Sciences Research Council (BBSRC, BB/X007049/1).
Materials
| Name | Company | Catalog Number | Comments |
|---|---|---|---|
| 22 x 50 mm cover slips | fisherscientific | 12373128 | |
| arivis Vision4D software | Zeiss | N/A | Image analysis software |
| Confocal laser scanning microscope | Zeiss | Zeiss 980 Airyscan 2 | |
| CoverGrip Coverslip Sealant | Biotium | 23005 | |
| Cryofilm type 3C(16UF) (sheet type) 2.0 cm width | Section-lab | C-FUF303 | To be purchased from Section-lab directly |
| Cryostat | Leica | CM1900 UV | |
| DAPI | invitrogen | D1306 | |
| Disposable Base Molds | epredia | 58952 | |
| Dulbecco's Phosphate Buffered Saline | gibco | 14190 | |
| Formalin | Sigma | 20260630 | |
| Imaris software | Oxford Instruments | N/A | Image analysis software for 3D reconstruction |
| Immersion Oil 518F | Zeiss | ISO 8036 | |
| Microtome blades | Feather | 02.075.00.006 | |
| SlowFade Glass Antifade Mountant | invitrogen | S36917 | |
| Sucrose | Sigma | S9378 | |
| Super Cryoembedding Medium (SCEM) | Section-lab | C-EM001 | To be purchased from Section-lab directly |
| Superfrost Plus Microscope slides | avantor | 631-0108 | |
| Zen software | Zeiss | N/A | Freeware for Confocal laser scanning microscopy |
References
- Wheatley, D. N., Wang, A. M., Strugnell, G. E. Expression of primary cilia in mammalian cells. Cell Biol Int. 20 (1), 73-81 (1996).
- Donnelly, E., Ascenzi, M. G., Farnum, C. Primary cilia are highly oriented with respect to collagen direction and long axis of extensor tendon. J Orthop Res. 28 (1), 77-82 (2010).
- McGlashan, S. R., et al. Mechanical loading modulates chondrocyte primary cilia incidence and length. Cell Biol Int. 34 (5), 441-446 (2010).
- Farnum, C. E., Wilsman, N. J. Orientation of primary cilia of articular chondrocytes in three-dimensional space. Anat Rec. 294 (3), 533-549 (2011).
- Coveney, C. R., et al. The ciliary protein IFT88 controls post-natal cartilage thickness and influences development of osteoarthritis. Arth Rheumatol. 74 (1), 49-59 (2021).
- Coveney, C. R., et al. Ciliary IFT88 protects coordinated adolescent growth plate ossification from disruptive physiological mechanical forces. J Bone Miner Res. 37 (6), 1081-1086 (2022).
- Andrea, C. E. D., et al. Primary cilia organization reflects polarity in the growth plate and implies loss of polarity and mosaicism in osteochondroma. Lab Invest. 90 (7), 1091-1101 (2010).
- Ascenzi, M. -G., et al. Effect of localization, length and orientation of chondrocytic primary cilium on murine growth plate organization. J. Theor Biol. 285 (1), 147-155 (2011).
- Bangs, F. K., Schrode, N., Hadjantonakis, A. K., Anderson, K. V. Lineage specificity of primary cilia in the mouse embryo. Nat. Cell Biol. 17 (2), 113-122 (2015).
- Larkins, C. E., Aviles, G. D. G., East, M. P., Kahn, R. A., Caspary, T. Arl13b regulates ciliogenesis and the dynamic localization of Shh signaling proteins. Mol Biol Cell. 22 (23), 4694-4703 (2011).
- Higginbotham, H., Bielas, S., Tanaka, T., Gleeson, J. G. Transgenic mouse line with green-fluorescent protein-labeled Centrin 2 allows visualization of the centrosome in living cells. Transgenic Res. 13 (2), 155-164 (2004).
- arivis. Application Note #47 - Applying Cellpose models in arivis Vision4D. , 1-20 (2021).
- Huff, J., Bergter, A., Luebbers, B. Application Note: Multiplex mode for the LSM 9 series with Airyscan 2: fast and gentle confocal super-resolution in large volumes. Nat Methods. , (2019).
- Ning, K., et al. Cilia-associated wound repair mediated by IFT88 in retinal pigment epithelium. Sci Rep. 13 (1), 8205-8219 (2023).
- Palla, A. R., et al. Primary cilia on muscle stem cells are critical to maintain regenerative capacity and are lost during aging. Nat Commun. 13 (1), 1439-1451 (2022).
- Brewer, K. K., et al. Postnatal dynamic ciliary ARL13B and ADCY3 localization in the mouse brain. Cells. 13 (3), 259-277 (2024).
Reprints and Permissions
