This study introduces a novel polar histogram visualization method for analyzing Acute Stress Disorder Scale (ASDS) scores, focusing on elderly ICU caregivers. The technique displayed all 19 ASDS variables simultaneously, revealing distinct stress patterns between healthy controls and caregivers while demonstrating significant improvements post-intervention in hyperarousal and avoidance symptoms.
A subscription to JoVE is required to view this content. Sign in or start your free trial.
Method Article
Polar Histogram Visualization of Acute Stress Disorder Scale Scores for Comprehensive Clinical Assessment
In This Article
Summary
Abstract
The Acute Stress Disorder Scale (ASDS) is crucial for assessing acute stress disorder (ASD), especially in high-stress environments like Intensive Care Units (ICUs). Traditional methods struggle to interpret all 19 ASDS variables simultaneously. This study introduces a novel polar histogram visualization approach to enhance ASDS score analysis, focusing on elderly ICU caregivers. A polar histogram visualization for ASDS scores was developed using MATLAB. Data from healthy elderly controls (n=106) and elderly ICU caregivers (EC-ICU; n=309) were used to compare ASDS profiles. A subgroup of EC-ICU participants (n=109) received interventions on social support and positive coping strategies. Intervention effectiveness and stress dysregulation patterns were analyzed using this new technique and traditional statistical methods. The polar histogram effectively displayed all 19 ASDS variables simultaneously, revealing distinct patterns between healthy controls (mean ASDS score: 29.36) and EC-ICU participants (mean ASDS score: 62.61). This technique highlighted significant differences in stress profiles not apparent in conventional bar charts. Post-intervention, the EC-ICU subgroup showed a 5%-8% reduction across ten ASDS indicators related to avoidance, hyperarousal, and emotional distress. The most significant improvements were physical reactions to trauma reminders, hypervigilance, and sleep disturbances. This polar histogram approach offers comprehensive, intuitive visualization of ASDS scores, enhancing clinical interpretation and ASD assessment. Integrating multi-dimensional psychological indicators into a single visual framework enables a more precise analysis of stress states and intervention efficacy. The technique shows particular utility in identifying stress patterns in elderly ICU caregivers and evaluating targeted interventions. This innovative method has significant implications for developing personalized support strategies, improving ASD assessment, and advancing stress disorder research across clinical settings.
Introduction
Acute Stress Disorder (ASD)1 is a significant mental health concern that can occur in the immediate aftermath of a traumatic event. It is characterized by a cluster of symptoms, including intrusion, negative mood, dissociation, avoidance, and arousal1,2,3. The accurate assessment and timely intervention of ASD are crucial, particularly in high-stress environments such as Intensive Care Units (ICUs), where both patients and caregivers are at elevated risk for developing stress-related disorders4,5,6
The Acute Stress Disorder Scale (ASDS) is a widely used tool for assessing ASD symptoms, consisting of 19 items that correspond to the diagnostic criteria outlined in the DSM-5 (Diagnostic and Statistical Manual of Mental Disorders, 5th Edition). While the ASDS has proven to be a reliable and valid measure, the interpretation and analysis of its multidimensional data present significant challenges for clinicians and researchers alike. Traditional methods of data presentation, such as simple statistical summaries or bar charts, often fail to capture the complex interplay between the various symptom clusters and may obscure important patterns within the data7,8.
In recent years, there has been a growing recognition of the importance of data visualization in enhancing the understanding of complex psychological phenomena9. Effective visualization techniques can reveal patterns, trends, and relationships that might otherwise remain hidden in raw data or basic statistical outputs. This is particularly relevant in the context of ASD assessment, where a comprehensive understanding of the symptom profile is essential for accurate diagnosis and targeted intervention10,11.
The limitations of current visualization methods for ASDS data have become increasingly apparent. Linear representations of the 19 ASDS variables often struggle to effectively convey the relationships between different symptom clusters. At the same time, three-dimensional visualizations can be difficult to interpret and may introduce perceptual biases. There is a clear need for a novel approach that can simultaneously represent all ASDS variables in an intuitive and easily interpretable format8,9.
In response to these challenges, this study introduces a polar histogram visualization technique for analyzing ASDS scores. This innovative method leverages the circular nature of polar coordinates to represent all 19 ASDS variables concurrently, allowing for a more holistic view of the ASD symptom profile. By employing this technique, the study aims to enhance the clinical interpretation and assessment of ASD, particularly in high-stress environments such as ICUs12,13.
The research focuses on elderly caregivers in ICU scenarios, a population that is particularly vulnerable to acute stress due to the demanding nature of caregiving and the often critical condition of their loved ones3,14. This study delves into the mental health status of elderly caregivers facing critically ill patients, revealing complex relationships between anxiety, depression, traumatic stress, social support, and coping strategies. These findings not only contribute to the development of more targeted support policies and interventions, improving healthcare systems but also raise public awareness about this group. In the long term, this research has profound implications for refining long-term care policies, promoting interdisciplinary research, and improving the quality of life for both elderly caregivers and the patients they care for, thereby providing important scientific evidence and practical guidance for addressing the social challenges brought about by an aging population.
By applying the polar histogram visualization method to this population, the study seeks to demonstrate its utility in identifying distinct stress patterns and evaluating the effectiveness of interventions9,15. The research aimed to explore the mental health status of the caregivers, revealing complex relationships between anxiety, depression, traumatic stress, social support, and coping strategies. Data collection methods included psychological consultations and interviews with ASD specialists. The intervention comprised Cognitive Behavioral Therapy (CBT) and mindfulness-based positive coping strategies, applied to a subset of 109 subjects. The study design incorporated a quantitative comparison between ASDS scores of elderly ICU caregivers and healthy elderly controls, as well as an evaluation of intervention effectiveness.
Access restricted. Please log in or start a trial to view this content.
Protocol
This study introduces a novel polar histogram visualization technique for analyzing Acute Stress Disorder Scale (ASDS) scores, focusing on elderly caregivers aged 60-80 years in Intensive Care Units (ICUs). The research was conducted at the Intensive Care Medicine Department of Dongzhimen Hospital, Beijing University of Chinese Medicine, in Beijing, China. Participant recruitment and data collection were conducted over a three-year period from January 2021 to December 2023. The study setup involved recruiting elderly ICU caregivers and healthy elderly controls from the local community. All participants provided informed consent before undergoing an ASDS assessment conducted by professional psychologists using the standardized 19-item ASDS questionnaire1. The software tools used in this study are listed in the Table of Materials.
1. Data collection and preparation
NOTE: The specific ASDS questionnaire version used is not critical to the research method. In this investigation, genuine ASDS data collected from clinical assessments were employed. The data were acquired using the standardized 19-item ASDS questionnaire. The dataset comprises scores for four distinct symptom clusters as defined by the DSM-IV: dissociation, re-experiencing, avoidance, and arousal.
- Data collection for ASDS
- Recruitment of participants
- Recruit study participants from two groups: elderly ICU caregivers aged 60-80 years and healthy elderly controls from the local community. The elderly caregivers (60-80 years) in this study were family members of ICU patients, not ICU patients themselves. Ensure all participants were cognitively capable of engaging in professional consultations with psychological counselors regarding the ASDS questionnaire.
- The acute stressor in the ASDS assessment specifically referred to their experience of having a family member in the ICU. Carefully screen to ensure that these caregivers did not have any major physiological illnesses themselves that could confound the stress assessment.
- For the healthy control group, recruit elderly individuals from the local community who have no current major illnesses and no immediate family members in critical care situations. Those who fall outside these criteria are considered part of the exclusion category. Ensure that all participants provide informed consent prior to any assessment or data collection.
- ASDS assessment
- Administer the standardized 19-item ASDS questionnaire1 (Figure 1) to all participants. Ask professional psychologists to conduct the ASDS assessment interviews to ensure consistency and reliability. Collect and record ASDS scores for all participants following the completion of the questionnaire.
- Intervention
- From the group of elderly ICU caregivers, randomly select a subset of 109 individuals to participate in the intervention. Apply Cognitive Behavioral Therapy (CBT)16 techniques to this intervention group. Additionally, implement mindfulness-based positive coping strategies as part of the comprehensive intervention approach.
- The intervention program integrated CBT techniques and mindfulness-based positive coping strategies delivered through a structured approach. For the CBT component, carry out two-weekly cognitive restructuring sessions (45 min each), daily progressive muscle relaxation training (15 min), and weekly problem-solving therapy (60 min), focusing on helping caregivers identify and modify negative thought patterns about ICU situations.
- For the mindfulness component, carry out daily morning meditation (20 min), evening body scan exercises (15 min), and brief mindful breathing exercises during ICU visits. Implement these interventions through a combination of weekly individual counseling, bi-weekly group workshops, take-home audio guides, and daily app-based check-ins for support and compliance monitoring.
- Ensure all sessions are conducted by certified clinical psychologists with at least 3 years of experience in CBT and mindfulness training to ensure intervention quality and consistency.
- For all EC-ICU participants who agreed to participate in the intervention program, ensure that the intervention was initiated within 24-48 h after their initial ASDS assessment. Use this standardized timing to minimize potential temporal confounding factors and ensure consistency in the intervention protocol.
- Administer the intervention over a 30-day period for all participants, starting from their initial intervention session. This standardized duration ensures the comparability of intervention outcomes across participants. Following the completion of the intervention, repeat the ASDS assessment process (Step 1.1.2) for the intervention group participants.
- Recruitment of participants
- Examination of the original ASDS data
- Open the spreadsheet data file. Browse through different sheets (Figure 1): Healthy, Elderly Caregiver - ICU (24H), EC-ICU (Intervention), and EC-ICU (Control).
- Ensure that the data matrices are as follows: Healthy group 19 x 106 Matrix, Elderly Caregiver - ICU (24 h) 19 x 309 Matrix, EC-ICU(Intervention) 19 x 109 Matrix, and EC-ICU (Control) 19 x 200 Matrix.
- The ASDS questionnaire comprises 19 items that assess four distinct symptom clusters: Dissociative Symptoms (Items 1-5, measuring emotional numbness, daze states, unreality experiences, physical detachment, and trauma-related amnesia), Reexperiencing Symptoms (Items 6-9, evaluating intrusive thoughts, nightmares, flashbacks, and emotional reactivity to trauma reminders), Avoidance Symptoms (Items 10-13, assessing cognitive and behavioral avoidance of trauma-related thoughts, conversations, situations, and emotional responses), and Arousal Symptoms (Items 14-19, examining sleep disturbance, irritability, concentration problems, hypervigilance, startle response, and physical reactions to trauma reminders). For the intervention approaches targeting these symptom clusters see step 1.1.3, which describes the implemented CBT techniques and mindfulness-based strategies.

Figure 1: Acute Stress Disorder Scale (ASDS) data. This figure displays the organization of ASDS data in spreadsheets for different participant groups. Please click here to view a larger version of this figure.
- Importing ASDS data into MATLAB workspace
- Open the spreadsheets options menu, click the Add-ins tab, and enter the Add-ins management interface (Figure 2). Browse and add MATLAB's excllink.xlam, which is usually located in MATLAB's toolbox\exlink directory.
- In spreadsheet, select the Data for Each Group as viewed in Step 1.1.2, then click on the MATLAB plugin's Send data to MATLAB option. Then, all data can be seen in MATLAB's workspace. The Variable data_h contains the Healthy group 19 x 106 Matrix; the Variable data_ec contains the EC-ICU(Intervention) 19 x 109 Matrix; and the Variable data_control contains the EC-ICU (control) 19 x 200 Matrix.

Figure 2: Add-ins management interface for integrating MATLAB plugin. This image shows the spreadsheet interface for adding the MATLAB plugin, enabling data transfer between spreadsheet and MATLAB. Please click here to view a larger version of this figure.
2. Ordinary Statistics for ASDS of Elderly Caregiver - ICU
NOTE: Conventional statistical analysis can provide a general overview of the data's basic characteristics. However, it can also form a distinct contrast with the subsequent Polar Histogram Visualization.
- Using the commands means = mean (data_ec, 2); and total_scores = sum (data, 1) obtain the mean values of the 19 variables and the sum scores for the ASDS of Elderly Caregiver - ICU, respectively.
- Use the code in Supplementary Coding File 1 to view the distribution of mean values and sum scores for the 19 variables of the ASDS of Elderly Caregiver - ICU, as shown in Figure 3.

Figure 3: Distribution of mean values and sum scores for the 19 variables of the ASDS of Elderly Caregiver - ICU. These graphs illustrate the mean scores for each ASDS item and the distribution of total ASDS scores among elderly caregivers in the ICU. Please click here to view a larger version of this figure.
3. Polar histogram perspective of ASDS for elderly caregivers
NOTE: Using a polar histogram to compare healthy elderly individuals with Elderly Caregivers-ICU provides a more intuitive visualization of the differences between the two sample groups.
- Using the commands mean_ec = mean (data_ec, 2); and mean_h = mean (data_h, 2) calculate the ASDS sample means for the Elderly Caregivers group and the healthy group, respectively.
- Use the polarhistogram command to create an overlaid plot of the two variables mean_ec and mean_h (Figure 4).
- Add coordinates and annotations to the figure using the code provided in Supplementary Coding File 1.
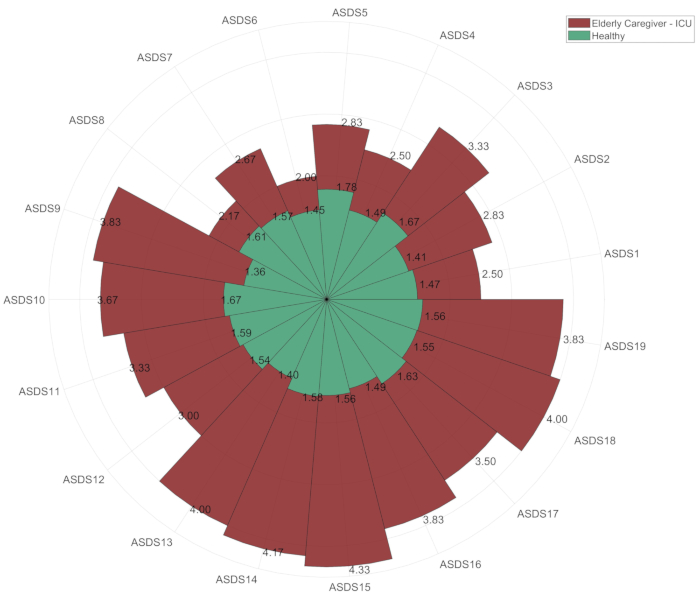
Figure 4: Polar histogram comparison of ASDS scores between Elderly Caregivers - ICU and Healthy Elderly Individuals. This polar histogram visually compares ASDS scores between elderly caregivers in ICU and healthy elderly controls, highlighting differences across all 19 ASDS variables. Please click here to view a larger version of this figure.
4. Ordinary statistics of intervention
NOTE: Typically, comparisons of ASDS scores are conducted using bar graphs for visual contrast.
- To analyze the Acute Stress Disorder Scale (ASDS) scores across different groups, calculate the sample means using the following MATLAB commands:
For the Elderly Caregivers group (Original Data): mean_ec = mean(data_ec, 2);
For the EC-ICU Intervention group (Control Group): mean_control = mean(data_control, 2);
For the healthy control group (Intervention Group): mean_h = mean(data_h, 2); - Plot a comparison as shown in Figure 5 by using the command bar ([mean_ec, mean_control, mean_h]). Add figure annotations using the commands xticklabels and ylabel.

Figure 5: ASDS prognostic analysis of EC-ICU intervention group. This bar graph compares ASDS scores across three groups: original elderly caregivers, control group, and intervention group, showing the impact of interventions. Please click here to view a larger version of this figure.
5. Polar histogram perspective of intervention
NOTE: Using a Polar Histogram to compare the prognosis of the EC-ICU Intervention group (Figure 6) can result in more reliable and significant visualization outcomes.
- Use the following code: data_diff=abs(mean_control-mean_intevention); [~, idxx]=sort(data_diff) to rank the effects on prognosis, obtaining the variable idxx for the ranking of the 19 ASDS items' prognosis effects.
- Use the polarhistogram command to create an overlaid plot of the control group and intervention group, and plot and annotate according to the order of idxx to obtain Figure 6.

Figure 6: Polar histogram comparison of control and intervention groups. This polar histogram visualizes the differences in ASDS scores between the control and intervention groups, emphasizing the effects of the intervention on specific ASDS items. Please click here to view a larger version of this figure.
Access restricted. Please log in or start a trial to view this content.
Results
Figure 1 displays the ASDS data of elderly caregivers in the ICU. Using MATLAB's plugin (Figure 2), the data can be imported into MATLAB's workspace. Figure 3 presents the characteristics of the ASDS data for elderly caregivers in the ICU: the mean is 3.3, and the cumulative value is 62.6. This indicates that the ASDS level of participants in the ICU scenario is not extremely high but si...
Access restricted. Please log in or start a trial to view this content.
Discussion
This study introduces a novel polar histogram visualization technique for analyzing Acute Stress Disorder Scale (ASDS) scores, with particular emphasis on its application in assessing elderly caregivers in Intensive Care Units (ICUs). The method provides a comprehensive and intuitive visual representation of all 19 ASDS variables simultaneously, offering significant advantages over traditional statistical approaches1,6,17.
<...Access restricted. Please log in or start a trial to view this content.
Disclosures
The polar histogram visualization in this study was programmed by co-author Fangliang Xing. The authors declare no conflicts of interest.
Acknowledgements
This study was supported by the Fundamental Research Funds for the Central Universities from Beijing University of Chinese Medicine through the project Study on the effect and mechanism of YiQiHuoXue prescription on inhibiting platelet-leukocyte aggregation in sepsis-induced myocardial dysfunction (Project No. 2024-JYB-JBZD-019).
Access restricted. Please log in or start a trial to view this content.
Materials
| Name | Company | Catalog Number | Comments |
|---|---|---|---|
| EXCEL | Microsoft | Office2021 | ASDS Data Collection |
| MATLAB | MathWorks | 2023B | Computing and visualization |
References
- Bryant, R. A., Moulds, M. L., Guthrie, R. M. Acute stress disorder scale: a self-report measure of acute stress disorder. Psychol Assess. 12 (1), 61-68 (2000).
- Wang, C., et al. A longitudinal study on the mental health of general population during the COVID-19 epidemic in China. Brain Behav Immunity. 87, 40-48 (2020).
- Chew, N. W. S., et al. A multinational, multicentre study on the psychological outcomes and associated physical symptoms amongst healthcare workers during COVID-19 outbreak. Brain Behav Immunity. 88, 559-565 (2020).
- Shaw, R. J., et al. Acute stress disorder among parents of infants in the neonatal intensive care nursery. Psychosomatics. 47 (3), 206-212 (2006).
- Lee, R. Y., et al. Novel risk factors for posttraumatic stress disorder symptoms in family members of acute respiratory distress syndrome survivors. Crit Care Med. 47 (7), 934-941 (2019).
- Meiser-Stedman, R., et al. Acute stress disorder and the transition to posttraumatic stress disorder in children and adolescents: Prevalence, course, prognosis, diagnostic suitability, and risk markers. Depression Anxiety. 34 (4), 348-355 (2017).
- Segal, A., et al. Attention control therapy for acute stress disorder: A randomized controlled trial. Depression Anxiety. 37 (10), 1017-1025 (2020).
- Webb, E. K., et al. Acute posttrauma resting-state functional connectivity of periaqueductal gray prospectively predicts posttraumatic stress disorder symptoms. Biol Psychiatry Cogn Neurosci Neuroimaging. 5 (9), 891-900 (2020).
- Weis, C. N., et al. Acute White Matter Integrity Post-trauma and Prospective Posttraumatic Stress Disorder Symptoms. Front Human Neurosci. Front Human Neurosci. 15, 742198(2021).
- Ostrowski, S. A., et al. The impact of caregiver distress on the longitudinal development of child acute post-traumatic stress disorder symptoms in pediatric injury victims. J Pediat Psychol. 36 (7), 806-815 (2011).
- Straud, C. L., et al. Patterns of acute stress disorder in a sample of blast-injured military service members: A latent profile analysis. Psychol Trauma. 15 (2), 255-264 (2023).
- Hoge, E. A., et al. The effect of mindfulness meditation training on biological acute stress responses in generalized anxiety disorder. Psychiatry Res. 262, 328-332 (2018).
- Czaja, A. S., Moss, M., Mealer, M. Symptoms of posttraumatic stress disorder among pediatric acute care nurses. J Pediat Nurs. 27 (4), 357-365 (2012).
- Lenferink, L. I. M., et al. Latent classes of DSM-5 acute stress disorder symptoms in children after single-incident trauma: findings from an international data archive. Eur J Psychotraumatol. 11 (1), 1717156(2020).
- Edmondson, D., Mills, M. A., Park, C. L. Factor structure of the acute stress disorder scale in a sample of Hurricane Katrina evacuees. Psychol Assessment. 22 (2), 269-278 (2010).
- Kaczkurkin, A. N., Foa, E. B. Cognitive-behavioral therapy for anxiety disorders: an update on the empirical evidence. Dialogue Clin Neurosci. 17 (3), 337-346 (2015).
- Silver, R. C., Holman, E. A., McIntosh, D. N., Poulin, M., Gil-Rivas, V. Nationwide longitudinal study of psychological responses to September 11. JAMA. 288 (10), 1235-1244 (2002).
- Brown, R. C., et al. Predicting the transition from acute stress disorder to posttraumatic stress disorder in children with severe injuries. J Pediat Health Care. 30 (6), 558-568 (2016).
- Connor, J. P., Brier, Z. M. F., Price, M. The association between pain trajectories with posttraumatic stress disorder, depression, and disability during the acute posttrauma period. Psychosomatic Med. 82 (9), 862-868 (2020).
Access restricted. Please log in or start a trial to view this content.
Reprints and Permissions
