Cryo-electron tomography (cryo-ET) enables 3D visualization of cellular ultrastructure at nanometer resolution, but manual segmentation remains time-consuming and complex. We present a novel workflow that integrates advanced virtual reality software for segmenting cryo-ET tomograms, showcasing its effectiveness through the segmentation of mitochondria in mammalian cells.
Method Article
Leveraging Virtual Reality for Immersive Segmentation and Analysis of Cryo-Electron Tomography Data
* These authors contributed equally
In This Article
Summary
Abstract
Cryo-electron tomography (cryo-ET) is a powerful technique for visualizing the ultrastructure of cells in three dimensions (3D) at nanometer resolution. However, the manual segmentation of cellular components in cryo-ET data remains a significant bottleneck due to its complexity and time-consuming nature. In this work, we present a novel segmentation workflow that integrates advanced virtual reality (VR) software to enhance both the efficiency and accuracy of segmenting cryo-ET datasets. This workflow leverages an immersive VR tool with intuitive 3D interaction, enabling users to navigate and annotate complex cellular structures in a more natural and interactive environment. To evaluate the effectiveness of the workflow, we applied it to the segmentation of mitochondria in retinal pigment epithelium (RPE1) cells. Mitochondria, essential for cellular energy production and signaling, exhibit dynamic morphological changes, making them an ideal test sample. The VR software facilitated precise delineation of mitochondrial membranes and internal structures, enabling downstream analysis of the segmented membrane structures. We demonstrate that this VR-based segmentation workflow significantly improves the user experience while maintaining accurate segmentation of intricate cellular structures in cryo-ET data. This approach holds promise for broad applications in structural cell biology and science education, offering a transformative tool for researchers engaged in detailed cellular analysis.
Introduction
Cryo-electron tomography (cryo-ET) has revolutionized our ability to visualize cellular components in their near-native state at high-resolution1,2. This powerful technique allows researchers to characterize cellular ultrastructure, providing unprecedented insights into cellular architecture and function. However, cryo-ET is not without its limitations, chief among them is the requirement that samples be thin enough to be electron transparent (typically <0.5 µm) for imaging in standard cryo-capable transmission electron microscopes. Recent advancements in cryo-focused ion beam milling have enabled the thinning of thick samples for cryo-ET analysis3,4.
Typical cryo-ET workflows begin with the collection of a tilt-series, where the sample is imaged at various angles, ranging from +60° to -60°. These images are then computationally aligned and backprojected to create a three-dimensional (3D) volume or tomogram5,6,7. This tomogram serves as a detailed 3D map of the cellular landscape, offering both spatial and temporal information about cellular structures. Further refinement through subtomogram averaging, where multiple copies of the same structure are aligned and averaged, can push resolution limits even further, sometimes achieving sub-nanometer resolution7,8,9,10.
A crucial step in extracting meaningful biological information from these tomograms is segmentation. This process involves annotating specific cellular structures, such as membranes, within the 3D volume. Segmentation enables advanced analyses, including the calculation of intermembrane distances and membrane curvature, providing valuable insights into cellular processes11,12. While several software packages are available for this task, including Dragonfly, Amira, MemBrain, EMAN2, and tomomemsegtv13,14,15,16,17, the segmentation process remains a significant bottleneck in cryo-ET data analysis. It is often a labor-intensive and time-consuming manual process, potentially taking weeks to months to complete. Many of these packages offer automatic segmentation features but frequently require extensive manual correction to remove false positives, a process that can be laborious and unintuitive when performed slice-by-slice or in 3D.
We propose an alternative approach by leveraging virtual reality (VR) technology to address these challenges. VR offers an immersive and interactive method for data visualization, allowing users to navigate through the tomographic volume as if inside the cellular environment itself. This approach also provides a valuable platform for science education and scientific exploration and discovery of in situ cryo-ET data by providing an immersive and uniquely engaging experience. In this work, we present a protocol for cryo-ET data segmentation using syGlass18, VR software designed for scientific visualization. This software provides a comprehensive toolkit for cryo-ET data analysis, including manual segmentation, refinement of automatically generated segmentations, and even particle picking within tomograms. Our study demonstrates the viability of VR as a powerful tool for cleaning segmentations, particle picking, and manual segmentation in cryo-ET data analysis.
To illustrate the utility of the VR software for cryo-ET segmentation, we focus on the analysis of mitochondrial morphology in retinal pigment epithelium (RPE1) cells. Mitochondria serve as an excellent test case for segmentation due to their complex structure and the presence of readily quantifiable features, such as the distance between outer and inner mitochondrial membranes. These features can be accurately measured using surface morphometrics analysis tools12, providing robust metrics for assessing segmentation quality. This protocol provides step-by-step instructions for segmenting cryo-ET data using syGlass, demonstrating its utility within the cryo-ET segmentation pipeline. By incorporating VR-based segmentation into the cryo-ET workflow, we aim to improve both the efficiency and accuracy of manual structural analysis in cellular biology.
Protocol
1. Preparing cryo-ET data for segmentation
- Convert raw Cryo-ET tomograms into a data format compatible with syGlass, such as TIFF stacks. Set the signal so that the particles are white on black, and perform histogram equalization with ImageJ19.
NOTE: To enhance the signal-to-noise ratio, it is recommended that the tomograms be denoised with software such as Warp20, Topaz Denoise21, cryoCARE22,23, or IsoNet24 before being imported into the software. - Launch the VR software on the computer. Navigate to the File menu and select Create Project.
- Click on Create New Project | Add Files. Navigate to the location where the TIFF files are saved, and import them into the software.
- When prompted to confirm if the files are a time series, click No.
- Name the project, then click Save to create a new project under the project list.
- Double-click the project to open the tomogram and load it into the software interactive virtual reality environment.
2. Setting up virtual reality (VR)
- Connect the VR headset and hand controllers to the computer.
- Follow the onscreen instructions to calibrate the VR environment.
NOTE: Calibration refers to the three-dimensional space where the segmentation will be done. The parameters (Length, width, and height) of the working space need to be defined before the VR projection is displayed. The VR projection will only be visible in these parameters. - Segmentation will be done only within the defined working three-dimensional space.Ensure the field of view contains the area desired to be worked on in the VR environment.
3. Optimizing 3D visualization
- Click on the Visualization button in the software interface. Adjust various visualization options such as contrast, windowing, brightness, and threshold sliders to enhance the signal and minimize noise.
- Use the hand controllers to pull the tomogram closer or push it away as needed.
- Activate the Cut tool using the left-hand controller to inspect different slices within the tomogram visually.
4. Segmentation process
- Navigate through the tomogram to the desired slice where segmentation will begin.
- Activate the Region of Interest (ROI) option under the annotation menu using the hand controllers. A green box will appear within the tomogram.
- Adjust the size and position of the green box, moving it to the area to be segmented.
- Lock the ROI using the left-hand controller and initiate segmentation. After locking the ROI, the tool automatically switches to a paint mode that allows segmentation of the volumetric data.
- Zoom in or out of the tomogram for precise segmentation.
- Adjust the paint brush size by rotating clockwise or counterclockwise for optimal control.
- Carefully segment the ROI (e.g., mitochondrial membranes) within the selected 3D area. If an error occurs during segmentation, press and hold the secondary controller trigger to engage erase mode, then erase the error using the same motion as segmenting.
- Repeat this process region by region until the entire tomogram is segmented.
5. Exporting segmented data and analysis
- After completing the segmentation, select the project by clicking on it to ensure it is highlighted.
- Click the Projects tab in the upper-left corner, then select ROIs.
- Choose to export either the entire volume or a specific ROI. Specify the export location for the segmented data.
- Load and analyze the segmented data using the software of choice and generate figures for publication.
6. Importing binary mask into the software for cleanup
- Perform steps 1.1-1.6.
- Right-click on the project and click Add mask data. Then, navigate to where the initial segmentation is saved and import it under the same project.
- Engage ROI annotation to make edits to the initial segmentation.
- Add/erase segmentation to clean up the initial segmentation.
- Adjust Mask ROIs under the ROI option in the masks tab. To change the mask ROI from one to the other, turn on the only overwrite mask option and go to paint mode with the hand controller. This mode will only overwrite mask data that is visible.
- Export the adjusted mask ROIs utilizing the steps described in steps 5.1-5.3.
7. Picking particles coordinates using the VR software
- Create a project using tomogram (TIFF stack) utilizing the steps described in section 1.
- Click on Annotation | Count, which opens a window with manual or automated options.
- For the manual option, choose a color for the counts, and start marking coordinates.
- For the automated option, choose a cell size and input the resolution. Click on Run auto counting, edit the counts (keep good picks and discard bad ones), and save the progress.
- Export the count coordinates by clicking on the project tab | annotations.
- For the annotation origin, choose Bottom Left Corner and for Annotation Units, choose Voxels.
- Click on the counting points cell to highlight the cell.
- Click on Export selected to save the coordinates of the selection in a .csv file.
NOTE: This file can be used to extract subtomograms from the tomogram for subtomogram averaging
Results
In this study, we segmented tomograms containing mitochondria and additional membranous organelles (e.g., vesicles, endoplasmic reticulum) using syGlass. Tomograms were initially reconstructed in Warp using weighted-back projection at 16.00 Å/pixel and were subjected to missing wedge correction and denoising utilizing the software IsoNet. The following tomograms were subjected to additional processing for import as shown in Figure 1A (also see Supplemental Video S1, Supplemental Video S2, Supplemental Video S3, and Supplemental Video S4).
Following preprocessing, tomograms in MRC format were converted into TIFF stacks using ImageJ, with contrast inversion applied to make membranes appear white on a black background. Histogram equalization was then performed to further enhance contrast; this also allows for more effective thresholding. The TIFF stacks were imported and visualized in 3D within an immersive VR environment, providing detailed inspection of membranous structures utilizing the cut-tool in the software shown in Figure 1B.
Manual segmentation was performed in the software, with windowing set to auto and brightness/threshold adjustments made to optimize cellular feature visibility. ROIs around mitochondria and other structures were defined using the VR controllers. The segmentation tool allowed precise delineation of membrane boundaries, with errors corrected using the erase function. Slice-by-slice navigation or in 3D using the ROI tool to box regions throughout the tomogram, combined with the adjustable paint brush tool, ensured accurate segmentation of the mitochondrial membranes and other organelles as shown in Figure 1C.
The segmented data were visualized by generating a mesh using the ROI tool's surfaces option, with smoothing iterations set to 12 and resolution level set to 3. The final 3D renderings clearly demonstrate mitochondrial structures, including the outer and inner membranes, cristae, and calcium phosphate deposits as shown in Figure 1D (also see Supplemental Video S5, Supplemental Video S6, Supplemental Video S7, and Supplemental Video S8).
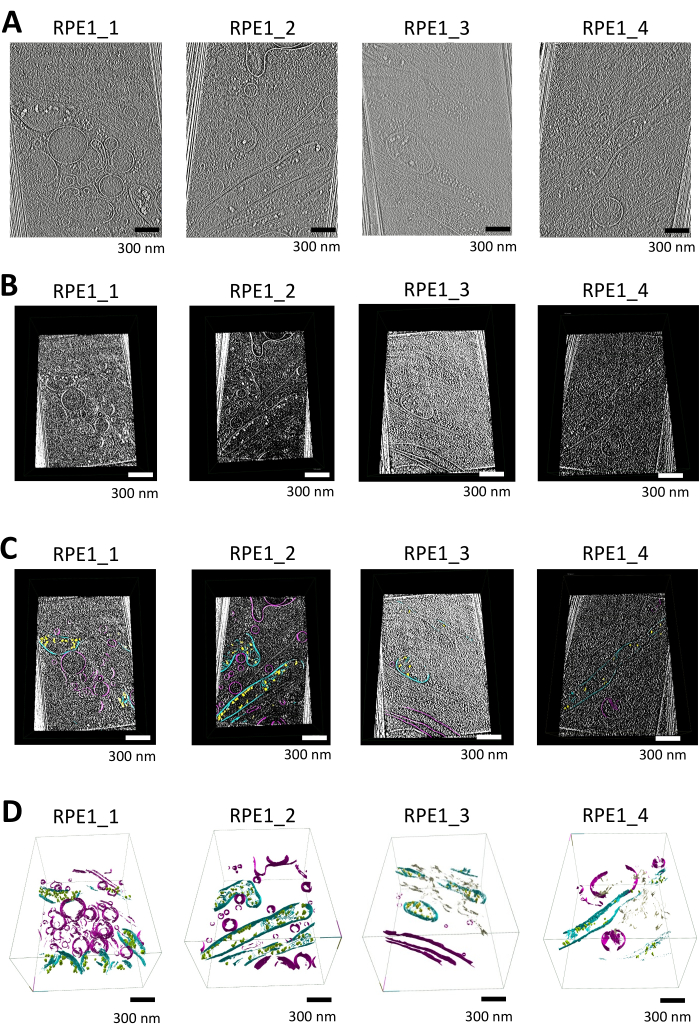
Figure 1: Workflow of tomogram visualization, segmentation, and 3D rendering using syglass. (A) Tomographic slices of thin-edge RPE1 cells. IsoNet-corrected tomograms reconstructed in Warp and used for segmentation with syGlass, visualized with IMOD25. The tomograms were collected on a 300 keV Titan-Krios microscope equipped with a K3 detector and focused on the thin edges of retinal epithelium cells. Each tomogram contains at least one mitochondrion along with various other membrane-bound organelles. These images are still images from videos shown in Supplemental Video S1, Supplemental Video S2, Supplemental Video S3, and Supplemental Video S4. (B) Corresponding tomograms visualized in the software. Tomographic slice created using the cut tool in the VR software after optimizing thresholding, brightness, and windowing, revealing distinct cellular structures. (C) Tomograms visualized in the software with segmented membranes. Tomographic slice created with the cut tool in VR software, overlaid with the corresponding segmentation. Calcium phosphate deposits are shown in yellow, mitochondrial membranes in cyan, and other membranes such as vesicles and the plasma membrane in purple. (D) 3D rendering of the segmented membranes in syGlass. The mitochondrial membranes, including the cristae, outer, and inner mitochondrial membranes, are shown in cyan. Calcium phosphate deposits are in yellow or green, vesicles and the plasma membrane are in purple, and the endoplasmic reticulum are in tan. These images are still images from videos shown in Supplemental Videos S5, Supplemental Video S6, Supplemental Video S7, and Supplemental Video S8. Please click here to view a larger version of this figure.
Supplemental Video S1: Tomogram of sample RPE-1_1 used for segmentation in this study. This tomogram is reconstructed at 16 Å/pixel using Warp, then denoised and corrected for the missing wedge with IsoNet. Please click here to download this File.
Supplemental Video S2: Tomogram of sample RPE-1_2 used for segmentation in this study. This tomogram is reconstructed at 16 Å/pixel using Warp, then denoised and corrected for the missing wedge with IsoNet. Please click here to download this File.
Supplemental Video S3: Tomogram of sample RPE-1_3 used for segmentation in this study. This tomogram is reconstructed at 16 Å/pixel using Warp, then denoised and corrected for the missing wedge with IsoNet. Please click here to download this File.
Supplemental Video S4: Tomogram of sample RPE-1_4 used for segmentation in this study. This tomogram is reconstructed at 16 Å/pixel using Warp, then denoised and corrected for the missing wedge with IsoNet. Please click here to download this File.
Supplemental Video S5: The resulting segmentation of sample RPE-1_1 after generating surfaces. The mitochondrial membranes are shown in cyan; calcium phosphates within the mitochondria are depicted in yellow; the endoplasmic reticulum is shown in tan; and other membranes are displayed in purple. Please click here to download this File.
Supplemental Video S6: The resulting segmentation of sample RPE-1_2 after generating surfaces. The mitochondrial membranes are shown in cyan; calcium phosphates within the mitochondria are depicted in yellow; the endoplasmic reticulum is shown in tan; and other membranes are displayed in purple. Please click here to download this File.
Supplemental Video S7: The resulting segmentation of sample RPE-1_3 after generating surfaces. The mitochondrial membranes are shown in cyan; calcium phosphates within the mitochondria are depicted in yellow; the endoplasmic reticulum is shown in tan; and other membranes are displayed in purple. Please click here to download this File.
Supplemental Video S8: The resulting segmentation of sample RPE-1_4 after generating surfaces. The mitochondrial membranes are shown in cyan; calcium phosphates within the mitochondria are depicted in yellow; the endoplasmic reticulum is shown in tan; and other membranes are displayed in purple. Please click here to download this File.
Discussion
In this work, we demonstrated how VR, specifically using syGlass, can be integrated into the cryo-ET pipeline to effectively segment cellular structures. Although our focus was primarily on membranes, there is no inherent limitation preventing the segmentation of other cellular structures, such as filaments or ribosomes, as one can adjust the brush shape and size, and thresholding to ensure that only voxels corresponding to the desired cellular objects are marked. One of the major advantages of VR in segmentation is the intuitive, hands-on interaction with the data, thereby allowing users to visualize and manipulate volumes as if they were physically inside them. Traditional methods of manual segmentation or cleaning initial segmentation masks typically involve working directly on a computer, which can be less immersive and slower to annotate.
By incorporating VR into the cryo-ET workflow, users can not only rapidly interact with segmentation masks generated by other software, but also use VR to guide the segmentation of partially segmented structures and efficiently clean up false positives. Currently, manual segmentation is still required for most annotation use cases, and the presented workflow enables users to generate segmentations that are suitable for downstream analysis with improved ease and speed. For this study we used the HTC Vive VR headset, but the software is compatible with devices that have SteamVR or OculusVR support.
For optimal application of this protocol, the cryo-ET data should meet specific criteria, such as high-quality tomograms with a high signal-to-noise ratio (SNR). The SNR is an essential parameter, as the clarity of structural features directly influences the effectiveness of manual segmentation in VR. Preprocessing steps such as missing wedge correction and denoising are key parts of the workflow; in this protocol, we utilized IsoNet for these purposes. The tomograms should be reconstructed at a suitable resolution -- using a voxel size that provides sufficient structural detail and enough separation between cellular structures to enable effective segmentation between the structures while further maintaining manageable data sizes for VR visualization. Additionally, inverted contrast with cellular structures appearing white on a black background and histogram equalization should be applied to enhance the visibility of membranes and other structures within the syGlass environment.
Several critical points must be considered to ensure the success of this protocol. First, during data preprocessing, accurate application of contrast inversion and histogram equalization is vital; improper adjustments can result in suboptimal visualization in VR, making segmentation challenging. Second, within the VR software, appropriate adjustments of windowing, brightness, and threshold settings are essential for optimal visualization of structures. Users should experiment with these settings to achieve the best results for their specific datasets and VR setups.
When it comes to troubleshooting, users may encounter issues such as VR system performance limitations, especially when handling large tomogram datasets. If the VR environment becomes laggy or unresponsive, consider downsampling the data or segmenting the tomogram in smaller sections by adjusting the bounding box in the ROI tools in syGlass and moving it along the tomogram as segmentation is being performed. The performance slider in the visualization menu can also be adjusted to reduce lagging during the segmentation process. Additionally, to mitigate motion sickness, users can adjust VR settings to reduce motion effects or take regular breaks during segmentation sessions.
Our VR-based segmentation protocol offers significant benefits to current cryo-ET segmentation workflows. Conventional manual segmentation methods often involve 2D annotation on individual slices, which can be time-consuming and may not fully capture three-dimensional continuity13. In addition, VR-based segmentation introduces a much more immersive view of the cellular structures, aiding in visualization. Automated machine-learning segmentations are emerging as a powerful method to obtain segmentations from cellular tomograms14,16,17, though the high noise levels and complex structures present in cryo-ET data lead to gaps and false positives that require manual intervention. This protocol offers an alternative approach to manually segment cryo-electron tomograms, to generate initial segmentations that may potentially be used as training data for other neural network software, or to clean up initial segmentations generated from other automated approaches.
In conclusion, this study highlights VR-based segmentation as a promising tool for cryo-ET data analysis and education, offering enhanced efficiency and a more immersive user experience. With further development, VR technology has the potential to revolutionize the way we interpret and disseminate scientific discoveries of complex cellular structures in cryo-ET datasets, providing a valuable alternative to traditional segmentation and education methods.
Disclosures
The authors declare that they have no conflicts of interest.
Acknowledgements
This work was performed at the National Center for CryoEM Access and Training (NCCAT) and the Simons Electron Microscopy Center located at the New York Structural Biology Center, supported by NIH (Common Fund U24GM129539, U24GM139171, and NIGMS R24GM154192), the Simons Foundation (SF349247) and NY State Assembly.
Materials
| Name | Company | Catalog Number | Comments |
|---|---|---|---|
| CryoET Data | Format:TIFF-stack, TIFF | ||
| HTC VIVE Cosmos | HTC | 99HARL000-00 | https://www.vive.com/sea/product/vive-cosmos/features/ |
| Intel(R) Core(TM) i7-10870H CPU @ 2.20 GHz 2.21 GHz | Intel | https://ark.intel.com/content/www/us/en/ark/products/208018/intel-core-i7-10870h-processor-16m-cache-up-to-5-00-ghz.html | |
| NVIDIA GeForce RTX 3070 Laptop GPU | NVIDIA | https://www.nvidia.com/en-us/geforce/laptops/compare/30-series/ | |
| syGlass Software | syGlass | syGlass Software installed on a compatible Windows PC | |
| VIVE Cosmos Hand Controllers | HTC | 99HAFR001-00 | https://www.vive.com/us/accessory/cosmos-controller-right/ |
| Windows 11 Home | Microsoft | Microsoft Windows 11 Home |
References
- Plitzko, J. M., Schuler, B., Selenko, P. Structural biology outside the box-inside the cell. Curr Opin Struct Biol. 46, 110-121 (2017).
- Beck, M., Baumeister, W. Cryo-electron tomography: can it reveal the molecular sociology of cells in atomic detail. Trends Cell Biol. 26 (11), 825-837 (2016).
- Lam, V., Villa, E. Practical approaches for cryo-FIB milling and applications for cellular cryo-electron tomography. Methods Mol Biol. 2215, 49-82 (2021).
- Berger, C., et al. Cryo-electron tomography on focused ion beam lamellae transforms structural cell biology. Nat Methods. 20 (4), 499-511 (2023).
- Watson, A. J. I., Bartesaghi, A. Advances in cryo-ET data processing: meeting the demands of visual proteomics. Curr Opin Struct Biol. 87, 102861(2024).
- Pyle, E., Zanetti, G. Current data processing strategies for cryo-electron tomography and subtomogram averaging. Biochem J. 478 (10), 1827-1845 (2021).
- Wan, W., Briggs, J. A. G. Cryo-electron tomography and subtomogram averaging. Methods Enzymol. 579, 329-367 (2016).
- Ni, T., Liu, K., Zhang, J., Atanasov, I., Mladenov, M. G., Jiang, W. High-resolution in situ structure determination by cryo-electron tomography and subtomogram averaging using emClarity. Nat Protoc. 17 (2), 421-444 (2022).
- Obr, M., et al. Exploring high-resolution cryo-ET and subtomogram averaging capabilities of contemporary DEDs. J Struct Biol. 214 (2), 107852(2021).
- Tegunov, D., Xue, L., Dienemann, C., Cramer, P., Mahamid, J. Multi-particle cryo-EM refinement with M visualizes ribosome-antibiotic complex at 3.5 Å in cells. Nat Methods. 18 (2), 186-193 (2021).
- Salfer, M., Collado, J. F., Baumeister, W., Fernández-Busnadiego, R., Martínez-Sánchez, A. Reliable estimation of membrane curvature for cryo-electron tomography. PLoS Comput Biol. 16 (8), e1007962(2020).
- Barad, B. A., et al. Quantifying organellar ultrastructure in cryo-electron tomography using a surface morphometrics pipeline. J Cell Biol. 222 (2), e202204093(2023).
- Martinez-Sanchez, A., Garcia, I., Asano, S., Lucic, V., Fernandez, J. J. Robust membrane detection based on tensor voting for electron tomography. J Struct Biol. 186 (1), 49-61 (2014).
- Heebner, J. E., et al. Deep learning-based segmentation of cryo-electron tomograms. J Vis Exp. (189), e64435(2022).
- Garza-López, E., Robles-Flores, M. Protocols for generating surfaces and measuring 3D organelle morphology using Amira. Cells. 11 (1), 65(2021).
- Chen, M., et al. Convolutional neural networks for automated annotation of cellular cryo-electron tomograms. Nat Methods. 14 (10), 983-985 (2017).
- Lamm, L., et al. MemBrain v2: an end-to-end tool for the analysis of membranes in cryo-electron tomography. bioRxiv. , (2024).
- Pidhorskyi, S., Morehead, M., Jones, Q., Spirou, G., Doretto, G. syGlass: interactive exploration of multidimensional images using virtual reality head-mounted displays. arXiv. , (2018).
- Schindelin, J., et al. Fiji: an open-source platform for biological-image analysis. Nat Methods. 9 (7), 676-682 (2012).
- Tegunov, D., Cramer, P. Real-time cryo-electron microscopy data preprocessing with Warp. Nat Methods. 16 (11), 1146-1152 (2019).
- Bepler, T., Kelley, K., Noble, A. J., Berger, B. Topaz-Denoise: general deep denoising models for cryoEM and cryoET. Nat Commun. 11, 5208(2020).
- Buchholz, T. -O., Berninger, L., Maurer, M., Jug, F. Cryo-CARE: content-aware image restoration for cryo-transmission electron microscopy data. Proc IEEE Int Symp Biomed Imaging. 16, 502-506 (2019).
- Buchholz, T. -O., Jordan, M., Pigino, G., Jug, F. Content-aware image restoration for electron microscopy. Methods Cell Biol. 152, 277-289 (2019).
- Liu, Y. -T., et al. Isotropic reconstruction for electron tomography with deep learning. Nat Commun. 13, 6482(2022).
- Kremer, J. R., Mastronarde, D. N., McIntosh, J. R. Computer visualization of three-dimensional image data using IMOD. J Struct Biol. 116 (1), 71-76 (1996).
Reprints and Permissions
