Here, we present a systematic method describing the quasi-reversible self-assembly of the amyloid beta 1-40 (Aβ1-40)-coated 20 nm gold aggregates. The nano-size-dependent quasi-reversible networking between peptides was correlated with specific amino acids or sections of the Aβ1-40 monomer.
Method Article
Characterization of pH-Dependent Reversible Self-Assembly of Amyloid Beta 1-40-Coated Gold Colloids
In This Article
Summary
Abstract
The characterization of Aβ1-40 coated over the nano-gold colloidal particle surfaces was conducted using surface plasmon resonance (SPR) spectroscopy and transmission electron microscopy (TEM). The observed pH-dependent shift of the SPR band of Aβ1-40-coated 20 nm gold particles was correlated with alternation of aggregation and disaggregation observed in the TEM images. A pH of ~4 induced an unfolded conformation, and a pH of ~10 induced a folded conformation of Aβ1-40 on the gold surface. This reversible aggregation process was observed by Raman imaging as the pH was gradually changed from pH 4 to pH 10. We observed a pH-dependent morphology change in Aβ1-40 on the gold surface, where clear aggregates were observed at pH 4. However, we observed very subtle differences in the surface-enhanced Raman spectroscopy (SERS) spectrum between pH 4 and pH 10 conditions, with the most striking difference being spectral density in the region of 250 cm-1 and 1750 cm-1. Specifically, the mode analysis of the reversible aggregation indicated that the aggregates were formed by the unfolded conformation of Aβ1-40 which involved the benzene ring section of Tyrosine and Phenylalanine. Conversely, the disassembly of the aggregates was associated with conformational changes in protein folding of Aβ1-40 involving Histidine, Glutamine, Methionine, and Aspartic acid.
Introduction
The fibrillogenesis of amyloid beta 1-40 (Aβ1-40) or 1-42 (Aβ1-42) peptides has been extensively investigated as a critical component in the formation of amyloid plaques which are a cause of Alzheimer's disease1,2,3,4,5,6,7,8,9,10,11. The key mechanism in fibrillogenesis is an oligomerization of Aβ1-40 or Aβ1-42 peptides to form a neurotoxic protein aggregate, and extensive investigation has been conducted to understand the mechanisms of how monomers form the oligomers12,13,14. We have undertaken an approach of examining amyloidogenic peptides forming aggregates over a nano-gold surface and identifying factors that are responsible for the networking between peptides that are away from the gold surface15,16,17,18,19,20,21,22.
Aβ1-40 adopt an unfolded conformation (A) under acidic conditions (pH ~4) and a folded conformation (B) under basic conditions (pH ~10). We observed dispersed Aβ1-40-coated gold colloid particles at pH ~10 and large Aβ1-40-coated gold colloid aggregates at pH~4 (Figure 1)23,24. The unfolded conformation of Aβ1-40, at acidic conditions, favors peptide networking between the Aβ1-40 monomers over the gold-nano-particle surface, resulting in the formation of gold colloid aggregates (See A in Figure 1). When the Aβ1-40 monomer holds the folded conformation at a basic or neutral pH, Aβ1-40, the monomers do not network into aggregates, and the coated gold nanoparticles remain as individual dispersed particles (See B in Figure 1). We can, therefore, interrogate the process of how Aβ1-40 peptides undergo conformational changes to network and form aggregates by measuring the SPR band shift over a range of pH conditions25,26,27,28,29,30,31.
We tested several different sizes of gold nanoparticles and found that the 20 nm gold colloid exhibited the most prominent reversible self-assembly process of Aβ1-40 monomers in response to an external change in pH (Figure 2). This is a clear indication of a reversible change in peptide conformation, where acidic conditions (A) induce an unfolded conformation, enhancing the networking and leading to the aggregation of gold colloids. The basic condition (B) was found to induce a folded conformation of monomers26,27,28,29,30,31.
Protocol
1. Preparation of Aβ1-40 coated gold nanoparticles
- Add a 1 mL volume of distilled deionized water to 1 mg of lyophilized Aβ1-40 (MW: 4.2 kDa, 98% HPLC purity) using a syringe needle. Mix the solution with a vortex mixer for approximately 30 s and ensure that no solid particles are observed in the solution at room temperature (RT; ~20 °C).
- Prepare all stock solutions using deionized and distilled water (~18 MΩ·cm).
- Spectroscopically identify the concentration by using tyrosine absorption at 275 nm32, which has a molecular extinction coefficient ε275 of 1390 cm-1·M-1.
- Store stock solutions of Aβ1-40 at -80 °C. (See Table of Materials for the commercial products of Aβ1-40.)
- Thaw the peptide stock solution approximately 5 min before data collection. Mix an 8 μL volume of the peptide solution with 800 μL of gold colloidal particles in a 15 mL centrifuge tube. Add a volume of 4.2 mL of deionized distilled water and then vortex the sample for 10 s30,31,33,34.
- Fix the concentration of Aβ1-40 peptides to be 1.8 nmol and range the ratio of Aβ1-40 peptides. The number of gold colloids ranged between ~500:1 to ~2000:125.
2. Iterative pH change and monitoring corresponding SPR band shift
- Set the solution temperature at a determined value (e.g., 25 °C) using the temperature control unit of the ultraviolet-visible-near infrared (UV-Vis-NIR) spectrophotometer.
- Monitor the initial pH of the sample solution using a pH meter and set it to slightly below pH 7. Collect the absorption spectrum in the range between 400 nm and 1000 nm.
- Change the pH of the sample to ~pH 4 (i.e., pH 4.0 ± 0.3) by adding 10 μL volumes of 0.1 M HCl and collect the absorption spectrum between 400 nm and 1000 nm.
- Change the pH of the sample to ~pH 10 (i.e., pH 10 ± 0.3) by adding 10 μL volumes of 0.1 M NaOH and collect the absorption spectrum between 400 nm and 1000 nm.
- Change the pH between pH 4 and pH 10 with HCl and NaOH 10 times and collect the absorption spectrum continuously at 25 ± 0.2 °C29,30.
NOTE: For all sample solutions, the optical density of the SPR band's peak was maintained around 0.2. A buffer effect due to the residual buffer solution in a solution is expected. Thus, the final pH value was determined after the equilibrium was confirmed. The pH value was directly measured in a sample cuvette cell using a micro pH electrode, which has an accuracy of ±0.005 pH. - Obtain the American standard code for information interchange (ASCII) data set of wavelengths as a function of absorbance. Extract the average position of band peaks using the Peak Fit program.
- Plot the data set to view the optical density as a function of wavelength (nm) using the Plot function.
- Mark initial peak wavelengths λ1, λ2, and λ3 by selecting their approximate positions in the plotted data and fit the data using the RUN function.
- Obtain the graph containing the central peak of each (λi), XCi, with the area of each band (Ai).
- Export the extracted peak positions and areas to a spreadsheet program and calculate the average peak position at a given pH.
- Determine the weighting factor ai of each peak center λi by comparing the area of the band (Ai) to the total area of the entire bands as:
 .
. - Extract the average peak position,
 (pH) using Eqn. (1).
 (1)
(1)
- Determine the weighting factor ai of each peak center λi by comparing the area of the band (Ai) to the total area of the entire bands as:
- Generate a reversibility plot using the following process:
- Tabulate average peak positions, , as a function of each "operation" number, n as vs. n. Make the operation number, n, to be 1 for the sample before the addition of acid at ~pH 7. Increase the operation number by 1 each time, changing the pH to be ~pH4 with HCl or pH to be ~pH 10 with NaOH. Make n to be even at an acidic condition (i.e., ~pH 4) and odd to be a basic condition (i.e., pH 10).
- Analyze the peak position at each n, (n) = λ(n), by using the formula30
 (2)
(2)
NOTE: Represent an initial average peak position at n = 1 by A. Express the parameters B and C as the n-dependent peak position shift. Make the parameter D as an amplitude of the damping factor, E, of repetition. Use the sine function to show the undulation of the peak position as a function of n. - Transport the data set of (x, y) to Origin software and plot.
- Form the Customized function given in Eqn. (2) under Nonlinear Curve Fitting Function Of Analysis. Type the initial A, B, C, D, and E values, and click RUN to complete the fit.
- Tabulate average peak positions,
- TEM imaging
- Make the TEM samples of the Aβ1-40-coated 20 nm gold colloids with Formvar-coated copper grids. Examine the samples with a TEM operated at 80 kV.
- Collect images at a nominal magnification of 28,000x or 71,000x on a model XR-40 4-megapixel CCD digital camera (AMT). Collect the TEM images for Aβ1-40-coated 20 nm gold at each operation number n = 1 (~pH 7), n = 2, 4, 6, 8, and 10 (pH 4), and n = 3, 5, 7, and 9 (pH 10).
3. Raman imaging and investigation of the reversible aggregation
- Place 100 μL of solution on a mica disc (diameter of 1 cm) for each sample at operation number n. Dry samples overnight before measurement.
- Collect white light images at each operation number n. Prepare the separate sample on a mica disc as the pH was continuously altered between ~pH 4 and ~pH 10 for each operation number n (Figure 3).
- Collect the Raman image at each operation number n with a laser of a wavelength of λ = 633 nm at 0.5 ± 0.05 mW power with a spatial resolution of ~0.43 μm in a grid consisting of 100 × 100 pixels with an integration time of 500 ms/spectrum for the region between ~200 cm-1 and ~2,800 cm-1 (Figure 4).
- Plot the representative spectrum for each n aligned as a function of n and construct the three-dimensional SERS spectrum as a function of n for Aβ1-40 coated 20 nm gold (Figure 5A). Utilize the top view of the three-dimensional SERS spectrum as a contour map (Figure 5B) in order to extract the specific modes associated with a particular pH condition (i.e., ~pH 4 and ~pH 10). Extract any spectral features enhanced for either at only neven or at only nodd.
Results
With the attachment of Aβ1-40 onto the gold nano-colloidal particles surface, the SPR band around the 530 nm absorption maximum significantly red-shifted to ~650 nm peak position when the solution was made more acidic (pH 4)35. Together with TEM images, we identified that spectroscopic features observed at pH 4 correspond to the formation of the gold colloid aggregates with plausibly unfolded conformation and networking with the surrounding unfolded Aβ1-40 monomers adsorbed over the gold surface30. We observed that the Aβ1-40 monomers reverse back to the folded conformation under basic (pH 10) conditions, resulting in a deformation of the aggregates in a quasi-reversible manner. This quasi-reversible process was evident from the alternation of the average band peak ((n)), which shifted between a shorter and longer wavelength, and the dispersed vs. aggregate morphology in TEM images between basic (pH = 10) and acidic (pH = 4) conditions. It has been previously observed that a portion of the Aβ1-40 monomer remains unfolded even after the solution was reverted to basic conditions36. Video 1 shows the pH dependent color change of Aβ1-40 and 20 nm bare gold colloid.
As a comparison, the pH hop investigation of 20 nm bare gold colloid was conducted (Figure 5C and D). As the pH change operation proceeded, it showed the growth of the clusterization of the gold colloids in SPR band shoft, TEM images as well as white-light images. Quite interestingly, there were several SERS spectral lines depending on either nodd and neven. For example, at neven (pH ~4), the line at 275 cm-1, which was assigned as the mode associated with Aun (n = 5, 6, 12, 16, 20, 58)37 or mode of Au-Cl- ligand38 was intensively observed. On the other hand, for neven, at 1008 cm-1 C-N str was observed39 and CH2 wag39, CH2 deformation40 were extensively observed at 1291 cm-1.
In contrast to the clear pH-dependent and reversible aggregation morphology observed by white light imaging, there were relatively subtle differences in the spectral features in the SERS spectrum between nodd and neven. As a first approximation, the spectral line density in the region between 250 cm-1 and 1750 cm-1 was higher for nodd than neven. The spectral lines in the fingerprint region, 1250 cm-1 and 1750 cm-1 (Amide I, II, and III bands) for nodd showed less resolved spectral features, implying either a broadening or increase in spectral densities. In Figure 6, a contour map given in Figure 5B (Figure 6B) was organized with the SERS signals at 761 cm-1 (red) and 1395 cm-1 (blue), representing the emphases at nodd and neven, respectively (Figure 6C). As a representative SERS spectrum for nodd and neven, the SERS spectrum at n = 7 (red) and n = 4 (blue) are shown on the top (Figure 6A). In order to show the correspondence to the SPR band shift for Aβ1-40 coated 20 nm gold, the band shift plot in Figure 3 is shown on the side (Figure 6D).
While we have preliminary data on the full assignment of the observed SERS spectrum, we note several notable Raman shift features here. The spectral lines and (plausible assignments) enhanced in nodd are mainly in the region lower than 1000 cm-1: 394 cm-1 (Trp)41,42,43, 761 cm-1 (His, Ala)39,44,45,46,47, 875 cm-1 (indole NH displacement, C-C stretching of Met)39, 974 cm-1 (Glu, C-COO- stretching of Asp, mode associated with citrate)39,48,49. The Raman shift enhanced at neven showed significant spectroscopic features in the fingerprint region (Amide I, II, and III): 1166 cm-1 (N-H+ deformation of Tyr)39,41, 1227 cm-1 (Ala-Pro-Gly, Amide III)39,50,51, 1395 cm-1 (COO- symmetric stretching or CH2- CH3- scissoring of Glu)39,48, 1585 cm-1 (ring CC stretching of Phe, asymmetric stretching of carboxylate -Au, COO- stretching of citrate, deformation of benzene ring)39,41,45,46,47,49,52, 1592 cm-1 (Phe, Tyr, C=C stretching of Tyr, CC stretching of ring in Phe, benzene ring stretching and COO- stretching in Phe and Tyr, and asymmetric stretching of OH)39,41,48,50,51, and 1628 cm-1 (Amide I sub peak distinctive for intermolecular β-sheet structures53, C=O and the coupled CN/NH vibrational modes of the protein backbone originating from parallel β-sheet type structures, accumulation of aggregated Aβ54, random coils, β-turns, β-hairpins48. The sequences appearing for nodd or neven are shown in Figure 7. Overall, for neven corresponding to the reversible aggregation or unfolded conformation of Aβ1-40, Phe/Tyr containing benzene ring, symmetric stretching of COO-, CH2- CH3- scissoring mode of Glu, and -NH+ deformation of Tyr were significantly involved in the conformational change of the peptide. During disassembly of the aggregation that was observed when peptides adopted the folded conformation corresponding to the modes prominent at nodd, Glu, Asp, Met, His and Ala appeared to be involved.
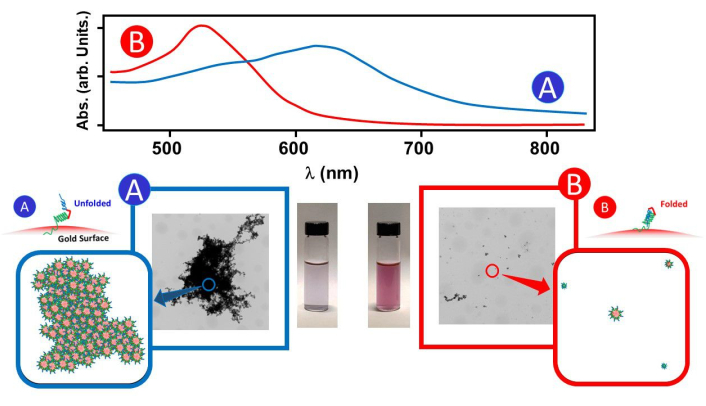
Figure 1: The pH-dependent absorbance and morphology. The absorption spectrum at pH 4 (A) and pH 10 (B) for Aβ1-40 coated gold nanoparticles (20 nm), and the corresponding TEM images, sketches of aggregation/dispersed particles, and pictures of solutions in vials are shown. A is the unfolded conformation of Aβ1-40 monomers under acidic conditions, and B is the folded conformation under basic conditions. Diagrams of Aβ1-40 monomers in each conformation and aggregation/disperse morphologies are shown next to the TEM images. Please click here to view a larger version of this figure.
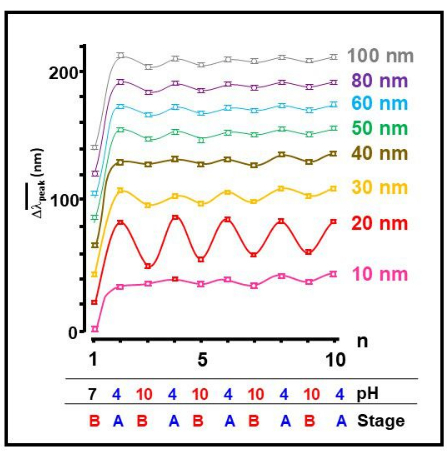
Figure 2: Nano-size dependent self-assembly reversibility. The shift of the average peak position of the SPR band, , as a function of operation number, n, for all tested sizes of gold colloid particles. The approximate pH values and the corresponding stage of the aggregates shown in Figure 1 are given as well. Please click here to view a larger version of this figure.
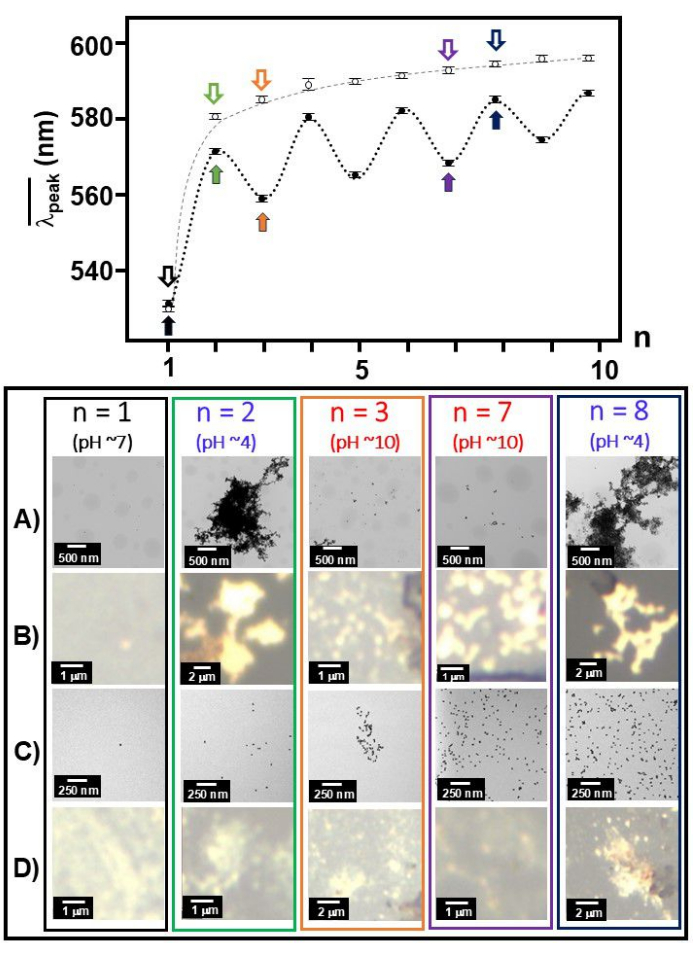
Figure 3:  and TEM/white-light images at each operation number. The as a function of operation number, n, was plotted together for Aβ1-40 coated 20 nm gold (closed circles) and 20 nm gold colloid (open circles) and is shown with representative TEM (A and C)/white light images (B and D) at selected operation numbers (n = 1, 2, 3, 7, and 8 marked by de-coded arrows) for Aβ1-40 coated 20 nm gold (A and B) and 20 nm gold colloid (C and D). Black font indicates pH 7, blue font indicates pH 4, and red font indicates pH 10. Please click here to view a larger version of this figure.
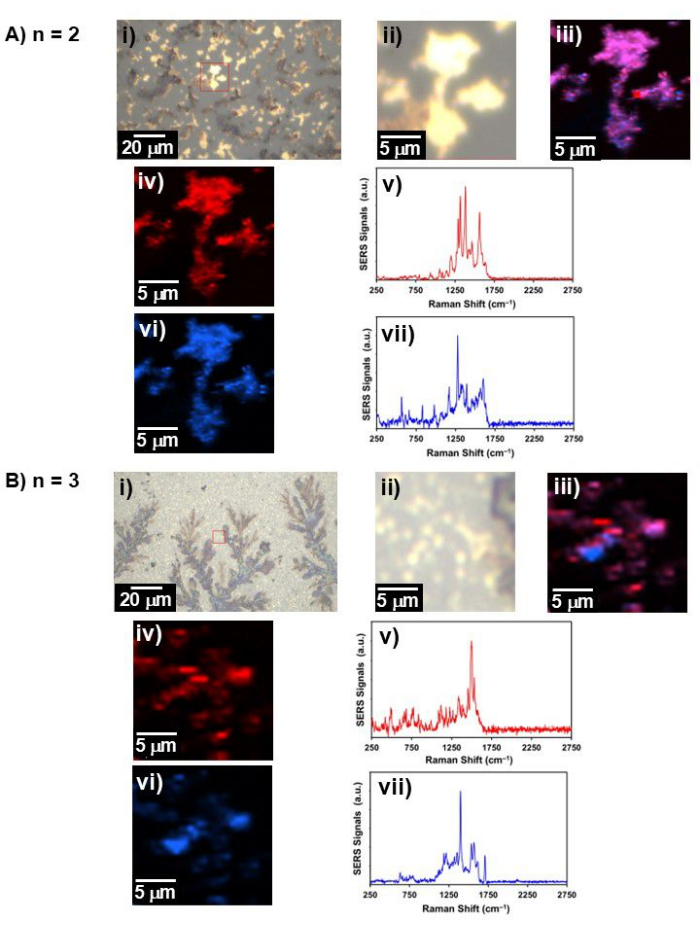
Figure 4: Representative white light and Raman image. The white light image, Raman image, and SERS spectrum for (A) n = 2 and (B) n = 3; i) white light image in a wide field of view, ii) white light image in the area where Raman image was collected (labeled by a red square in i)), iii) the Raman image of two components combined, iv) Raman image of component 1 and its v) SERS spectrum of iv), vi) Raman image of component 2, and vii) SERS spectrum of vi). Please click here to view a larger version of this figure.
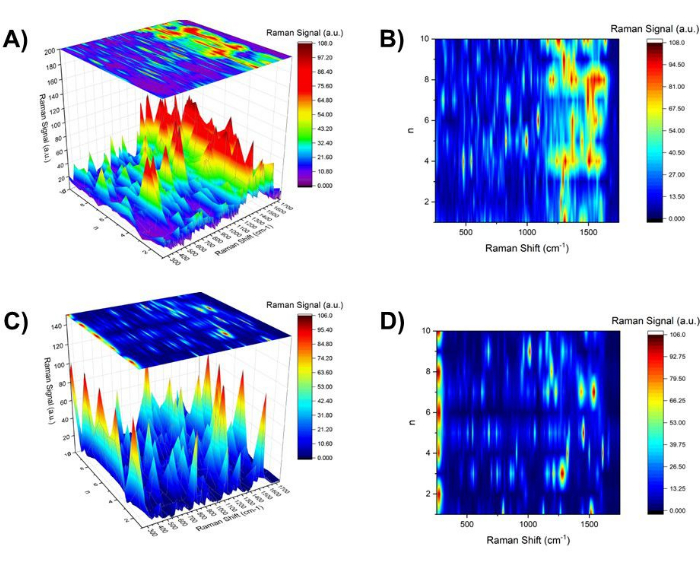
Figure 5: Contour map of SERS Spectrum for nodd, neven, and nall. (A) The three-dimensional map of the SERS spectrum in the region of 250 cm-1 and 1750 cm-1 as a function of n for Aβ1-40 coated 20 nm gold with a contour map shown in (B) on the top. (C) The three-dimensional map of the SERS spectrum in the region of 250 cm-1 and 1750 cm-1 as a function of n for 20 nm gold with a contour map shown in (D) on the top. Please click here to view a larger version of this figure.
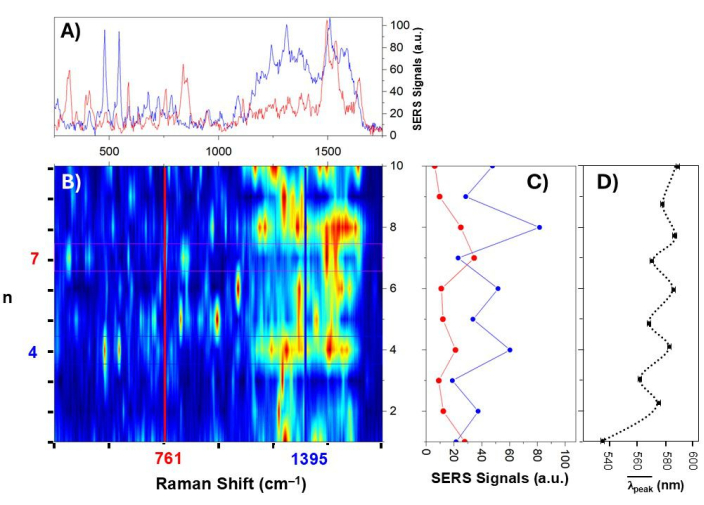
Figure 6: Contour map of SERS Spectrum. The contour map of the SERS spectrum as a function of n (1-10). (A) Absorbance at 1395 cm-1 (blue) and 761 cm-1 (red). (B-D) The bottom panel shows the SERS spectrum and the right panel shows the amplitude of signal intensity change of SERS signals at each n. Please click here to view a larger version of this figure.
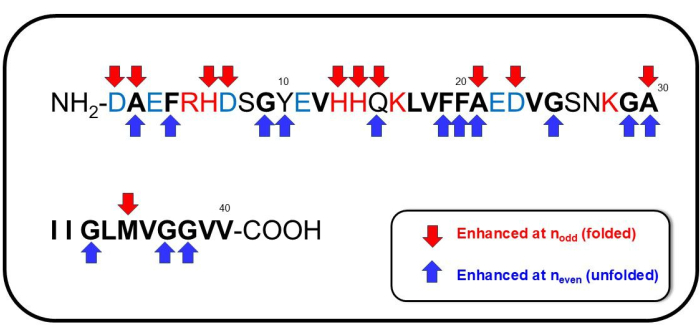
Figure 7: Notable Sequences of Aβ1-40. The sequences assigned to have significant involvement at nodd (corresponding to the formation of folded conformation) are indicated by downward red arrows, and those assigned to have significant involvement at neven (corresponding to the formation of unfolded conformation) are indicated by blue arrows. Please click here to view a larger version of this figure.
Video 1: pH dependent color change of Aβ1-40 and 20 nm bare gold colloid. Please click here to download this Video.
Discussion
A critical consideration in studies of peptide conformation is sample maintenance, as samples will deteriorate if stored improperly. The peptide samples were received in a lyophilized form and started to denature once they were rehydrated with distilled deionized water, even when they were stored at -80 °C. The purity of the gold colloids were verified by quality control analysis. In order to maintain the stability of the colloids, they were stored at 4 °C and not frozen. The gold colloid solutions were prepared fresh for each experiment because the salts buffer solution would destabilize the gold colloid. HCl and NaOH solutions were prepared fresh for each experiment.
The technical challenges of manually reading and recording the pH of the solution with delicate instruments while changing the pH between 4 and 10 limit the precision of our reported results. Thus, we did not observe consistent results in the intensity of the SERS signals. This likely introduced error into the amplitude that was used for the contour plot. Future work to verify the modes associated with neven or nodd could introduce mutations to substitute the amino acids in the Aβ1-40 sequence that we report to be involved in the conformational change of the protein, such as the single Tyrosine or Asparagine residues.
“The interaction between Aβ1-40 monomer and the gold surface is considered to be dipole interaction, and the level of hydrogen bonding was hypothesized in work by H. Schmidbauer et al.55. In a separate work, we have investigated SERS spectroscopy as a function of the amount of Aβ1-40 under the acidic condition, it extracted the nano-size dependent adsorption formation56. For 20 nm gold, C=C or -C-N bond of histidine (His) was speculated to initiate the adsorption; for 80 nm gold, however, a benzene ring breathing mode of Phenylalanine (Phe) or Tyrosine (Tyr) reached the gold surface for initiating the adsorption. The adsorption process of Aβ1-40 over the gold surface at neutral or basic conditions (pH ~10) was considered to maintain the Aβ1-40 coated gold colloid to be hydrophilic since no precipitates were formed in the aqueous condition. However, the precipitates were observed at pH 4, implying that the aggregates were hydrophobic.
The TEM images and white light images only indirectly show evidence of the aggregation. We have attempted to conduct circular dichroism (CD) spectroscopy to correlate the morphology observed in the reversible aggregation with the secondary structures. However, the scattering base lines prevented us from obtaining reproducible CD signals. Instead, therefore, we utilized Raman spectroscopy, focusing more on the modes enhanced either when aggregation (unfolded conformation of Aβ1-40) took place under pH ~4 or when disaggregation (unfolded conformation of Aβ1-40) under pH ~10. Thus, the best speculation for identifying the secondary structure in this work was limited to monitoring the nodes associated with the secondary structures. This was demonstrated in the observation of the β-sheet at 1628 cm-1, particularly under pH 4 condition.
This study only observed the change in peptide conformation for the 20 nm diameter gold colloids and only investigated n up to 10. The conformation and aggregation properties of the Aβ1-40 peptide could be altered by the size of the particle that they adsorb to56. Therefore, more work is needed to understand the properties of the peptides that are based on networking between monomers and those that are affected by the physical characteristics of the adsorption surface. Under the conditions that we tested, only the 20 nm diameter gold colloids exhibited reversibility of the aggregation morphology, and the mechanisms of how the colloid diameter affects the reversibility of this property are not known. Increasing n up to 20 could provide more insights into the mode-dependent degree of the reversibility of the aggregation morphology. These investigations into how the size of the gold colloid affects amyloid beta peptide aggregation will yield important insights into the molecular mechanisms of Alzheimer’s Disease pathology.
Disclosures
The authors declare that they have no conflicts of interest with this work to disclose.
Acknowledgements
K.Y. is supported by NSF-MRI Grant #2117780. The Geneseo Foundation supported the initial stage of this project. A. I. is grateful to the SUNY Geneseo Chemistry Department Alumni Summer Research Scholarship ('19 Rhodes Award and '20 Lipkowitz Award) and the Dreyfus Foundation Undergraduate Summer Research Scholarship for their support.
Materials
| Name | Company | Catalog Number | Comments |
|---|---|---|---|
| Amyloid beta peptide 1-40 (Aβ1–40 peptide) | r-Peptide (Bogart, GA, USA) | A-1156-2 | |
| CCD digital camera | AMT | XR-40 4-megapixel CCD | |
| Distilled deionized water from Milli-Q- water system | Millipore Sigma (Burlington, MA, USA) | Milli-Q IQ 7000 | |
| Freezer -86 oC | Thermo Scientific | Revco Chilly Willy RLE Series Unit ID 187004 Build Number 40.04 | |
| Gold Colloid (10 nm) | Ted Pella, Inc. (Redding, California, USA) | 15703-20 | |
| Gold Colloid (100 nm) | Ted Pella, Inc. (Redding, California, USA) | 15711-22 | |
| Gold Colloid (15 nm) | Ted Pella, Inc. (Redding, California, USA) | 15704-20 | |
| Gold Colloid (20 nm) | Ted Pella, Inc. (Redding, California, USA) | 15705-20 | |
| Gold Colloid (30 nm) | Ted Pella, Inc. (Redding, California, USA) | 15706-21 | |
| Gold Colloid (40 nm) | Ted Pella, Inc. (Redding, California, USA) | 15707-21 | |
| Gold Colloid (50 nm) | Ted Pella, Inc. (Redding, California, USA) | 15708-21 | |
| Gold Colloid (60 nm) | Ted Pella, Inc. (Redding, California, USA) | 15709-22 | |
| Gold Colloid (80 nm) | Ted Pella, Inc. (Redding, California, USA) | 15710-22 | |
| Highest Grade V1AFM Mica Discs 10 mm | Ted Pella Inc. | #50 | |
| Hydrochloric Acid Standard Solution, 1.0 N | Fluka | Lot# SHBB4705V 318949-2L | |
| Macro quartz quvette Light Path 10 mm | Fire Fly Science | Type1-MC-Path10mm | |
| Micro pH electrode | HORIBA | Model 9618S (MFG No. 9Y8E0050) | |
| Peak Fit Program | Origin (Northampton, MA, USA) | OriginPro2018b (64-bit) b9.5.5.409 (Academic) | |
| pH 4.00 Buffer solution | VWR | Cat No. 34170-127 | |
| pH 7.00 Buffer Solution | Fisher Chemical | SB107-4 Lot 191041 | |
| pH meter | HORIBA | Model F-72G (MFG No. B27M0017) | |
| Pipet Tips Maxi Tips 1–5 mL | Fisher | 02-707-467 | |
| Pipet Tips 10 mL | Fisher | 02-717-135 | |
| Pipet Tips 1000 mL | Fisher | 02-717-156 | |
| Pipet Tips 1–200 mL | Fisher | 02-717-143 | |
| Pipetter Fisher Brand Elite 0.5–5 mL | Fisher | QU05317 | |
| Pipetter Fisher Brand Elite 100–1000 mL | Fisher | QU01672 | |
| Pipetter Fisher Brand Elite 10–100 mL | Fisher | MU10985 | |
| Pipetter Fisher Brand Elite 1–10 mL | Fisher | MU08178 | |
| Sodium Hydroxide Solution 1.0 M | Fluka | Lot#05096BPV 319511-2L | |
| TEM | FEI Co | Morgagni model 268 | |
| TempAssure PCR Tubes, Flat Caps, Natural | USA Scientific | polypropylene. 0.2 mL individual thin-wall tubes with attached frosted flat caps | |
| UV-Vis-NIR Spectrophotometer | Varian | CARY 5000 UV1106M074 | |
| WI Tec alpha300R Confocal Raman Microscope | WITec-Oxford Instrument | XMB3000-3001 |
References
- Kirschner, D. A., et al. Synthetic peptide homologous to beta protein from Alzheimer disease forms amyloid-like fibrils in vitro. Proc Natl Acad Sci U S A. 84 (19), 6953-6957 (1987).
- Lomakin, A., Chung, D. S., Benedek, G. B., Kirshner, D. A., Teplow, D. B. On the nucleation and growth of amyloid -protein fibrils: detection of nuclei and quantitation of rate constants. Proc Natl Acad Sci U S A. 93 (3), 1125-1129 (1996).
- Walsh, D. M., Lomakin, A., Benedek, G. B., Condron, M. M., Teplow, D. B. Amyloid -protein fibrillogenesis. J Biolog Chem. 272 (3), 22364-22372 (1997).
- Lambert, M. P., et al. nonfibrillar ligands derived from Ab1-42 are potent central nervous system neurotoxins. Proc Natl Acad Sci U S A. 95 (11), 6448-6453 (1998).
- Bucciantini, M., et al. Inherent toxicity of aggregates implies a common mechanism for protein misfolding diseases. Nature. 416 (6880), 507-511 (2002).
- Walsh, D. M., et al. Naturally secreted oligomers of amyloid beta protein potently inhibit hippocampal long-term potentiation in vivo. Nature. 416 (6880), 535-539 (2002).
- Rocha, S., et al. Adsorption of amyloid beta-peptide at polymer surfaces: A neutron reflectivity study. ChemPhysChem. 6 (12), 2527-2534 (2005).
- Attanasio, F., et al. Carnosine inhibits Ab1-42 aggregation by perturbing the H-bond network in and around the central hydrophobic cluster. ChemBioChem. 14 (5), 583-592 (2013).
- Politi, J., Spadavecchia, J., Iodice, M., de Stefano, L. Oligopeptide-heavy metal interaction monitoring by hybrid gold nanoparticle based assay. Analyst. 140 (1), 149-155 (2015).
- Moshe, A., Landau, M., Eisenberg, D. Preparation of Crystalline samples of amyloid fibrils and oligomers. Methods Mol Biol. 1345, 201-210 (2016).
- Scarff, C. A., Ashcroft, A. E., Radford, S. E. Characterization of amyloid oligomers by electrospray ionization-ion mobility spectrometry-mass spectrometry (ESI-IMS-MS). Methods Mol Biol. 1345, 115-132 (2016).
- Sabaté, R., Gallardo, M., Estelrich, J. Temperature dependence of the nucleation constant rate in β amyloid fibrillogenesis. Int J Biol Macromol. 35 (1-2), 9-13 (2005).
- Niraula, T. N., et al. Pressure-dissociable reversible assembly of intrinsically denatured lysozyme is a precursor for amyloid fibrils. Proc Natl Acad Sci U S A. 101 (12), 4089-4093 (2004).
- Miller, A. E., et al. Behavior of β-Amyloid 1-16 at the air-water interface at varying pH by nonlinear spectroscopy and molecular dynamics simulations. J Phys Chem A. 115 (23), 5873-5880 (2011).
- Majzika, A., et al. Functionalization of gold nanoparticles with amino acid, -amyloid peptides and fragment. Colloids Surf B Biointerfaces. 81 (1), 235-241 (2010).
- Liu, L., et al. Electrochemical detectionof β-amyloid peptides on electrode covered with N-terminus-specific antibody based on electrocatalytic O2 reduction by Aβ(1-16)-heme-modified gold nanoparticles. Biosens Bioelectron. 49, 231-235 (2013).
- Elbassal, E. A., et al. Gold Nanoparticles as a Probe for Amyloid-β Oligomer and Amyloid Formation. J Phys Chem C Nanomater Interfaces. 121 (36), 20007-20015 (2017).
- Olmedo, I., et al. How changes in the sequence of the peptide CLPFFD-NH2 can modify the conjugation and stability of gold nanoparticles and their affinity for beta-amyloid fibrils. Bioconjug Chem. 19 (16), 1154-1163 (2008).
- Xu, Y., et al. Attenuation of the aggregation and neurotoxicity of amyloid peptides with neurotransmitter-functionalized ultra-small-sized gold nanoparticles. Eng Sci. 6, 53-63 (2019).
- John, T., Gladytz, A. K., Martin Clemens, L. L., Risselada, H. J., Abel, B. Impact of nanoparticles on amyloid peptide and protein aggregation: A review with a focus on gold nanoparticles. Nanoscale. 45, 20894-20913 (2018).
- Li, J., et al. Reduced aggregation and cytotoxicity of amyloid peptides by graphene oxide/gold nanocomposites prepared by pulsed laser ablation in water. Small. 10 (21), 4386-4394 (2014).
- Araya, E., et al. Gold nanoparticles and microwave irradiation Inhibit beta-amyloid amyloidogenesis. Nanoscale Res Lett. 3, 435(2008).
- Barrow, C. J., Yasuda, A., Kenny, P. T., Zagorski, M. G. Solution conformations and aggregational properties of synthetic amyloid beta-peptides of Alzheimer's disease. Analysis of circular dichroism spectra. J Mol Biol. 225 (4), 1075-1093 (1992).
- Wood, S. J., MacKenzie, L., Maleeff, B., Hurle, M. R., Wetzel, R. Selective inhibition of Ab fibril formation. J Biolog Chem. 271 (8), 4086-4092 (1996).
- Yokoyama, K. Nanoscale Surface Size Dependence in Protein Conjugation. Advances in Nanotechnology. , Nova Science Publishers. New York, NY. (2010).
- Yokoyama, K. Nanoscale Protein Conjugation. Advances in Nanotechnology. , Nova Science Publishers. New York, NY. (2010).
- Yokoyama, K. Modeling of Reversible Protein Conjugation on Nanoscale Surface in Computational Nanotechnology: Modeling and Applications with MATLAB. , CRC Press. Boca Raton. (2011).
- Yokoyama, K. Nano Size Dependent Properties of Colloidal Surfaces. Colloids: Classification, Properties and Applications. , Nova Science Publishers. New York, NY. (2012).
- Yokoyama, K. Controlling Reversible Self-Assembly Path of Amyloid Beta Peptide over Gold Colloidal Nanoparticle's Surface. Nanoscale Spectroscopy with Applications. , CRC Press, Taylor and Francis Group, LLC. (2013).
- Yokoyama, K., et al. Nanoscale size dependence in the conjugation of amyloid beta and ovalbumin proteins on the surface of gold colloidal particles. Nanotechnology. 19, 375101(2008).
- Yokoyama, K., Welchons, D. R. The conjugation of amyloid beta protein on the gold colloidal nanoparticles' surfaces. Nanotechnology. 18, 105101(2007).
- Edelhoch, H. Spectroscopic determination of tryptophan and tyrosine in proteins. Biochemistry. 6 (7), 1948-1954 (1967).
- Yokoyama, K., et al. Examination of adsorption orientation of amyloidogenic peptides over nano-gold colloidal particles surfaces. Int J Mol Sci. 20 (21), 5354-5380 (2019).
- Yokoyama, K., Ichiki, A. Oligomerization and Adsorption Orientation of Amyloidogenic Peptides over Nano-Gold Colloidal Particle Surfaces. Advances in Chemistry Research. , NOVA Science Publishers. New York, NY. (2020).
- Fan, X., Zheng, W., Singh, D. J. Light scattering and surface plasmons on small spherical particles. Light Sci Appl. 3, e179(2014).
- Yokoyama, K., et al. Microscopic investigation of reversible nanoscale surface size dependent protein conjugation. Int J Mol Sci. 10 (5), 2348-2366 (2009).
- Vishwanathan, K. Symmetry of gold neutral clusters Au3-20 and normal modes of vibrations by using the numerical finite difference method with density-functional tight-binding (DFTB) approach. Arch Chem Res. 2 (1), 4(2017).
- Gao, P., Weaver, M. J. Metal-adsorbate vibrational frequencies as a probe of surface bonding: halides and pseudohalides at gold electrodes. J Phys Chem. 90, 4057-4063 (1986).
- Stewart, S., Fredericks, P. M. Surface-enhanced raman spectroscopy of peptides and proteins adsorbed on an electrochemically prepared silver surface. Spectrochim Acta AMol Biomol Spectrosc. 55 (7-8), 1615-1640 (1999).
- Palings, I., et al. Assignment of fingerprint vibrations in the resonance Raman spectra of rhodopsin, isorhodopsin, and bathorhodopsin: Implications for chromophore structure and environment. Biochem. 26 (9), 2544-2556 (1987).
- Szekeres, G. P., Kneipp, J. SERS probing of proteins in gold nanoparticle agglomerates. Front Chem. 7, 30(2019).
- Lin, V. J. C., Koenig, J. L. Raman studies of bovine serum albumin. Biopolymers. 15 (1), 203-218 (1976).
- Hornemann, A., Drescher, D., Flemig, S., Kneipp, J. Intracellular SERS hybrid probes using BSA-reporter conjugates. Anal Bioanal Chem. 405 (19), 6209-6222 (2013).
- Dong, J., et al. Metal binding and oxidation of amyloid-beta within isolated senile plaque cores: Raman microscopic evidence. Biochemistry. 42 (10), 2768-2773 (2003).
- Carey, P. R. Biochemical Applications of Raman and Resonance Raman Spectroscopies. , Academic Press. New York, NY. (1982).
- Harada, I., Takeuchi, H. Raman and Ultraviolet Resonance Raman Spectra of Proteins and Related Compounds. Spectroscopy of Biological Systems : Advances in Infrared and Raman Spectroscopy. , Wiley. Chichester, UK. (1986).
- Overman, S. A., Thomas, G. J. Jr Raman markers of nonaromatic side chains in an α-helix assembly: Ala, Asp, GGly, Ile, Leu, Lys, Ser, and Val residues of phage fd subunits. Biochemistry. 38 (13), 4018-4027 (1999).
- Talaga, D., et al. Total internal reflection tip-enhanced Raman spectroscopy of tau fibrils. J Phys Chem B. 126 (27), 5024-5032 (2022).
- Grys, D. -B., et al. Citrate coordination and bridging of gold nanoparticles: The role of gold adatoms in AuNP aging. ACS Nano. 14 (7), 8689-8696 (2020).
- Guo, T., et al. Full-scale label-free surface-enhanced Raman scattering analysis of mouse brain using a black phosphorus-based two-dimensional nanoprobe. Appl Sci. 9 (3), 398-408 (2019).
- Walther, M., Plochocka, P., Fischer, B., Helm, H., Uhd Jepsen, P. Collective vibrational modes in biological molecules investigated by Terahertz time-domain spectroscopy. Biopolymers. 67 (4-5), 310-313 (2002).
- Lochocki, B., et al. label-free fluorescence and Raman imaging of amyloid deposits in snap-frozen Alzheimer's disease human brain tissue. Commun Biol. 4 (1), 474-486 (2021).
- Palombo, F., et al. Detection of Aβ plaque-associated astrogliosis in Alzheimer's disease brain by spectroscopic imaging and immunohistochemistry. Analyst. 143 (4), 850-857 (2018).
- Khoury, Y. E., et al. Raman imaging reveals accumulation of hemoproteins in plaques from Alzheimer's diseased tissues. ACS Chem Neurosci. 12 (15), 2940-2945 (2021).
- Schmidbaur, H., Raubenheimer, H. G., Dobrzańska, L. The gold-hydrogen bond, Au-H, and the hydrogen bond to gold Au∙∙∙H-X. Chem Soc Rev. 43 (1), 345-380 (2014).
- Yokoyama, K., et al. Protein corona formation and aggregation process of amyloid beta 1-40 coated gold nano-colloids. Langmuir. 40 (3), 1728-1746 (2024).
Reprints and Permissions
