The TCID50 assay reported here leverages label-free real-time impedance measurements and the system's Virology module to objectively monitor virus-induced cytopathic effects (CPE) in real time. This streamlined assay significantly reduces hands-on time while supporting high-throughput, quantitative kinetic CPE measurements and enabling automated, real-time TCID50 calculations.
Method Article
A Streamlined, Label-Free Real-Time 50% Tissue Culture Infectious Dose (TCID50) Assay using Impedance for Automated Viral Titer Quantification
In This Article
Summary
Abstract
Measuring the viral titer, the concentration of a virus in a sample, is a fundamental procedure in virology research. While essential, traditional methods like the plaque assay and TCID50 assay can be time-consuming, require staining or labeling reagents, and often involve subjective interpretation, particularly when cytopathic effects (CPE) are subtle or difficult to quantify through imaging. For example, TCID50 assays may employ viability dyes like MTT or MTS, while plaque assays rely on imaging and staining to visualize viral plaques, both of which can introduce variability. Moreover, these traditional methods only offer a static snapshot of viral infectivity, limiting the ability to capture the dynamic interactions between viruses and permissive cells. To overcome the current limitations in measuring virus titer, a streamlined TCID50 assay was developed using impedance-based technology to objectively, noninvasively, and in real-time measure CPE, eliminating the need for labels. In this study, two virus-permissive cell models were used to validate the impedance-TCID50 assay: the GFP-labeled adenovirus (Adv-GFP) in HEK293A cells and influenza A virus (IAV) in MDCK cells. The workflow is simple, encompassing cell seeding, virus inoculation, real-time monitoring, and automatic analysis of TCID50 by the software. Throughout infection, TCID50 values were automatically calculated by the system's software using the Reed-Muench formula at all recorded time points. TCID50 values of IAV obtained via impedance readouts were comparable to those generated by the conventional crystal violet staining-based TCID50 assay. These results demonstrate that virus quantification can be precisely and efficiently achieved using impedance measurement in combination with the Virology Module of the system's software. The new assay streamlines traditional methods while providing enhanced insight into viral dynamics, thereby supporting advanced virological research and expanding potential clinical applications.
Introduction
As virology research rapidly evolves, accurate quantification of viral infectivity remains crucial to understanding viral mechanisms, developing antiviral therapies, and assessing vaccine efficacy. One of the most important procedures is measuring viral titer, the concentration of viral particles in a sample. The TCID50 assay, which quantifies the number of infectious virus particles required to produce CPE in 50% of inoculated cells, is one of the most commonly used methods to determine functional viral titer. This widely used endpoint assay is especially valuable for viruses that do not form plaques and can serve as an alternative to the plaque assay1.
In general, the TCID50 assay takes 2-14 days, depending on the virus and permissive cells. CPE, including changes in cell proliferation, morphology, and viability, is assessed by either (1) colorimetric measurement after the addition of reagents, such as MTT (3-(4,5-dimethylthiazol-2-yl)-2,5-diphenyltetrazolium bromide) assay and MTS (3-(4,5-dimethylthiazol-2-yl)-5-(3-carboxymethoxyphenyl)-2-(4-sulfophenyl)-2H-tetrazolium) assay, using a plate reader2, or (2) visual evaluation of morphological or culture-related changes using optical imaging platforms -- for example, assessing CPE by measuring percent confluency3, or (3) visual detection of CPE by crystal violet staining following fixation of virus-treated wells with formalin or paraformaldehyde (PFA). The positive rate of viral infection derived from the number of CPE-positive replicates at each viral dilution is the basis for the TCID50 calculation. The dilution at which 50% of cultures exhibit CPE is statistically calculated using established formulas4, such as Reed-Muench, Spearman-Karber, and Improved-Karber, and the result is reported as TCID50 per milliliter (TCID50/mL).
Traditional TCID50 and plaque assays are widely recognized as the gold standard for functional viral quantification and can provide invaluable insights. However, these assays are often tedious, time-consuming, and require manual staining to visualize CPE, resulting in low throughput, increased risks of human error, and subjectivity. For highly infectious or lethal viruses, minimizing exposure time to viruses and reducing virus-containing waste from additional steps, such as staining, are important considerations for improving biosafety. Except for the label-free imaging-based TCID50 assay, most TCID50 and plaque assays are also endpoint assays, which may result in suboptimal timing for titer assessment and limit the ability to observe the dynamic interactions between viruses and host cells. To overcome these limitations, a streamlined, label-free, and real-time TCID50 assay was developed and established. While conceptually like the conventional TCID50 assay, the new method leverages cellular impedance readouts, captured and analyzed by the RTCA MP system, to monitor infection objectively and continuously over time.
It has been demonstrated and verified that impedance-based biosensing provides a qualitative and quantitative composite readout of cell number, morphology, and cell-substrate attachment strength in a label-free, noninvasive manner5,6. Previous studies have demonstrated that virus-induced CPE can be accurately quantified in real time using RTCA impedance measurements7,8,9. Instead of reporting raw impedance values, the systems use a unitless parameter called Cell Index (CI) to reflect changes in impedance due to cellular events. For example, as cells adhere to, spread, and grow on the bottom of the well, CI increases. Conversely, when cells die or shrink, or detach, such as during a viral infection, CI decreases.
Considering the promising reports using impedance to measure CPE, this study aimed to demonstrate that the impedance-based TCID50 assay is a reliable and accurate alternative to conventional viral quantification. The Virology module of the system's software enables automated TCID50 calculation throughout the entire real-time CPE measurement, streamlining and shortening the assay process while providing valuable insights into the kinetics of virus replication and their interaction with permissive cells.
Protocol
The reagents and the equipment used are listed in the Table of Materials.
1. Impedance-based TCID50 assay
NOTE: As Figure 1 illustrates, an impedance-based TCID50 assay consists of four steps, including permissive cell seeding on a biosensor plate, virus dilution preparation and inoculation, CPE measurement on the system, and finally, data analysis and TCID50 calculation using the Virology module of the system's software.
- Assay preparation: revive and subculture permissive cells
NOTE: This step needs to be performed one week before the assay. To minimize variation across experiments, it is highly recommended that a cell bank of permissive cells at the same passage number be prepared for use in the assay. Do not use cells older than 15 passages after purchase from the cell provider.- Thaw cryopreserved permissive cells
- Warm cell growth media in a 37 °C water bath for at least 30 min. For example, Dulbecco's Modified Eagle Medium (DMEM), supplemented with 10% fetal bovine serum (FBS) and 1% penicillin/streptomycin, was used for HEK293A culture.
- Thaw a vial of cells from the cell bank cryopreserved for TCID50 assays by gently swirling in a 37 °C water bath for 1-2 min until a few ice crystals are present; do not submerge the cap. Wipe the vial with 70% ethanol and place it into a laminar hood.
- Gently transfer the cells to a new 50 mL conical tube and add 9 mL of warmed growth medium to the cells.
- Centrifuge the cell suspension at 300 x g for 4 min at room temperature.
- Discard the supernatant and resuspend the cells in 15 mL of warmed growth medium. Transfer them to a new T75 flask.
- Grow cells to 80%-90% confluency in a 37 °C incubator with 5% CO2.
- Subculture of permissive cells.
- Monitor cells until they reach 80%-90% confluency.
- Remove serum-containing media from the flask and gently rinse the cell monolayer once with Mg- and Ca-free Dulbecco's phosphate-buffered saline (DPBS).
- Trypsinize cells by evenly distributing 2 mL of 0.05% Trypsin/EDTA solution per T75 flask and leaving the flask in a 37 °C incubator for 1-3 min.
NOTE: Do not over-trypsinize the cells, as this can be harmful to the cells. - Stop trypsinization by adding 8 mL serum-containing media to dilute the original trypsin volume at least fivefold. Transfer 2.5 mL of the cell suspension to a new T75 flask, then add 8 mL of culture medium.
NOTE: Avoid using freshly thawed permissive cells for the TCID50 assay. Instead, use cultured cells at 80%-90% confluency. To reduce inter-experimental variability, revived cells should be maintained for a maximum of two weeks following thawing. To ensure high cell viability and proliferation during the two-week culture: (1) change growth medium at least twice per week; (2) subculture cells when they reach 80%-90% confluency. For extended maintenance beyond two weeks, validation is required.
- Thaw cryopreserved permissive cells
- Viral titer
NOTE: This step needs to be performed on Day 1.- Measurement of the biosensor plate background
- Carefully transfer 50 µL of prewarmed media to each well using a multichannel pipette, using the reverse pipetting technique to minimize bubble formation and ensure consistent volume dispensation.
- Place the plate into the plate Station; open the system's software and select the Virology module before starting the experiment. Enter any relevant notes on the Exp Notes tab, and input cell information, including cell name and number, on the Cell subtab of the Layout tab after selecting the corresponding wells. Alternatively, cell information can be entered after seeding.
NOTE: Plate background measurement must be done before adding cells into the wells of the plate. Background readings for all wells should read between -0.063 and 0.063. - On the Schedule tab, click on the Add a Step button to add Step 1, which is designated for plate background measurement. Then, initiate recording by clicking on the Start button.
- Remove the plate from the Station and place it back in the hood for cell seeding.
- Permissive cell seeding to the 96-well biosensor plate
- Trypsinize the permissive cells from the T75 flask.
- Count the cells and adjust the cell suspension to the desired concentration. In this study, the concentration of HEK293A was 60,000 cells/mL.
- Add 100 µL of cell suspension to each well of the plate.
NOTE: The proper cell density is essential. Suboptimal seeding density could result in an experimental artifact. Therefore, seeding density needs to be optimized before performing a TCID50 assay. - Leave the plate in the hood at room temperature for 30 min after cell addition, allowing the cells to distribute evenly on the bottom of the well.
NOTE: Failure to perform this step could result in large well-to-well variations. - Place the plate into the plate Station inside a 37 °C incubator with 5% CO2.
- Navigate to the Schedule tab of the software and add Step 2 using the default recording settings: 100 Sweeps and a 15-min Interval. This will initiate impedance/CI monitoring every 15 min, allowing real-time assessment of cell attachment and proliferation as a cell quality control (QC) step prior to virus inoculation.
NOTE: Day 2 - To maximize assay reproducibility and consistency across experiments, it is critical to assess cell performance on the system before proceeding to the next step. Since CI reflects cell attachment and growth, CI values during the 20-28 h post-seeding period serve as a key quality control parameter. Both the value and kinetics of CI are cell-specific. In this study, for HEK293A cells seeded at 6,000 cells per well and cultured for 20-28 h, the CI should exceed 2. If the CI does not reach 2 within 20-28 h post-seeding, the HEK293A cell culture is considered to have failed quality control (QC), and the subsequent TCID50 assay will not be performed. This criterion ensures high reproducibility of experimental outcomes.
- Preparation of virus serial dilutions
- Calculate the total volume of the medium (DMEM + 2% FBS + 1% penicillin /streptomycin) needed to prepare the dilutions, and warm it in a 37 °C water bath for 30 min. The medium will be used for the rest of the experiment.
- Rapidly thaw a vial of aliquoted virus stock in a 37 °C water bath for 1-2 min until all ice crystals have melted.
- Prepare 10-fold serially diluted viruses by transferring 20 µL of the virus stock to a 1.5 mL microcentrifuge tube containing 180 µL of prewarmed media at each step. Pipette up and down to ensure thorough mixing of the medium and virus.
NOTE: Do not submerge the pipette tip too deeply into the viral solution to prevent carrying excess viral particle residue outside the tip, which could result in inaccurate dilutions. - To prevent fluctuations in impedance readouts caused by the addition of cold virus samples, equilibrate the virus dilutions by incubating them in the incubator at 37 °C with 5% CO2 for 20 min before inoculation.
- Enter virus treatment information on the Layout tab
- On the plate Layout tab of the software; select the wells for the viral titer treatment; click the subtab Treatment, and input initial Dilution, for example, 0.001 (10-3) in this experiment; enter 10 as the "Dilution Factor"; select the Direction of dilution, from left to right in this case. The viral dilution will be automatically calculated based on the plate layout input and displayed in each corresponding well.
- Next, enter the virus Inoculation Volume and click on the Apply button to save all treatment information. This step is essential for accurately calculating TCID50/mL during data analysis.
- Assign the wells that will not be treated with viruses as negative controls by selecting the appropriate wells and then checking Negative Ctrl under Well Type in the Treatment tab.
NOTE: Negative control wells must be designated and added to the Layout page; omission will prevent TCID50 calculation.
- Virus inoculation
- When ready, press the Pause button in the software to stop data acquisition. Remove the plate from the Station and place it in the laminar hood.
- Carefully remove the culture media from the wells of the plate using a multichannel pipette.
- Gently add 50 µL of viral dilution using a multichannel pipette to the top of the cell monolayer, avoiding disruption of the cell culture.
- Place the plate back into the Station and add Step 3 using the default recording settings (100 Sweeps and a 15-min Interval) on the Schedule tab to resume recording impedance every 15 min for 2 h, allowing the virus to bind to the cells.
- After 2 h of virus inoculation, pause the recording and remove the plate from the Station to the laminar hood.
- Slowly add 150 µL of prewarmed medium into the wells using a multichannel pipette, avoiding disruption of the cell monolayer; return the plate to the Station.
- Resume Step 3 by clicking on Start on the Schedule tab. The impedance signals are continuously measured every 15 min throughout the inoculation period.
- Calculation of TCID50 either during or after the TCID50 assay is completed
- On the Data Analysis tab, select and add all the wells used in the assay to the plot chart. The y-axis of the chart is determined by the option selected from the Y Axis dropdown menu.
- Navigate to the Parameter section. Select TCID50 from the Parameter dropdown list to initiate TCID50 calculation.
- Choose Bar Chart for TCID50 calculation at a specific time point or select Time Dependent TCID50 to generate the TCID50 time course over a desired period during inoculation. The TCID50/mL will be calculated and displayed after clicking the execution button.
- Measurement of the biosensor plate background
2. Crystal Violet-TCID50 assay
- Seed permissive cells in a 96-well microplate at the optimal seeding density as described in the impedance-based TCID50 assay (steps 1-2).
- Perform virus serial dilution preparation and inoculation as specified in the impedance-based TCID50 assay.
- Fixation and staining
- After the assay completion, gently discard the supernatant from each well and add 100 µL of 4% formaldehyde to fix cells.
- Incubate at 4 °C for 1 h, then remove the fixative.
- Stain the fixed cells with 0.5% Crystal Violet prepared in PBS. Incubate at room temperature for 30 min.
- Wash the plate with tap water until the background is cleared. Let the plate air dry completely before scoring.
NOTE: Crystal violet waste is considered hazardous under both RCRA and California Code of Regulations (CCR 66261.24). Collect all spent crystal violet solutions, contaminated materials (e.g., paper towels, gloves), and rinse waste in a designated hazardous waste container. Dispose of the waste through your institution's Environmental Health & Safety (EH&S) or licensed hazardous waste disposal contractor.
- Scoring and TCID50 calculation
- Visually inspect each well for CPE. A positive well shows partial or complete monolayer destruction and lighter staining. A negative well retains an intact monolayer with dark purple staining.
- Count the number of positive and negative wells for each dilution.
- Manually calculate TCID50/mL using the Reed-Muench method, based on an inoculation volume of 150 µL.
Results
Label-free, real-time, dynamic monitoring of virus-mediated CPE using impedance
To confirm that virus-induced CPE can be reliably and quantitatively measured by impedance, we first recorded cellular changes in HEK293A cells after Adv-GFP infection using an RTCA eSight system that simultaneously measures impedance and captures live-cell images from the same cell population, delivering insightful information on cell behavior. HEK293A cells were seeded on a 96-well biosensor plate at a seeding density of 6,000 cells/well for 24 h and then infected with Adv-GFP at 104 IFU/mL. Impedance and live-cell imaging were recorded for 250 h post-inoculation (Figure 2A). To minimize variability from differences in cell seeding and reveal relative changes after treatment, the Normalized Cell Index (NCI) was used to represent the collective changes in cell growth, attachment, and viability over time. NCI is calculated by dividing CI at a given time point by its CI at the normalization time point (the time before inoculation). The NCI kinetic trace of the uninfected control (Figure 2A, black trace) shows a gradual increase over the first 48 h, indicating continuous cell proliferation. It is followed by a plateau at the end of the test, indicating that the cells had become confluent and covered the entire surface area of the gold biosensors. In contrast, the kinetics of NCI from the virus-infected wells dropped below the control 50 h post-inoculation and progressively declined until reaching zero at 100 h.
Live-cell imaging acquired from the same cell population visually confirmed that the impedance signal reliably mirrors the physical condition of the permissive cells as they advance through the entire CPE continuum. As shown in Figure 2A, there is an inverse correlation between the NCI and expression of viral GFP in infected HEK293A cells observed within the first 100 h before the complete lysis of the permissive cells. In addition, the live-cell images (Figure 2B) recorded at the specified time points further demonstrate a permissive cell status during viral infection. Cell growth persisted during the first 48 h post-infection, while virus particles remained at low levels within cells. However, as virus replication and infection progressed, cell death began, evidenced by reduced confluency and increased GFP signal in the host cells. Approximately 100 h after inoculation, the viral GFP expression began to decline due to the significant loss of viable permissive cells. This integrated approach reinforces the reliability of detecting virus-induced CPE by impedance, establishing a solid foundation for the impedance-based TCID50 assay.
Automated calculation of TCID50 derived from impedance readout
Accurately identifying the positive CPE wells is crucial for reliable TCID50 calculation. To evaluate whether the impedance-based TCID50 assay can precisely and objectively differentiate between positive and negative CPE with the support of the Virology module of the system's software, the HEK293A cells were seeded at 6,000 cells/well for 24 h before inoculation and treated with a series of tenfold dilutions of Adv-GFP, using eight replicates (wells) for each dilution. The Adv-induced CPE was recorded in real-time on the RTCA system. In Figure 3A, impedance kinetic traces, presented as NCI, were recorded and automatically plotted throughout the experiment. The decrease in the NCI after inoculation reveals a clear dose-dependent CPE, demonstrated by the strong correlation between the amount of virus added and the rate at which the impedance signal decreases. The cells exposed to high viral loads, between 10-3 to 10-7 dilution, exhibited sharp and consistent declines in NCI, reflecting robust and uniform CPE across replicate wells. In contrast, at a 10-8 virus dilution, the kinetic trace exhibited large variability from the onset, resulting in significantly larger NCI standard deviations, particularly beyond 100 h post-inoculation. When the viral load was further reduced below the threshold needed to cause infection, in this case, a 10-10 dilution, the NCI became indistinguishable from the negative controls. These data suggest that at a 10-8 dilution, 1) the virus could not induce CPE in all the repeated wells at similar kinetics; 2) this dilution would be a dividing line between concentrations that cause CPE in all the repeats and those that only induce CPE in some or none of the replicates; This binary outcome, infected (indicated by CPE-induced CI changes) or not infected (no CI change), forms the basis for calculating TCID50 using statistical methods in the system software. Therefore, the profound variation in NCI observed at certain virus concentrations is a pivotal indicator for the occurrence of partial infection and could be crucial for extrapolation required to calculate the TCID50.
Like the classical TCID50 assay, the threshold for positive CPE must be defined before the built-in software can automatically identify the CPE-positive wells. Because different viruses and permissive cell models may require distinct thresholds, the software allows users to configure and refine these criteria within the Virology module. Based on empirical data, the software's default threshold for positive CPE was applied, defined as the NCI value of the virus-treated well being more than three standard deviations below the average NCI of the negative (non-inoculated) controls, i.e., NCIvirus-treated < (NCI-3 X SD)neg ctrl. The individual wells were then scored as either positive (+) or negative (-) (Figure 3B). In this case, the TCID50/mL of Adv-GFP was subsequently calculated using the Reed-Muench formula, one of the formulas included in the software. Aside from selecting or defining criteria for positive CPE, no manual actions were required for the TCID50 calculation, as the software fully automated the process.
Dynamic tracking of TCID50 during virus infection
To determine the appropriate duration of the TCID50 assay, Adv-GFP TCID50 values were extracted at desired time points post-infection, starting at 30 h, and continuing in 30-h increments up to 240 h. A 30-h increment was deliberately selected as adenovirus replication is reported to take approximately 30 h10. The Adv-GFP TCID50 values were plotted as a function of time (Figure 4). A notable observation is the gradual augmentation of TCID50 values, which continues until approximately 150 h post-inoculation. Beyond this point, a plateau emerges, indicating an equilibrium where cytopathic effects have likely reached saturation. The time-dependent increase, followed by stabilization, suggests a typical viral replication curve. The initial phase is characterized by active viral propagation, culminating in a peak reflecting the maximum cytopathic impact under the given experimental conditions. The plateau phase of the TCID50 may reflect a biological ceiling where the viral infection process has engaged the majority of permissive cells, resulting in significant cell death and halting further virus replication. The TCID50 kinetic time course suggests the assay can be terminated six to seven days post-inoculation for the adenovirus-HEK293A model, as a steady TCID50 value of 8.9 × 10⁹ TCID50/mL was observed as early as 150 h.
Quantification of influenza A virus titer using impedance-based TCID50 assay
To investigate whether the impedance-based TCID50 assay can be expanded to other virus-host models, a TCID50 assay was performed in MDCK cells infected with IAV. While accommodating for minor variations in the infection medium specific to IAV, the core assay procedure remained consistent with that established for adenovirus. Figure 5A shows the NCI of MDCK cells over time after inoculation with IAV dilutions ranging from 1 x 10⁻² to 5 x 10⁻⁹. Similar to the results observed in the Adv-infected HEK293 A cells, the uninfected/negative control wells exhibited steady and consistent NCI across replicates. However, the virus-infected wells revealed a dose-dependent NCI change. At the low doses, 6.4 and 1.3 x 10⁻⁷ dilutions, a large standard deviation was observed. This suggests that at these dilutions, the concentration of the virus was approaching TCID50.
CPE-positive wells were identified using the same criteria and threshold applied in the Adv-HEK293A model, specifically, a threefold standard deviation below the mean of the negative control wells. The impedance-based TCID50 values for IAV were also determined at various time points after inoculation. Figure 5B shows the average TCID50 values from two independent experiments. Except for the early time point at 60 h, the TCID50 values from 90-150 h post-infection demonstrated good stability and consistency, indicating that the impedance-based TCID50 assay for IAV can be reliably completed in four days instead of five. This consistency reinforces the robustness of the impedance-based method, confirming its adaptability and reliability across different viral pathogens.
Validation of impedance-based TCID50 assay using the conventional TCID50 method
To verify the impedance-derived TCID50 for IAV concentration measurement, TCID50 assays using two alternative approaches were performed in parallel: label-free imaging and crystal violet staining. Briefly, MDCK cells were prepared and seeded into 96-well microtiter plates. The following day, the cells were inoculated with a series of IAV dilutions for 5 days. For the imaging-based TCID50 assay, the live-cell imaging was acquired every 4 h. The concentrations of ten IAV samples were assessed in the validation study. The cell confluency of virus-treated wells was compared to that of the negative, non-infected wells using the system's software. However, imaging analysis for MDCK cells was particularly challenging, as illustrated in Figure 6A. Accurate differentiation between cells and empty spaces was challenging due to the flat morphology and poorly defined edges of MDCK cells, compromising reliable identification of CPE-positive wells through imaging-based analysis. Employing more advanced and sophisticated imaging analysis software may enhance the accuracy of TCID50 calculations in such cases11. In this instance, label-free imaging-based TCID50 assessment was unsuccessful using the current system software. For the crystal violet staining-TCID50 assay, the cells were fixed and stained on day 5 after inoculation as described in the protocol section. Figure 6B demonstrates a strong linear correlation between the impedance-based and crystal violet staining-based TCID50 values, with a regression equation of y = 0.9582x and an R² = 0.9979. This comparative analysis underscores the reliability of the impedance-based method for viral titer measurement and its suitability for TCID50 assays.
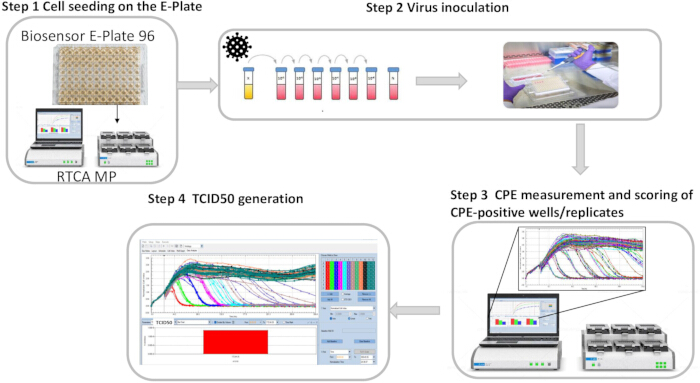
Figure 1: Impedance-based TCID50 assay workflow. Step 1: Permissive cell seeding on the biosensor plate. Seed the permissive cells on a plate at an optimal seeding density. The cell growth is then monitored on the system as part of the cell quality control (QC) procedure. Step 2: virus preparation and inoculation. Prepare serially diluted virus stocks using a user-defined dilution factor. Remove the plate from the system and add the viruses to the wells of the plate in a laminar hood. Step 3: CPE measurement and scoring of CPE-positive wells using the Virology module software. Return the plate to the system and resume real-time recording of virus-induced CPE. The software automatically identifies CPE-positive wells based on the user-defined threshold set for CPE detection. Step 4: TCID50 calculation. With the real-time scoring of CPE-positive wells over virus inoculation, the Virology module software can calculate TCID50 values at any given time point throughout the assay. Please click here to view a larger version of this figure.

Figure 2: Adenovirus-induced CPE was assessed using both impedance-based and imaging-based methods (A) Dynamic profiling of impedance (left y-axis) and green fluorescence (right y-axis) in HEK293A cells over time following infection with Adv-GFP. The Normalized Cell Index for adenovirus-infected cells (NCI Adv-infected, red line), negative control cells (NCI NC, black line), and GFP total integrated intensity (GFP Adv-infected, green line) are plotted as a function of time. The total integrated GFP intensity reflects GFP expression in permissive cells and serves as an indicator of viral infection. The numbers (1-6) along the Normalized Cell Index correspond to specific time points during the infection process. The data are presented as mean ± SD (N = 8). (B) Sequential images of HEK293A cells before and after infection with Adenovirus-GFP. (1) The baseline image (0 h) is followed by snapshots at 48 h (2), 72 h (3), 96 h (4), 120 h (5), and 200 h (6) post-infection, illustrating the change in cell growth, viability, and adenovirus-GFP fluorescence over time. Scale bars = 160 µm. Please click here to view a larger version of this figure.
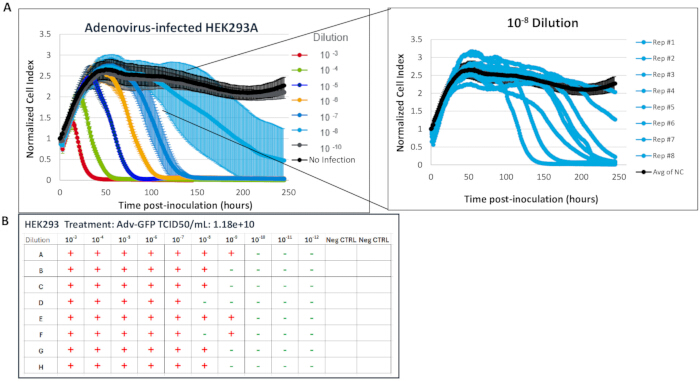
Figure 3: Dose-dependent CPE of adenovirus-GFP in HEK293A cells measured by impedance. (A) HEK293A cells were seeded in a biosensor plate at a density of 6,000 cells/well, and 24 h later, were infected with a series of 10-fold diluted adenovirus-GFP. The data are presented as mean ± SD (N = 8). Inset: Normalized Cell Index of the wells infected with adenovirus-GFP at 10-8 dilution. The data from 10-9, 10-11, and 10-12 dilutions are omitted for clarity. (B) The individual wells/replicates at each virus dilution were scored as either CPE-positive (+) or CPE-negative (-). Each column of the plate was treated with a different virus dilution, with the dilution gradient ranging from the lowest in column 1 to the highest in column 10. Columns 11 and 12 were negative control wells, with no virus treatment. Please click here to view a larger version of this figure.

Figure 4: The time course of TCID50 values derived from impedance measurements of CPE in HEK293 cells after being infected with adenovirus-GFP. TCID50/mL of adenovirus-GFP was calculated at the specific time points using the Virology module from five experiments. Although the Virology module provides three TCID50 calculation formulas, the Reed-Muench formula was selected for TCID50 calculation. The data are presented as mean ± SD (N = 5). Please click here to view a larger version of this figure.
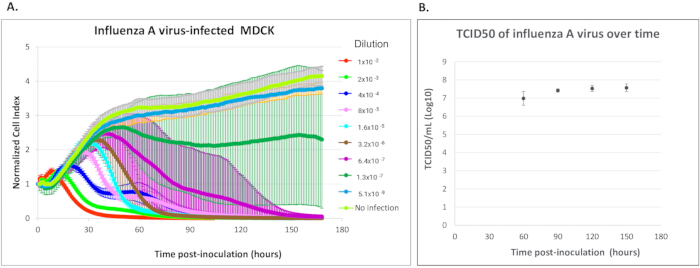
Figure 5: Influenza A virus titer assessment using the impedance-based TCID50 assay. (A) Dose-dependent CPE of IAV in MDCK cells measured via impedance. MDCK cells were seeded into a biosensor plate at 8,000 cells/well and infected 24 h later with a five-fold serial dilution of influenza virus. Data are shown as mean ± SD (N = 8). Data from the 2.6 × 10⁻⁸ dilution are omitted for clarity. (B) Time course of TCID50 values derived from impedance measurements in IAV-infected MDCK cells. The Reed-Muench method was used for TCID50 calculation. Data are presented as mean ± SD (N = 2). Please click here to view a larger version of this figure.

Figure 6: Correlation between Impedance-based and crystal violet staining-based TCID50 assays. (A) Image of MDCK cells inoculated with IAV. Scale bar = 160 µm. (B) A comparison of TCID50/mL values obtained from impedance-based and crystal violet staining-based methods was performed using ten IAV samples. Please click here to view a larger version of this figure.

Figure 7: The representative interfaces of the system's Virology module software. The software streamlines the impedance-based TCID50 assay process. (1) Plate layout for recording the experiment design; (2) Cell Index or Normalized Cell Index was automatically plotted and displayed by the software during virus inoculation; (3) the software provides flexibility in determining positive-CPE criteria and choices for TCID50 calculation formula; (4) TCID50/mL can be determined at any given time point during the assay. Please click here to view a larger version of this figure.
Discussion
In this study, the applicability of impedance for viral titer determination was demonstrated using adenovirus-HEK293A and influenza A virus-MDCK models. Others have also validated the robust and reliable detection of virus-induced CPE using RTCA systems across a wide range of viruses, including orthopoxvirus12, West Nile Virus (WNV) and St. Louis encephalitis virus (SLEV)13, chikungunya virus14, infectious bursal virus8, chimeric yellow fever dengue15, hepatitis A virus16, SARS-CoV-217, and the dengue virus9.
Real-time CPE recording through impedance enables the discovery of virus-specific time-dependent drops in CI value in certain virus-permissive cell models. Fang et al. first demonstrated that a kinetic parameter characterizing flavivirus-induced CPE, CIT50—defined as the time to a 50% decrease in cell impedance—is inversely proportional to the viral infectious dose within a specific range. They also showed that CIT50 is proportional to the reciprocal of the neutralizing antibody titer13. Since then, Charretier et al. at Sanofi Pasteur have investigated this impedance-based real-time cell analysis (RTCA) method for determining viral infectious titers during the development of the chimeric yellow fever-dengue (CYD) vaccine product and process15. Charretier et al.15 further validated this impedance-based cell culture infectious dose 50% (CCID50) with an immunostaining-based CCID50 assay. They demonstrated that the impedance-based RTCA method is approximately 5 times less labor-intensive and 3.5 times more cost-effective than the standard CCID50 assay in an industrial setting. In our study, the validation of impedance-based TCID50 against the traditional Crystal Violet TCID50 assay was demonstrated for IAV-induced CPE. In addition, the Virology software module in the RTCA software was utilized. The CPE-positive wells were automatically identified based on user-defined criteria for CPE-positive wells in the software; for our case, the degree of CI drops compared to the negative controls. The TCID50 was then calculated by the software accordingly, enabling accurate titer determination without relying on CIT50 or risking the test sample falling outside the optimal range. Setting an appropriate threshold for CPE-positive wells is crucial as it directly impacts the sensitivity and specificity of the assay. It is recommended that users determine virus-specific criteria by comparing Cell Index changes against results from their validated conventional method. These empirically derived thresholds can then be configured and refined within the Virology module of the software.
Like other cell-based assays, the condition of the permissive cells used in impedance-based TCID50 assays is critical in determining the success of the test and the quality of the results. To ensure high cell proliferation and viability, fresh, low-passage cells are recommended. Additionally, making a cell bank of permissive cells at the same passage can improve reproducibility across experiments. As indicated in Figure 3A, when the permissive cells were in optimal conditions, they generated stable and consistent impedance signals in the uninfected controls throughout the entire assay. It provided a reliable baseline reference to establish a threshold for CPE-positive wells, resulting in a precise viral titer determination. In addition, the impedance-based TCID50 assay is uniquely capable of performing quality control on permissive cells before viral titer assessment. The characteristic kinetic CI profile of healthy permissive cells serves as a reliable quality control metric, ensuring that only viable and consistent cell populations are used for viral quantification, thereby enhancing the reproducibility and accuracy of the assay.
For each new virus, impedance-TCID50 assay optimization and validation should also be conducted before implementation. Key factors, such as cell culture conditions, including the basal medium and FBS concentration, are critical to achieving reproducible cellular impedance data and enhancing the sensitivity of CPE detection, as highlighted by previous studies6,16. In this regard, label-free, real-time impedance-based technology has proven to be a simple, efficient, and valuable tool to optimize cell culture conditions during assay development16.
A limitation of the impedance-TCID50 assay arises with viruses that do not cause CPE, as the assay relies on CPE to generate changes in impedance readout, which forms the basis for TCID50 calculation. In such cases, it may be necessary to identify an alternative permissive cell model that can exhibit virus-induced CPE or to adopt an immunostaining approach, provided a suitable antibody against the specific virus antigen is available. Nevertheless, this study demonstrated the ability of the RTCA MP system to capture dose-dependent CPE and effectively distinguish between infected and uninfected cell populations via an objective and sensitive impedance readout.
The introduction of TCID50 time-dependent analysis represents a significant advancement over traditional endpoint measurements. It simplifies the TCID50 assay optimization process, as the optimal time point to calculate and report viral titer can be easily obtained from a single real-time assay. While imaging-based label-free TCID50 assays can also provide time-resolved TCID50 values, their applicability is limited to virus-cell models that exhibit CPE recognizable by the imaging software algorithms, as demonstrated in the IAV-MDCK model (Figure 6A). Furthermore, using label-free impedance for CPE detection eliminates the complications of using various reagents and multiple-step workflows that potentially increase risks associated with human errors. In addition to simplifying the workflow, the Virology module of the system's software also streamlines the assay. First, it starts with an easy experiment schedule setup for automatic system-controlled recording. It is followed by real-time, spontaneous CPE-positive scoring after each measurement and concludes with automated TCID50 calculation for a straightforward quantification of infectious virus particles (Figure 7). This automation significantly reduces hands-on time, a crucial improvement, particularly when handling highly infectious viruses.
Materials
| Name | Company | Catalog Number | Comments |
|---|---|---|---|
| 0.05% Trypsin 0.53 mM EDTA (1x ) | Corning | 25-052-CI | |
| 12 Channel reagent reservoirs | VistaLab Technologies | 3054-1011 | |
| Adenovirus-GFP | Vector Biolabs | 1060 | |
| DMEM medium | ATCC | 30-2002 | |
| E-Plate VIEW 96 | Agilent | 300601020 | |
| Fetal bovine serum | Avantor | 97068-085 | |
| Hek293A cell | Thermo Fisher Scientific | R70507 | |
| Penicillin-Streptomycin solution | HyClone | SV30010 | |
| Phosphate buffer saline (1x) | HyClone | SH30256.01 | |
| Seaplaque agarose | Lonza | 50101 | |
| xCELLigence RTCA eSight system | Agilent | S2833AA | |
| xCELLigence RTCA MP system | Agilent | 380601040 |
References
- Smither, S. J., et al. Comparison of the plaque assay and 50% tissue culture infectious dose assay as methods for measuring filovirus infectivity. J Virol Methods. 193 (2), 565-571 (2013).
- Pourianfar, H. R., Javadi, A., Grollo, L. A colorimetric-based accurate method for the determination of enterovirus 71 titer. Indian J Virol. 23 (3), 303-310 (2012).
- Hochdorfer, D., Businger, R., Hotter, D., Seifried, C., Solzin, J. Automated, label-free TCID50 assay to determine the infectious titer of virus-based therapeutics. J Virol Methods. 299, 114318(2022).
- Lei, C., Yang, J., Hu, J., Sun, X. On the Calculation of TCID50 for quantitation of virus infectivity. Virol Sin. 36 (1), 141-144 (2021).
- Giaever, I., Keese, C. R. Micromotion of mammalian cells measured electrically. Proc Natl Acad Sci U S A. 88 (17), 7896-7900 (1991).
- Atienza, J. M., et al. Dynamic and label-free cell-based assays using the real-time cell electronic sensing system. Assay Drug Dev Technol. 4 (5), 597-607 (2006).
- Cheung, C. Y., Leung, C. K., Peiris, J. S. Potential of the real-time and label-free cell sensor impedance technology to transform cell-based infectivity assays for influenza viruses. Influenza Other Respir Viruses. 5 (Suppl 1), 151-154 (2011).
- Ebersohn, K., Coetzee, P., Venter, E. H. An improved method for determining virucidal efficacy of a chemical disinfectant using an electrical impedance assay. J Virol Methods. 199, 25-28 (2014).
- Goh, V. S. L., et al. Evaluation of three alternative methods to the plaque reduction neutralizing assay for measuring neutralizing antibodies to dengue virus serotype 2. Virology J. 21 (1), (2024).
- Crisostomo, L., Soriano, A. M., Mendez, M., Graves, D., Pelka, P. Temporal dynamics of adenovirus 5 gene expression in normal human cells. PLOS One. 14 (1), e0211192(2019).
- Wang, T. E., et al. Differentiation of cytopathic effects (CPE) induced by influenza virus infection using deep convolutional neural networks (CNN). PLoS Comput Biol. 16 (5), e1007883(2020).
- Witkowski, P. T., et al. Cellular impedance measurement as a new tool for poxvirus titration, antibody neutralization testing and evaluation of antiviral substances. Biochem Biophys Res Commun. 401 (1), 37-41 (2010).
- Fang, Y., Ye, P., Wang, X., Xu, X., Reisen, W. Real-time monitoring of flavivirus induced cytopathogenesis using cell electric impedance technology. J Virol Methods. 173 (2), 251-258 (2011).
- Marlina, S., Shu, M. -H., Abubakar, S., Zandi, K. Development of a real-time cell analysing (RTCA) method as a fast and accurate screen for the selection of chikungunya virus replication inhibitors. Parasites & Vectors. 8 (1), (2015).
- Charretier, C., et al. Robust real-time cell analysis method for determining viral infectious titers during development of a viral vaccine production process. J Virol Methods. 252, 57-64 (2018).
- Lebourgeois, S., et al. Development of a real-time cell analysis (RTCA) method as a fast and accurate method for detecting infectious particles of the adapted strain of Hepatitis A virus. Front Cell Infect Microbiol. 8, (2018).
- Suryadevara, N., et al. Real-time cell analysis: A high-throughput approach for testing SARS-CoV-2 antibody neutralization and escape. STAR Protoc. 3 (2), 101387(2022).
Reprints and Permissions
