This bilingual protocol provides a computational drug discovery workflow assessing protein-ligand interactions of Polo-Like Kinases 1 to 3 (PLK1–3) and Absorption, Distribution, Metabolism, Excretion, Toxicity, and Stability (ADMET-S) properties of database-sourced natural molecules.
Method Article
A Bilingual Computational Workflow for Identifying Potential PLK1 Inhibitors in American Sign Language and English
In This Article
Summary
Abstract
Polo-like Kinase 1 (PLK1) plays essential roles in the S, G2, and M phases of the cell cycle, and its overexpression is frequently observed in multiple cancers, including breast cancer, where it contributes to genomic instability and dysregulated apoptosis. Unlike conventional ATP-competitive inhibitors that target the kinase domain, selective inhibition of PLK1’s polo-box domain (PBD) offers a promising strategy to disrupt protein-ligand interactions critical for mitotic progression, thereby triggering apoptosis in cancer cells. However, the high structural similarity between PLK1 and its homologs (PLK2 and PLK3), which are vital for neurological function and the stress response, respectively, necessitates exceptional selectivity to avoid off-target effects. To address this challenge, the protocol entails a bilingual (American Sign Language and English) computational workflow that integrates virtual screening, structural clustering, protein-ligand docking, binding affinity prediction, ADMET-S profiling, and quantum mechanical (QM) stability analysis. Starting from the SuperNatural 3.0 natural product database, compounds were filtered using breast cancer relevance and drug-likeness criteria, clustered to ensure chemical diversity, and evaluated their interactions with PLK1-, PLK2-, and PLK3-PBD structures. While virtual docking and in silico ADMET-S assessments cannot definitively confirm selectivity or mechanism of action, this study generates testable hypotheses and prioritizes a focused set of natural-product-derived candidates for future molecular dynamics simulations, biochemical validation, or experimental screening.
Introduction
Polo-like Kinases (PLKs) are a family of protein kinases structurally composed of an N-terminal domain and a C-terminus consisting of one or two polo-box domains (PBD)1,2. The number and functional diversity of these polo-box domains vary among different PLK family members. PLK1 is involved in the S, G2, and M phases of cell division. In the cell cycle, PLK1 functions as a DNA damage checkpoint in the S phase and as a regulator of chromosomal condensation and centrosome maturation in the G2 phase. PLK1 also promotes mitotic entry into the M phase, followed by spindle assembly, anaphase entry, and cytokinesis3,4. Overexpression of PLK1 leads to genetic instability due to abnormal centrosome formation, resulting in malfunctioning cell cycles that render cells unable to regulate apoptosis. Such overexpression is observed in lung, head and neck, esophageal, gastric, colorectal, and breast cancers4. Therefore, inhibition of PLK1 through agents targeting the PBD could trigger apoptosis5,6. This workflow aims to achieve high selectivity to avoid inhibiting PLK2 and PLK3, which are crucial to neurological function and the management of genotoxic stress3.
PLK2 functions as a tumor suppressor in certain contexts, regulating the G1/S transition and promoting the degradation of cyclin E to prevent uncontrolled cell proliferation. PLK3 exhibits a complex role in both cell cycle regulation and the response to genotoxic stress, contributing to the maintenance of genome integrity through its involvement in DNA damage checkpoint activation and apoptosis induction7. Importantly, while PLK1 inhibition has emerged as a promising therapeutic strategy for cancer treatment, the essential roles of PLK2 and PLK3 in neurological functioning and stress response necessitate the development of highly selective inhibitors to minimize off-target effects on these crucial kinases3. This biological context and structural similarities above 38%3 underscore the importance of identifying compounds that specifically target PLK1's polo-box domain (PBD) without interfering with the protective functions of PLK2 and PLK3 in normal cellular physiology.
Known polo-like kinase (PLK) inhibitors, particularly those targeting PLK1, have been extensively studied due to their potential therapeutic applications in cancer treatment. Several compounds, including BI 2536, volasertib (BI 6727), onvansertib (NMS-1286937), and GSK461364, have been developed and advanced into clinical trials, often as ATP-competitive inhibitors8,9,10. Other types of inhibitors target the PBD, including Thymoquinone (TQ)11,12, Poloxin13,14, and Allopole-A15. Although reportedly promising, there are currently no approved PBD-specific inhibitors or late-stage clinical trials due to challenges, including suboptimal ADMET-S properties and off-target effects6. For example, several PLK1-PBD inhibitors are reportedly non-specific protein alkylators16, limiting their clinical applicability. Therefore, improving the selectivity and ADMET-S profiles of potential PLK1-PBD inhibitors remains a crucial goal in drug discovery.
The goal of this study is to explore potential PLK1-PBD inhibitors with ADMET-S properties using virtual screening, structural-similarity filtering, docking, binding-energy calculations, and ADMET-S evaluation. PLK2 and PLK3 were subjected to the same protocols to assess potential selectivity. While numerous computational pipelines exist for kinase inhibitor discovery, few integrate concurrent selectivity screening across PLK1–3 PBDs with comprehensive ADMET-S and quantum-mechanical stability analyses, particularly using natural product libraries. The workflow builds upon established virtual screening paradigms but is tailored for educational accessibility and early-stage hypothesis generation. The protocol requires only a standard laptop (8 GB RAM), free academic software, and no prior programming expertise, making it suitable for high school, undergraduate, and graduate settings, including course-based undergraduate research experiences (CUREs).
The computational pipeline for this work begins with protein preparation, where structures of PLK1-PBD, PLK2-PBD, and PLK3-PBD are retrieved from the Protein Data Bank (PDB) or modeled and processed to resolve structural discrepancies. Next, a natural product database screening was performed, filtering compounds based on potential as anti-breast cancer and Lipinski’s Rule of Five compliance. Subsequent steps are clustering into 50 representative structures based on molecular fingerprinting and similarity. These representatives underwent protein-ligand docking and binding affinity calculations, generating interaction data for the three PLKs. Subsequently, ADMET-S properties are evaluated using three different web servers to predict pharmacokinetics, drug-likeness, toxicity, and metabolic stability. QM calculations were used to assess molecular stability through Highest Occupied Molecular Orbital (HOMO) and Lowest Unoccupied Molecular Orbital (LUMO) analysis of the HOMO–LUMO gap. Finally, the ADMET-S data were analyzed to filter and rank compounds based on physicochemical, absorption, distribution, metabolism, excretion, toxicity, and stability criteria as potential and selective PLK1-PBD inhibitors.
Protocol
The Research Resource Identifiers (RRIDs) and version numbers of all software tools used are provided in the Table of Materials.
1. Target protein preparation
- Create a working directory for this project where structural files and computational results can be stored.
- Visit the Protein Data Bank to retrieve the identifier of target protein PLK1-PBD (4HCO11) and follow up with Chemistry at HARvard Molecular Mechanics - Graphical User Interface (CHARMM-GUI17,18) to resolve any structural discrepancies.
- Visit CHARMM-GUI and register an academic account. Upon registering an academic account, click the input generator, then PDB Reader, enter the PDB ID 4HCO, and click next step.
- On the next page, ensure that only PROA – protein chain A is selected and click the next step for the next two pages.
- Download step1_pdbreader.pdb to a directory, rename the file to 4hco or preferred, and use a text editor or code to rename occurrences of histidine (HSD) to (HIS).
- Repeat the procedure for the PLK2-PBD (PDB identifier: 4XB019) using CHARMM-GUI.
NOTE: For structures without PDB identifiers, such as the PLK3-PBD, use homology modeled structures or Alphafold20. Ensure sequence accuracy from Uniprot21.
2. Natural product database screening
- Visit the SuperNatural 3.0 Library database of natural products and select the diseases subpage22.
- Select breast cancer with any or no confidence limits, as the entirety of the results will need to be programmatically filtered, and click on Find. Click on Download the complete result file to save the results in a preferred directory as a .csv. Afterwards, use code to filter for those with 0.900–1.000 confidence limits (n = 1,193 out of 73,406).
NOTE: Alternatively, the Kyoto Encyclopedia of Genes and Genomes (KEGG) identifier for breast cancer can be entered on the pathways subpage23. - Go to the FAQ subpage, at the bottom, find the entire dataset available for download as a .csv file. Download this and use a script to match Simplified Molecular Input Line Entry System (SMILES) strings from the dataset to SuperNatural identifiers of the 1,193 molecules and prepare a list of their SMILES strings (smiles.csv).
- Select breast cancer with any or no confidence limits, as the entirety of the results will need to be programmatically filtered, and click on Find. Click on Download the complete result file to save the results in a preferred directory as a .csv. Afterwards, use code to filter for those with 0.900–1.000 confidence limits (n = 1,193 out of 73,406).
3. Cluster sampling
- Download an Anaconda distribution (https://www.anaconda.com/download) containing almost all open-source packages, or individually download an integrated development environment (IDE) such as RStudio (RStudio Desktop - Posit) or Jupyter (Jupyter Notebook). Install RDKit24, an open-source cheminformatics and machine learning package using Conda.
NOTE: Instructions for installing Conda and creating a Conda environment can be found at conda 25.9.2.dev31 documentation. For RDKit installation and module setup in the environment, see Installation — The RDKit 2025.03.6 documentation. - Place the “Lipinski.py” script in Supplemental File 1 in the same folder as “smiles.csv” and run it. The script opens the Conda environment, loads modules, reads the SMILES strings file, applies a filter based on Lipinski’s Rule of 5 for estimation of bioavailability and absorption (n = 999 out of 1,193), and saves a list of SMILES strings as “all.csv”.
NOTE: Confirm that “all.csv” has been generated and contains ~999 compounds (filtered subset). Open the file to verify that each entry contains a valid SMILES string. Python runs in RStudio after executing the following in the console: library(reticulate); reticulate::use_condaenv(nameofcondaenv) - Place the “Clustering.py” script (Supplemental File 1) in the same folder as “all.csv” and run it in the preferred IDE. The scripts load clustering modules, read the SMILES strings file, and group compounds into 50 clusters based on molecular fingerprinting and Tanimoto similarity.
NOTE: 50 representative structures (rep_struct.csv, in the Supplemental File 1) are saved in the directory as a list of SMILES strings. Tanimoto similarity (also known as the Jaccard index in cheminformatics)25 is a metric used to quantify the structural similarity between two molecules based on their molecular fingerprints, with the Tanimoto coefficient ranging from 0 (no similarity) to 1 (identical fingerprints). Ensure that “rep_struct.csv” has exactly 50 unique SMILES entries representing each cluster.
4. Protein-ligand docking and binding affinity calculation
- Visit the AutoDock Vina-based cavity detection guided Blind Docking web server (CB-Dock2)26.
- Go to the docking tab and upload the 4HCO protein.
- To upload the ligand, click on draw ligand and paste in a ligand from the list of SMILES strings (rep_struct.csv, Supplemental File 1). Enter an email address in the next field for easier zipped data collection, then click Auto Blind Docking. Repeat for the remaining 49 small molecule cluster representatives, labeling them lig1, lig2, …, lig50.
- Go to the emailed result and download the zip folders into a subdirectory titled 4HCO, titling them ordinally (4hco_lig1, 4hco_lig2, …, 4hco_lig50).
- Unzip the folders and remove all files except protein-ligand complex files ending with “.complex.pdb”.
NOTE: Verify that each ligand directory (4hco_lig1 to 4hco_lig50) contains the corresponding “.complex.pdb” file. - Open a sample .complex.pdb file with a text editor to carefully note the protein chain ID: P and the ligand ID: A:UNL and rezip the folders using a file compression utility.
- Visit the PROtein binDing enerGY prediction (PRODIGY) web server for assessing selectivity and protein-ligand binding affinity27.
- Click on the PRODIGY-lig (protein-small molecule) tab to upload a zipped folder with multiple protein-ligand complexes at a time (such as 4hco_lig1). Input the protein chain and ligand IDs, complete the captcha verification, and proceed to click Submit Prodigy-Ligand.
- Once the data has been processed, click on the archive file of all outputs (.zip) to download results. Repeat the previous step and result collection for all subdirectories up to 4hco_lig50.
- Repeat all steps for proteins 4XB0 and PLK3 with cautious attention to file nomenclature (like 4xb0_lig1 or plk2_lig1).
NOTE: Confirm that output CSVs for all protein-ligand complexes are downloaded and contain both ΔG and interface residue data columns.
- Unzip the folders and remove all files except protein-ligand complex files ending with “.complex.pdb”.
5. ADMET-S evaluation
- Visit the ADMETlab3 3.0 platform28.
- Click on GET STARTED under "ADMET Screening" and enter a list of SMILES.
- Open rep_struct.csv in a directory to paste the entirety of the SMILES strings list into the text field and submit.
- Evaluate pharmacokinetics and drug-likeness properties using the platform's color-coded scoring system and download the evaluation results as a .csv file for further analysis.
- Navigate to the SwissADME tool29.
- Click on GET STARTED under "ADMET Screening" and enter a list of SMILES.
- Paste the list of SMILES strings for all 50 molecules into the input field.
- Click on Run to compute bioavailability and permeability properties, including BBB penetration.
- Download the output as a .csv file for integration with other ADMET results.
- Download and install ToxTree30 (Toxic Hazard Estimation by a decision tree approach) compatible with the user's operating system.
- Open the software via the terminal using the command: sh Toxtree.sh
- Input the SMILES strings individually into ToxTree to classify toxicity based on Cramer’s rules.
- Export the results as a .csv file for integration with other ADMET data.
NOTE: Check that ADMETLab3 and SwissADME output CSVs match the number of ligands (n = 50) and that Toxtree results classify each compound under Cramer’s rules (I–III).
- After installing ORCA31, create a folder named stability in the working directory and subfolders for each molecule (for example, plk1_lig1, plk1_lig2, ..., plk1_lig50).
- Use Avogadro (Avogadro) to build each molecule from its SMILES string: Go to the Extensions tab and click Optimize Geometry to optimize the molecule. Generate ORCA input files via Extensions > ORCA > Generate ORCA Input and apply the following settings:
! B3LYP OPT FREQ def2-TZVP
%maxcore 4000
%pal
nprocs 1
end - Modify the downloaded .sh job file for each ligand to include unique job names and an email address. Afterwards, transfer the “stability” directory to a high-performance computing (HPC) system using the following commands:
ssh xsedeu0000@darwin.hpc.udel.edu
mkdir ~/4hco
scp -r /local/path/to/stability xsedeu0000@darwin.hpc.udel.edu:~/4hco - Execute the jobs through Simple Linux Utility for Resource Management (SLURM workload manager for HPC clusters) with a loop script:
for i in {1..50}; do
cd ~/4hco/stability/plk1_lig${i}
chmod +x job_lig${i}.sh
sbatch job_lig${i}.sh
done - After receiving job completion emails, navigate to the ligand folders and open output files to review data and note the HOMO and LUMO values:
cd ~/4hco/stability/plk1_lig1
nano lig1.out
- Use Avogadro (Avogadro) to build each molecule from its SMILES string: Go to the Extensions tab and click Optimize Geometry to optimize the molecule. Generate ORCA input files via Extensions > ORCA > Generate ORCA Input and apply the following settings:
6. Analysis of ADMET-S data
- Combine the physicochemical properties data derived from SwissADME bioavailability and permeability radar charts into a .csv file.
- Save the .csv file from SwissADME and name it “Physiochemical.csv.”
- Place the “Physiochemical.py” script (Supplemental File 1) in the same folder as “Physiochemical.csv” and run it.
- Apply the following criteria: nHD: 0–7, nHA: 0–12, nStereo: <2, LogP: 0–3, LogD: 1–3, LogS: –4 to 0.5, Fsp3: >0.41, and nHet: 1–15.
- Derive the absorption and distribution data from SwissADME.
- Snapshot and save the BOILED-Egg32 chart in SwissADME.
- Apply the following criteria: molecules must lie in the “egg” region and act as p-glycoprotein inhibitors, as the red points are preferred.
- Derive the metabolism data from ADMETlab3.0 for Cytochrome (CYP) substrate and inhibitors.
- Save .csv file from ADMETlab3.0 and name it “Metabolism.csv”.
- Edit the .csv file and only keep the columns of CYP-inh and CYP-sub.
- Place the “Metabolism.R” script (Supplemental File 1) in the same folder as “Metabolism.csv” and run it.
- Apply the following criteria: CYP p450 inhibitor and non-substrate as category 0 are preferred.
- Derive the excretion data from ADMETlab3.0 for plasma clearance and half-life.
- Save .csv file from ADMETlab3.0 and name it “Excretion.csv”.
- Edit the .csv file and only keep the columns of cl-plasma and t0.5.
- Place the “Excretion.py” script (Supplemental File 1) in the same folder as “Excretion.csv” and run it.
- Apply the following criteria: plasma clearance: 0.01–5 ml/min/kg.
- nToxicity data from Toxtree for the class of toxicity and ADMETlab3.0 for the number of toxicophores.
- Save .csv from ADMETlab3.0 and name it “Toxicity.csv.”
- Edit the .csv file, only keeping the column Toxicophore, and add a new column recording each ligand’s toxicity class from Toxtree.
- Place the “Toxicity.py” script (Supplemental File 1) in the same folder as “Toxicity.csv” and run it.
- Apply the following criterion: number of toxicophores to be 0–2.
- Derive the stability data from ORCA output files. The (“ORBITAL ENERGIES”, specifically the HUMO and LUMO energy values).
- Create an Excel chart recording each ligand’s HUMO and LUMO energies as separate columns.
- Add a new column calculating Band Gap (HUMO–LUMO = Band Gap).
- Save the Excel chart as “Stability.csv.”
- Place the “Stability.py” script (Supplemental File 1) in the same folder as “Stability.csv” and run it.
- Apply the following criteria: band gap difference to be between 3.6–5 eV.
Results
The target protein structure file protocol ensures the target protein file is optimized for analysis and structure-based docking. The resulting structure file, in PDB format, is free of missing residues and hydrogens, missing atom types, and unnecessary components such as water molecules and co-crystallized ligands. Figure 1A,B depict visual differences (visualized by Mol* Viewer33) in structures before and after preparation. If any residual formatting issues remain (like unrecognized atom names or incomplete residues), CB-Dock2 will typically issue an error upon upload. At which point, minor manual corrections, such as renaming HSD to HIS or removing nonstandard residues, can be applied before reattempting the docking step.
Figure 2 shows the results of clustering through principal component analysis (PCA) based on molecular fingerprinting and Tanimoto similarity. In the figure, each cluster is grouped by a gray-shaded oval containing similarly colored dots, which represent the molecules in those clusters. PCA components 1 and 2 on the axes provide a two-dimensional linear representation of the reduction from high-dimensional elements in Tanimoto matrices. In this study, Tanimoto similarity is used during the cluster sampling step to reduce redundancy and enhance chemical diversity among the 999 Lipinski-compliant natural products. By computing pairwise Tanimoto similarities using molecular fingerprints, the dataset is partitioned into 50 clusters of structurally related compounds. A single representative molecule is then selected from each cluster, ensuring that the final set of 50 ligands captures a wide chemical space while minimizing computational redundancy in downstream docking and ADMET-S analyses. This strategy enhances the efficiency and representativeness of virtual screening, particularly when working with large natural product libraries such as SuperNatural 3.0. (see Figure 2).
Optimal poses for each protein-ligand complex are simulated, accompanied by predicted affinities in the form of Vina scores among the five CurPocket poses of the PLK1 protein in CB-Dock2, considering van der Waals forces and hydrogen bonding. An example simulation of ligand 1 in Figure 3 shows the best binding to the second CurPocket pose (C2), with the lowest Vina score of –7.5 kcal/mol, compared to the other four top poses. Molecular docking with CB-Dock2 is done through a scoring function based on empirical parameters and a stochastic global optimization algorithm. CB-Dock2 has been rigorously validated and demonstrated superior performance compared to other state-of-the-art blind docking tools, making it an excellent choice for docking studies26,34. The server achieves a success rate of approximately 85% for binding pose prediction (RMSD <2 Å), outperforming popular tools, including the first CB-Dock version, SwissDock, COACH-D, and MTiAutoDock34. This high accuracy is attributed to CB-Dock2's innovative integration of two complementary docking schemes: structure-based and template-based approaches.
Figure 4 illustrates a heatmap of average predicted affinities for each protein-ligand combination using PRODIGY web server predicted affinities. Higher affinities, signified by lower molar energies (kcal/mol) and greener heatmap tints, are favorable binding affinities. In contrast, lower affinities, signified by higher molar energies and redder heatmap tints, are less favorable. From a selectivity standpoint, it is ideal to have compounds with favorable affinities for the target protein (PLK1) relative to homologs (PLK2–3). For instance, ligand 27 is a selective PLK1-PBD ligand relative to ligand 45, which shows similar affinities across all three proteins. Although hits 3, 5, 6, 7, 27, 28, 34, 35 and 49 show higher affinity for PLK1-PBD than PLK2/3, they are chemically diverse in 2D fingerprint space (mean ECFP4 Tanimoto ≈ 0.135, no pair ≥ 0.50), suggesting that any broader specificity is likely driven by conserved PBD pocket geometry and shared 3D pharmacophore/interaction patterns rather than scaffold identity. Recommendations include interaction-fingerprint comparison and pharmacophore mapping to identify the structural determinants of PLK1-PBD recognition.
The results of the physicochemical property assessment are shown in a Radar chart (Figure 5). The properties assessed include atomic interactions, solubility, and bioavailability. Some compounds stand out for their more desirable physicochemical properties with the acceptable ranges: nHD = 0–7, nHA = 0–12, nStereo < 2, LogP = 0–3, LogD = 1–3, LogS = –4 to 0.5, Fsp3 > 0.41, and nHet = 1–15. This radar chart provides a comprehensive, multi-dimensional visualization of the physicochemical properties for the 50 representative ligands identified in the computational screening workflow. It is designed to assess how well each compound adheres to the predefined "drug-like" criteria by plotting its properties against established lower and upper limits. The chart displays ten key molecular descriptors arranged around the polar axis, including pKa acidic and pKa basic. The shaded area between the green polygon (Lower Limit) and the blue polygon (Upper Limit) marked the ideal or acceptable range for each property, based on the thresholds provided in the protocol. The upper and lower limits of pKa acid (2–12 and pKa base (3–10) were assigned based on literature reviews35,36,37, since there is no single upper and lower limit for pKa in drug discovery. Each colored line represents one of the 50 ligands. The shape formed by connecting the data points for a single ligand shows its profile across the selected ten properties simultaneously. The vast majority of the 50 ligands fall within or very close to the acceptable region defined by the green and blue polygons. This indicates that the initial filtering steps, particularly the application of Lipinski's Rule of Five and the clustering based on Tanimoto similarity, were highly effective at enriching the dataset with molecules possessing favorable drug-like properties. The depiction of the full range of documented values for all parameters is recommended.
Figure 6A–C depicts components of ADME data from ADMETlab3.0 and SwissADME. Starting with absorption and distribution, the BOILED-Egg model38 in Figure 6A from SwissADME represents the drugs’ absorption and distribution via lipophilicity and permeability, as indicated by the yellow and white ellipses in the graph. It includes P-gp substrates and inhibitors, represented by blue and red points, respectively, where inhibiting P-gp is crucial for higher absorption rates. In Figure 6B, the metabolism heatmap visualizes the inhibition and substrate of approximately 7 varieties of CYP cytochrome p450 enzymes. The desired outcome for the ligands is to serve as CYP non-inhibitors and non-substrates (green), with preferred results confirming a safe drug safety profile with no/low drug-drug interactions. Figure 6C represents excretion data of the drug’s clearance and half-life. Excretion may be distinguished by the optimal plasma clearance (<5 mL/min/kg). The drug half-life for all anticancer drugs depends on the drug's mechanism of action, toxicity, and target. The ideal half-life balances maintaining drug concentrations within a therapeutic window while minimizing toxicity and allowing convenient dosing schedules39,40.
The combination of two types of toxicity evaluations is depicted. In Figure 7A, the number of toxicophores identified by ADMETlab3.0 is shown for each ligand. There is no definite threshold or information on the acceptable ranges of toxicophores. In Figure 7B, the application of Toxtree provides information related to toxicity class (I-III) as well as Cramer’s Rule violations and adherence. The sample result for ligand 1 shows the toxicity results and its SMILES code at the top bar, with the structure in the bottom-left window. The class toxicity identification in the top-right window indicates high toxicity (Class III) based on Cramer’s Rules for ligand 1, rather than other possibilities such as Class II (mid toxicity) or Class I (low toxicity). The bottom right window shows the written reasoning of class identification based on Cramer’s Rule decision tree.
ORCA QM calculations of vibrational frequency for optimized structures calculate orbital energy values for the determination of the band gap. Figure 8 depicts the band gap (eV) of each ligand derived from the difference between the HOMO and LUMO. The threshold range is represented in the shaded region between 3.6 eV and 5.0 eV, where each point in the shaded region satisfies the energy levels associated with a more desirable stability and reactivity. An overview of the entire computational workflow is summarized in Figure 9, which illustrates the sequential stages from target protein preparation and natural product database screening to ADMET-S evaluation, designed to identify selective PLK1-PBD inhibitors while ensuring drug-like properties and chemical stability. This visual roadmap underscores the protocol’s modularity, accessibility, and suitability for educational implementation.
Table 1 operationalizes the protocol by transforming it from a linear sequence of instructions into a robust, error-aware pipeline suitable for classroom and independent research use. It explicitly addresses reproducibility, a known challenge in computational drug discovery, by embedding validation criteria at key transition points. For example, confirming that histidine residues are uniformly labeled as “HIS” after CHARMM-GUI processing prevents silent failures in downstream docking, while validating SMILES integrity before clustering avoids cascading errors in ADMET prediction. The table also highlights pedagogical design, with each troubleshooting tip actionable with minimal computational background (for instance, “open .complex.pdb in a text editor to check chain IDs”), aligning with the manuscript’s goal of accessibility for Deaf, undergraduate/graduate, and high school learners. Moreover, by flagging steps where outcomes disproportionately affect results, such as selectivity assessment via comparative PRODIGY scoring, the table helps users prioritize attention and resources.
A key strength of this integrated workflow is its ability to expose discrepancies among complementary computational predictions, revealing edge cases that underscore the limitations of any single method. For example, ligand 5 for PLK1-PBD exhibited a strong CB-Dock2 Vina score (−7.9 kcal/mol) and favorable PRODIGY affinity (ΔG = −9 kcal/mol, Figure 4) yet failed several ADMET filters. It did not conform to the BOILED-Egg absorption-distribution model, depicted a less desirable plasma clearance value (9.3 mL/min/kg, Figure 6), suggesting rapid elimination, and was classified as Cramer Class III (high toxicity) by Toxtree containing five toxicophores (Figure 7A). Conversely, ligand 33 displayed a moderate PRODIGY-predicted PLK1 affinity (−5.4 kcal/mol) but met all ADMET criteria, showing low toxicity (Class I), optimal LogP (0.7), and favorable absorption-distribution and plasma clearance. Despite its weaker affinity, ligand 33 is a more drug-like candidate. This contrast illustrates a fundamental principle in early-stage drug discovery: high binding affinity alone is insufficient without favorable pharmacokinetics and safety. At the same time, compounds such as ligand 5, though with poor ADMET performance, may still provide valuable scaffold ideas for future optimization to improve safety or metabolic stability without compromising potency.
Although early filters in this workflow are intended for triage and prioritization, not permanent exclusion, further streamlining of the 50 candidates designates some as “top hits” by applying desirable limits available from ADMET tools and the literature. From the 50 screened ligands evaluated across 114 ADMET-related and electronic descriptors, 13 satisfied at least 95 of the desirable property criteria. Among these, six compounds (10, 13, 14, 32, 43, and 47) demonstrated both favorable ADMET-S profiles and higher binding affinities for PLK1-PBD than PLK2/3 and are therefore designated as the top candidate inhibitors (Figure 10). The comparative structural-functional and quantitative similarity analyses revealed that the identified hits share key pharmacophoric features with known PLK1-PBD inhibitors, suggesting potential convergence in binding behavior. All hits contained aromatic or heteroaromatic scaffolds that mirror the hydrophobic ring systems of TQ, Poloxin, and Allopole-A, enabling π–π and hydrophobic interactions within the PBD pocket. Functional overlap was evident through conserved hydrogen-bonding motifs (carboxyl, amide, and carbonyl groups) analogous to those mediating key polar contacts in the reference inhibitors. Flexible aliphatic and cyclic linkers present in several hits parallel the conformational adaptability of Poloxin analogs, facilitating orientation toward essential binding residues. Quantitatively, Tanimoto similarity scores (0.36–0.54) confirmed moderate structural resemblance between the hits and known inhibitors, with Hits 10, 13, and 14 most similar to Poloxin, Hit 32 to TQ, and Hits 43 and 47 to Allopole-A. Collectively, these results highlight a clear structural and functional overlap, indicating that the hits likely mimic the binding topology and interaction patterns of validated PLK1-PBD inhibitors while retaining sufficient novelty for further optimization (Figure 10).
To evaluate the robustness of the computational workflow, known PLK1-PBD inhibitors (Poloxinpan14 and Allopole-A15) were analyzed as positive controls, with Metformin and Imeglimin (two structurally unrelated antidiabetic agents with no reported PLK1-PBD activity) as negative controls across ADMET-S, docking, and binding affinity analyses. The positive controls exhibited binding affinities of –5.8 and –5.6 kcal/mol, respectively, whereas the negative controls showed weaker affinities of –5.1 kcal/mol (Metformin) and –4.8 kcal/mol (Imeglimin), consistent with their lack of PBD-binding activity. Interestingly, ADMET-S evaluation revealed that the negative controls met more desirable descriptors (88 of 114 properties) than the positive controls (80 of 114), thereby validating the workflow’s ability to distinguish pharmacokinetic favorability from target-specific binding potential. These bindings reinforce the importance of maintaining a balanced perspective: compounds should not be prematurely discarded solely on the basis of suboptimal ADMET predictions if they exhibit strong target affinity, as such scaffolds may still offer valuable starting points for optimization. Conversely, molecules with excellent pharmacokinetic properties but weak binding may serve as low-risk templates for analog development. Further biochemical and cellular validation is warranted to confirm these computational observations and refine prioritization criteria.
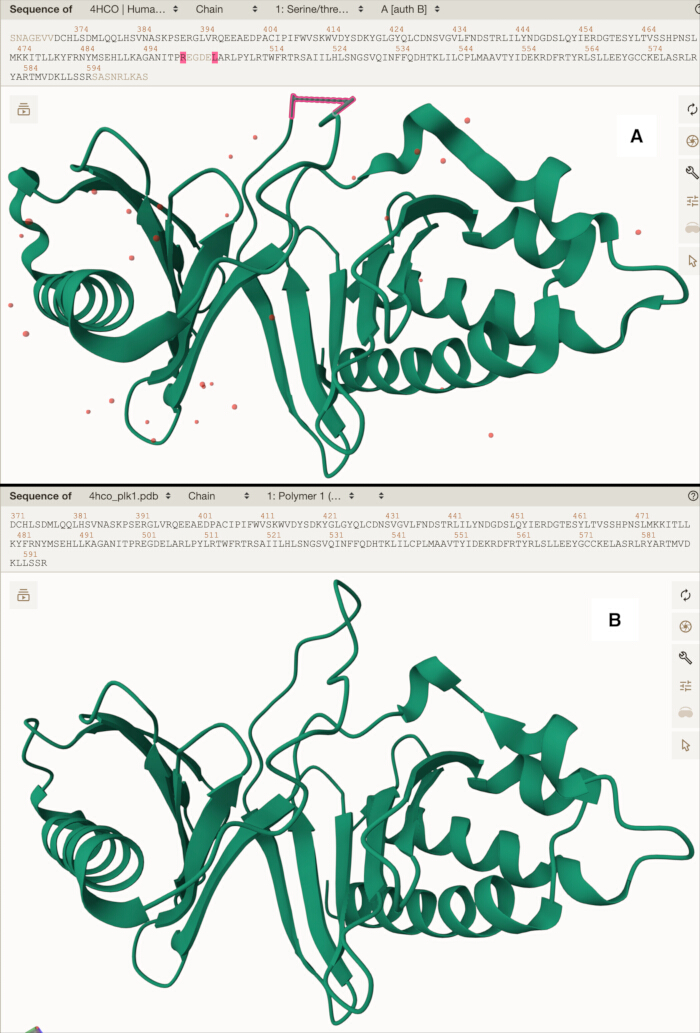
Figure 1: Structural comparisons between an unprepared and a CHARMM-GUI prepared 4HCO structure. (A) 4HCO structure uploaded directly from the PDB, highlighting the missing residues. (B) 4HCO structure after CHARMM-GUI preparation protocol. 4HCO (PLK1-PBD bound to TQ) was selected because it is among the few PLK1-PBD crystals with an organic ligand bound, making it directly applicable to this structure-based small-molecule inhibitor discovery. Please click here to view a larger version of this figure.
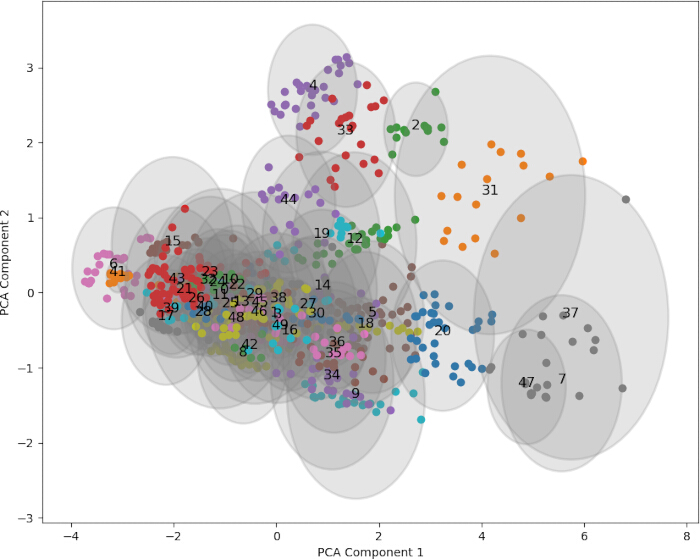
Figure 2: Principal component analysis (PCA) of 999 Lipinski-compliant natural products following K‑means clustering based on molecular fingerprinting and Tanimoto similarity. Each dot represents a compound, colored by its assigned cluster (1–50), with clusters grouped by gray ellipses to emphasize chemical similarity. The tight clustering within clusters and the separation between clusters indicate that Tanimoto-based clustering successfully reduced structural redundancy while preserving chemical diversity across the dataset. This diversity ensures that the 50 representative ligands selected for downstream docking span a broad region of chemical space, enhancing the robustness and generalizability of the virtual screening results. Please click here to view a larger version of this figure.
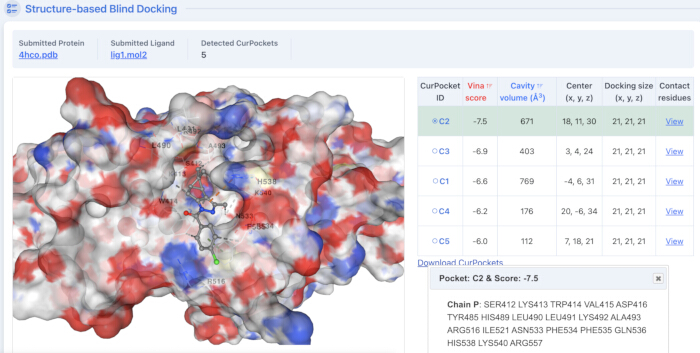
Figure 3: CB-Dock2 blind docking identifies a high-affinity binding pose of ligand 1 within the PLK1 polo-box domain (PBD). The displayed CurPocket C2 conformation (Vina score = −7.5 kcal/mol) represents the optimal pose among five predicted binding sites, characterized by favorable van der Waals contacts and hydrogen bonding with key PBD residues (Trp414, His538, and Lys540). This result validates the use of structure-based blind docking to locate biologically relevant binding pockets in the absence of a co-crystallized ligand, demonstrating how the workflow prioritizes poses with the strongest predicted binding energy for downstream selectivity analysis. Please click here to view a larger version of this figure.
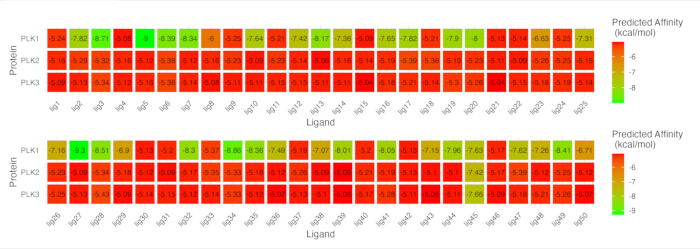
Figure 4: Heatmap of PRODIGY web server predicted affinities by protein-ligand combinations. The heatmap directly addresses the overlap among ligands when bound to PLK1, PLK2, and PLK3. While some ligands (including ligand 45) show comparable binding affinities across all three PLK isoforms, suggesting poor selectivity, others (notably ligands 3, 5, 6, 7, 27, 28, 34, 35, and 49) exhibit strong PLK1 preference (ΔΔG ≥ 3.0 kcal/mol vs. PLK2/PLK3), which aligns with the goal of PBD-selective inhibition. Quantitatively, 20 of the 50 ligands display almost 2-fold selectivity for PLK1 over both PLK2 and PLK3 based on PRODIGY-predicted ΔG values. This differential binding is attributed to subtle variations in the PBD binding pockets, which the blind docking protocol captures. Please click here to view a larger version of this figure.
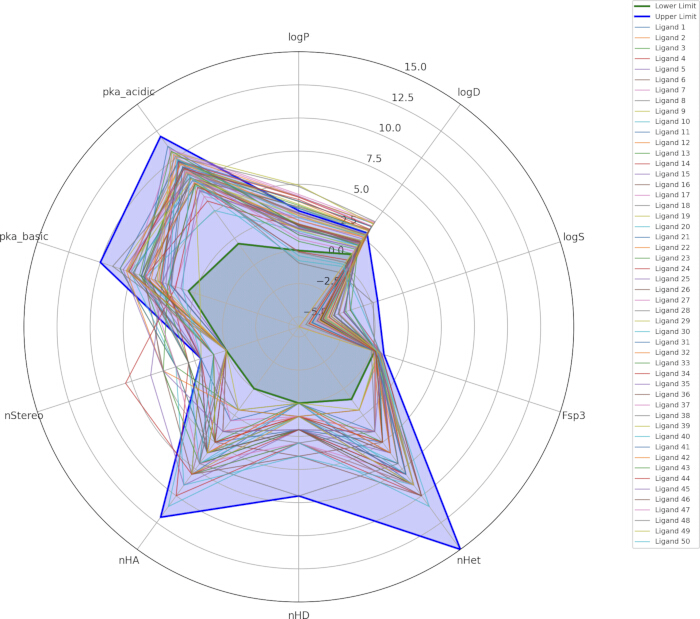
Figure 5: Representation of physicochemical properties combined from ADMETlab3.0 and SwissADME. The parameters are nHD = number of Hydrogen Donors, nHA = number of Hydrogen Acceptors, basic pKa, acidic pKa, nStereo = number of Stereocenters, LogP = n-octanol/water distribution coefficient, LogD = n-octanol/water distribution coefficient at pH=7.4, LogS = aqueous solubility value, Fsp3 = the number of sp3 hybridized carbons/total carbon count, and nHet = number of Heteroatoms. Please click here to view a larger version of this figure.
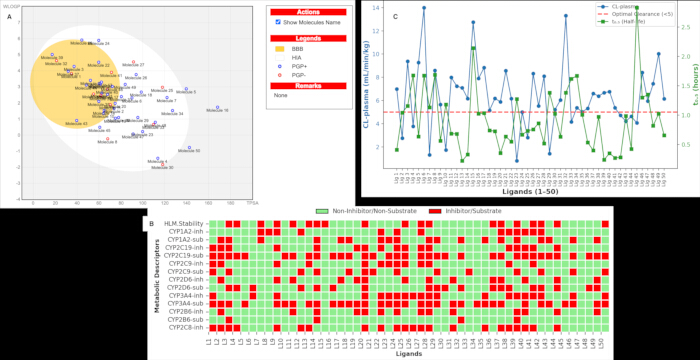
Figure 6: A combination of ADME results from ADMETlab3.0 and SwissADME. (A) BOILED-Egg chart of Wildman-Crippin LogP (WLOGP) vs. Topological Polar Surface Area (TPSA) from SwissADME representing Absorption and Distribution Blood-Brain Barrier (BBB) permeability in the yellow (yolk) region, absorption through the gastrointestinal tract (HIA) in the white ellipse, P-glycoprotein substrates and non-substrates in blue and red points respectively. Molecules that lie outside of the “egg” are considered to have poor absorption and distribution. (B) Heat map of metabolism with various Cytochrome P450 (CYPs) identifiers involving Human Liver Metabolism (HLM) stability, where red serves as inhibitors/substrates and green serves as non-inhibitors/non-substrates, leaving green as the desirability. (C) Excretion involves the parameters, plasma clearance, and half-life. The dotted red line indicates desirable plasma clearance (<5 mL/min/kg), while 5-15 mL/min/kg and >15 mL/min/kg denote moderate and high clearance, respectively. Please click here to view a larger version of this figure.
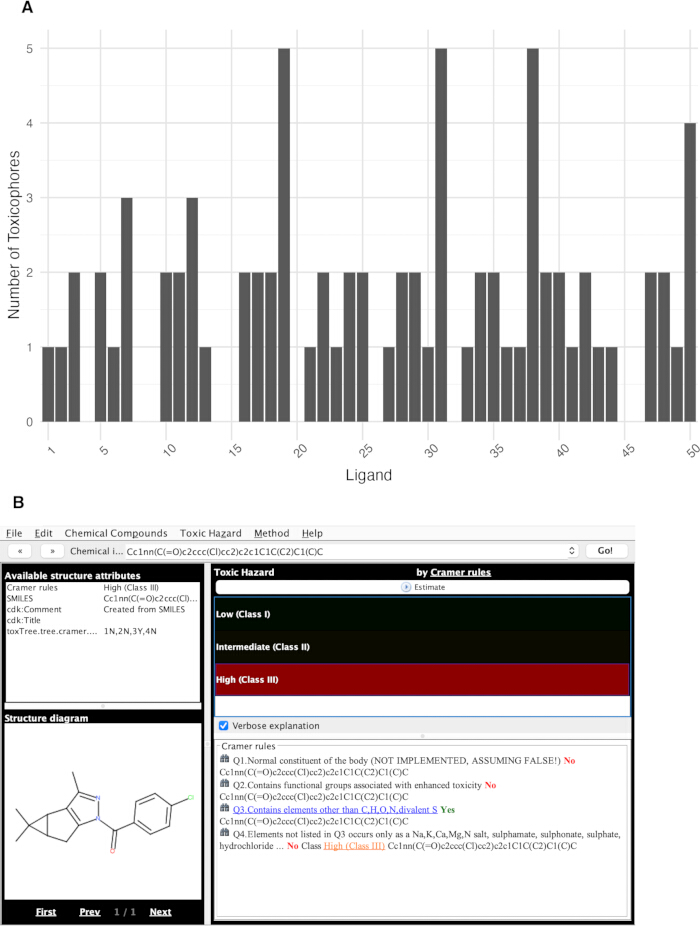
Figure 7: Integrated toxicity profiling reveals critical safety liabilities among screened ligands. (A) Distribution of toxicophore counts across the 50 representative natural products, as predicted by ADMETlab3.0. (B) Sample toxicity results for ligand 1, indicating Class III toxicity highlighted in red, with a verbose explanation of related Cramer’s Rules listed in the text box below. This dual-evaluation approach (toxicophores + Cramer class) enables early triage of high-risk compounds. Please click here to view a larger version of this figure.
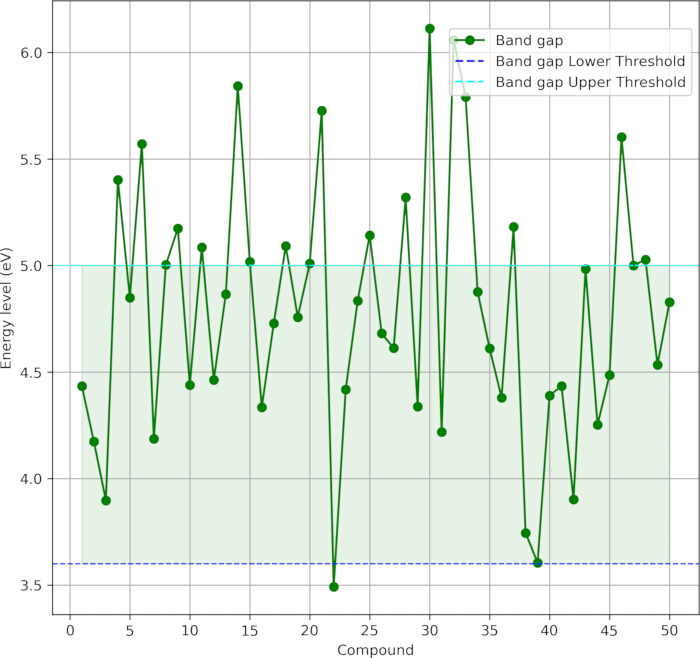
Figure 8: HOMO–LUMO band gap energies (in eV) for the 50 representative natural product-derived ligands, calculated using ORCA at the B3LYP/def2-TZVP level of theory. The shaded region (3.6 to 5.0 eV) denotes the optimal stability window: band gaps below 3.6 eV suggest high chemical reactivity or potential photodegradation, while values above 5.0 eV may indicate poor electronic polarizability and reduced binding adaptability. Ligands falling within this range exhibit a favorable balance of kinetic stability and molecular responsiveness, supporting their prioritization as potential PLK1-PBD inhibitor candidates. Please click here to view a larger version of this figure.
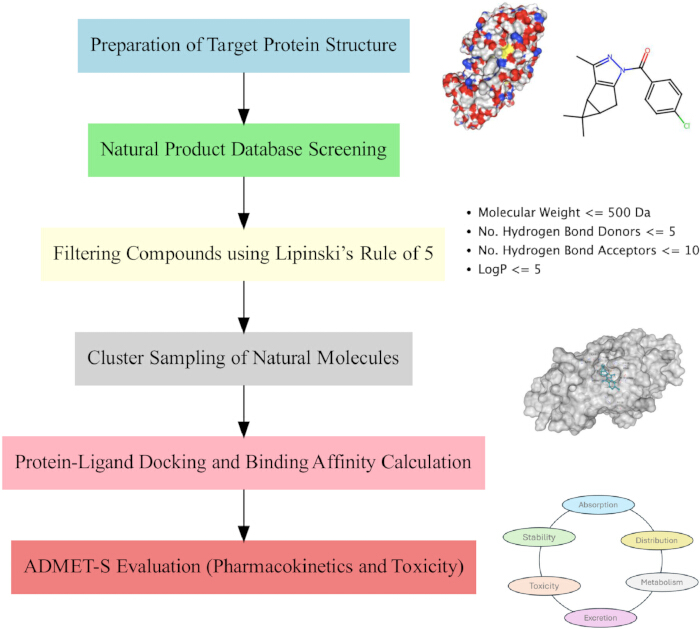
Figure 9: Flowchart of the bilingual computational drug discovery workflow. The pipeline begins with preparation of PLK1-PLK3 PBD structures, followed by disease-focused screening of the SuperNatural 3.0 database and filtering via Lipinski’s Rule of Five (molecular weight ≤ 500 Da, hydrogen bond donors ≤ 5, acceptors ≤ 10, LogP ≤ 5). Representative compounds are selected after clustering and then evaluated through protein-ligand docking, binding affinity prediction, and comprehensive ADMET-S profiling, including absorption, distribution, metabolism, excretion, toxicity, and QM stability assessment. Please click here to view a larger version of this figure.
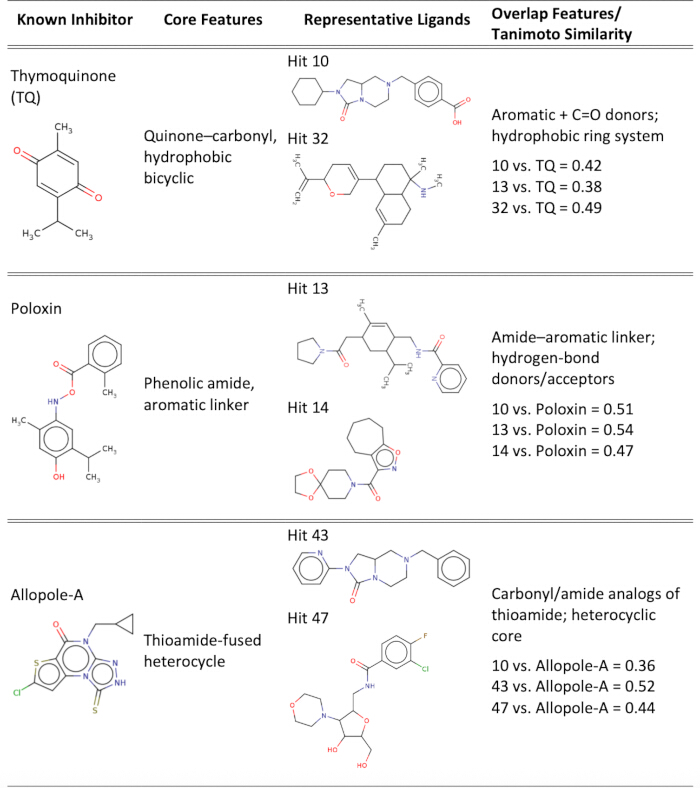
Figure 10: Comparative structural-functional overlap between top candidate ligands and known PLK1-PBD inhibitors. The figure highlights the six top candidate compounds (10, 13, 14, 32, 43, and 47) identified from the combined virtual screening, clustering, binding affinity, and ADMET-S profiling analyses. These ligands satisfied at least 95 of 114 desirable physicochemical and pharmacokinetic descriptors and exhibited higher binding affinities for PLK1-PBD relative to PLK2/3. To evaluate potential structural and functional convergence, each ligand was compared with known PLK1-PBD inhibitors TQ, Poloxin, and Allopole-A, based on shared core pharmacophoric motifs and pairwise Tanimoto similarity coefficients (ECFP4 fingerprints). Moderate similarity scores (0.36–0.54) and common functional groups such as aromatic or heteroaromatic rings, hydrogen-bond donor/acceptor pairs, and hydrophobic linkers indicate partial overlap in binding features. Please click here to view a larger version of this figure.
| Workflow stage | Intermediate checkpoint (how to confirm success) | Critical step (why it determines success/failure) | Common issues & troubleshooting guidance |
| 1. Target Protein Preparation | • PDB file loads without errors in Mol* View. • No missing residues in the binding pocket (visual inspection). • Histidine residues labeled as “HIS” (not HSD/HSE) | Inaccurate protein structure → false binding pockets → misleading docking poses. CHARMM-GUI ensures correct protonation, hydrogen placement, and removal of waters/ligands. | Issue: CB-Dock2 rejects the PDB file. Fix: Remove non-standard residues, ensure only the protein chain is present, and standardize atom/residue names using a text editor. |
| 2. Natural Product Filtering (Lipinski’s Rule of 5) | • “all.csv” contains only valid SMILES (non-blank, chemically parseable). • Count matches expected (e.g., 999/1,193). | Invalid SMILES crashes RDKit, docking servers, and ADMET tools. Filtering must preserve chemical validity. | Issue: Script fails during clustering. Fix: Add SMILES validation using Chem.MolFromSmiles(smiles, sanitize=True) in Python; log and remove invalid entries before proceeding. |
| 3. Cluster Sampling | • 50 unique SMILES in “rep_struct.txt”. • PCA plot (Fig. 2) shows clear cluster separation. | Poor clustering → redundant or non-diverse representatives → inefficient screening. | Issue: All molecules cluster into one group. Fix: Verify fingerprint type (e.g., Morgan/ECFP4), Tanimoto threshold, and SMILES standardization. Consider increasing cluster count if diversity is low. |
| 4. Protein-Ligand Docking (CB-Dock2) | • Each ligand returns ≥1 “.complex.pdb” file. • Vina scores are negative (e.g., ≤ −5 kcal/mol). • Ligand is positioned in CurPocket (not surface). | Docking defines binding pose and affinity. Incorrect pose → false PRODIGY predictions. | Issue: Job fails, or ligand not docked. Fix: Re-draw ligand in CB-Dock2 using SMILES; ensure no special characters in filename; verify email for job status. If persistent, try SwissDock as a backup. |
| 5. Binding Affinity (PRODIGY) | • PRODIGY returns ΔG values for all complexes. • Affinities correlate with CB-Dock (Vina) scores (trend consistency). | Selectivity assessment hinges on accurate ΔG for PLK1 vs. PLK2/PLK3. Misassigned chain/ligand IDs → wrong predictions. | Issue: “Chain not found” error. Fix: Open .complex.pdb in a text editor; confirm protein chain ID (e.g., “P”) and ligand residue name (e.g., “UNL”); input correctly in PRODIGY. |
| 6. ADMET-S Evaluation | • All 50 SMILES return results in SwissADME, ADMETlab3.0, and ToxTree. • No “N/A” or “Error” rows in output CSVs. | Inconsistent ADMET data → flawed candidate ranking. Platforms may fail on exotic natural product scaffolds. | Issue: ADMETlab3.0 rejects SMILES. Fix: Canonicalize SMILES using RDKit (MolToSmiles(MolFromSmiles(...))). For ToxTree, input one molecule at a time and verify the structure rendering. |
| 7. Quantum Stability (ORCA) | • Each ORCA job completes without “SCF not converged” or “geometry error”. • HOMO/LUMO values present in output (.out) file. | Band gap determines chemical stability/reactivity. Failed jobs = missing data for key filter. | Issue: ORCA job crashes. Fix: Re-optimize geometry in Avogadro; ensure no duplicate atoms; increase %maxcore or switch to def2-SVP basis for large molecules. |
| 8. Integrated ADMET-S Filtering | • Final list of ligands satisfies all criteria (e.g., LogP 0–3, band gap 3.6–5 eV, Cramer Class I/II). • ≥1 ligand shows PLK1 selectivity (ΔΔG ≥ 2 kcal/mol vs. PLK2/3). | Overly strict or inconsistent thresholds eliminate viable leads; too lenient thresholds advance toxic/unstable compounds. | Issue: No ligands pass all filters. Fix: Relax one criterion at a time (e.g., allow LogP ≤ 4 or 3 toxicophores) and document trade-offs. Compare to known drugs for benchmarking. |
Table 1: Critical quality control checkpoints, high-impact decision points, and troubleshooting strategies across the eight-stage bilingual computational workflow for identifying selective PLK1-PBD inhibitors. Each row corresponds to a major protocol phase from protein preparation to integrated ADMET-S filtering and specifies (i) how to verify successful completion (intermediate checkpoint), (ii) why the step is pivotal to overall success or failure (critical step rationale), and (iii) practical solutions to common technical failures (troubleshooting guidance). This table serves as both a validation roadmap and a teaching aid for students and researchers implementing the protocol in academic or resource-constrained settings.
Supplemental File 1: Python scripts. Contains the Python script for Lipinski rule application; the Python script used for clustering analysis; the Python script for physicochemical property calculations; the R script for metabolism analysis; the Python script for excretion analysis; the Python script for toxicity prediction; the Python script for stability assessment; and the SMILES strings of the 50 analyzed compounds. Please click here to download this file.
Discussion
This study focuses on an exploratory computational workflow to identify and evaluate potential PLK1-PBD inhibitors through virtual screening, docking, and ADMET-S analysis. The pipeline effectively prioritizes compounds based on predicted binding trends and pharmacokinetic properties. In this protocol, a set of possible PLK1 inhibitors is identified, and their ADMET properties and binding affinities for PLK1–3 proteins are evaluated. The protocol uses a disease-focused approach to identify 50 molecules from a database of approximately 73,400 (Figure 9). Then, these 50 molecules were subjected to ADMET-S evaluation, during which their pharmacokinetic and pharmacodynamic properties, drug-likeness, and stability were calculated. In addition, their binding affinity for PLK1–3 proteins was calculated to assess their inhibitory potency against PLK1 and selectivity. Based on the results, several molecules showed more desirable properties. Subsequent drug discovery studies may choose to eliminate some molecules and focus on a few from this exploration, or may refrain from early elimination and use these results later in the drug design process to optimize ADMET properties.
The biological rationale for focusing on PLK1, PLK2, and PLK3 while excluding PLK4 and PLK5 is grounded in both structural and functional considerations. PLK4 and PLK5 are excluded from this work due to their distinct structural and functional differences from PLK1 and their limited relevance to cancer therapy. PLK1, characterized by its kinase domain and polo-box domain (PBD), plays a critical role in regulating mitotic events, making it a key target for cancer treatment41. In contrast, PLK4 and PLK5 are structurally divergent: PLK4 contains a cryptic polo-box (CPB) rather than a canonical PBD and functions primarily in centriole duplication. At the same time, PLK5 lacks a functional kinase domain and is expressed almost exclusively in the brain3. Given their minimal structural overlap with PLK1-PBD and limited relevance to mitotic dysregulation in cancer, their inclusion would not meaningfully inform selectivity for PLK1-PBD inhibitors. Thus, the screening strategy offers a biologically relevant and computationally tractable framework for assessing selectivity. Importantly, the six top candidate ligands (10, 13, 14, 32, 43, and 47) displayed even more favorable binding energies and ADMET-S profiles than the known inhibitors TQ and Allopole-A, highlighting them as potential PLK1-PBD modulators.
To support robust implementation, particularly by students or researchers new to computational drug discovery tools, a summary of key checkpoints (also in the Protocol section), critical steps, and troubleshooting guidance for the workflow is provided in Table 1. The Table supports adaptability; for example, if a user lacks HPC access, they can note that ORCA stability analysis is deferrable, and if a web server is down, alternatives like SwissDock are suggested. This flexibility ensures the workflow remains viable across diverse institutional contexts while maintaining scientific rigor and reinforcing the study’s novelty as an inclusive, bilingual, and education-oriented contribution to early-stage drug discovery. Although the entire workflow is designed as an integrated pipeline, several crucial steps fundamentally determine its success or failure (see Table 1). Also, the accompanying video features synchronized English captions and an American Sign Language (ASL) signer, designed to provide equitable access without distraction. The signer’s instructions are temporally aligned with on-screen actions, for example, signing “next,” then pausing as the cursor clicks the “Next” button. During the 4HCO preparation step, the signer uses finger labeling (“A” and “B”) to guide chain selection, mirrored precisely in the screen recording. In the SuperNatural 3.0 screening segment, the signer’s window resizes and moves to the upper right while directing attention to the “pathway” icon, pausing as the cursor follows. These design choices ensure Deaf and hard-of-hearing viewers receive the same integrated, real-time guidance as hearing users, effectively replicating an in-person, instructor-led lab experience.
Besides the benefits, there are numerous ways to improve the workflow. First, initial filtering can be modified; instead of disease-focused and cluster sampling methods, one could start with docking simulations of all molecules in the natural product database to identify which compounds are best suited for ligand-target protein binding. In addition, more detailed estimates are necessary for accurate prediction of binding affinity. PRODIGY’s “no electrostatic” calculations of protein-ligand affinity involve fitting the counts of categorized types of atomic contacts involved in the interaction (Carbon-Carbon, Nitrogen-Nitrogen, Oxygen-Oxygen, and other atoms) in a trained multiple linear regression model with 4-fold cross-validation, and this method correlated significantly with experimental affinities on various occasions42,43. Alternative approaches, such as FoldX44, fastDRH45, deep learning models46, and MD with advanced sampling, can be employed, and varying degrees of agreement in predictions are expected depending on the accuracy of each method47.
Another aspect is that the various software tools used in the ADMET-S evaluation generate numerous metrics, and comprehending each metric used to assess drug candidacy is vital. One way to ensure accuracy could be to subject several drugs on the market to the protocol to determine how they meet the thresholds. In that context, toxicity requires further research, as molecules are not discarded solely on the basis of toxicity profiles from nuanced decision trees such as Cramer’s Rules, as many medications available for use carry similar classifications. The number of toxicophores is also not completely informative on toxicity, even in conjunction with toxicity profiles. In this context, an extension of this workflow would be to perform comparative reviews of small-molecule samples with available medications to inform interpretations. For instance, researchers referred to previous literature documenting the application and observations of DFT calculations in current breast cancer drugs such as Tamoxifen48, Letrozole49, and Cisplatin50when interpreting stability determined by QM calculations of HOMO–LUMO band gap values. Previously, similar workflows have been adopted to identify potential inhibitors for various disease/disorder targets51. Lately, Stafford et al.6 reviewed PLK1-PBD inhibitor design strategies and therapeutic opportunities in cancer. Most recent studies have identified dual-targeting inhibitors against PLK1-PBD and PLK4-PB3 using structure-guided pharmacophore modeling, virtual screening, molecular docking, molecular dynamics (MD) simulation, and biological evaluation52. Zhou et al. also identified PLK1-PBD inhibitors from the marine natural products library using 3D QSAR pharmacophore, ADMET, scaffold hopping, molecular docking, and MD53.
Overall, the novelty of this study is fourfold. First, it is a bilingual computational protocol, delivered in both American Sign Language and English, thereby advancing accessibility and inclusion in STEM, particularly for Deaf and Hard-of-Hearing students and researchers. This bilingual delivery is rare in computational drug discovery and aligns with Gallaudet University’s mission to pioneer equitable scientific education. Second, while PLK1 remains a compelling anticancer target, rigorous computational studies evaluating selectivity across PLK1, PLK2, and PLK3 using integrated structural, energetic, and ADMET-S criteria are scarce. Most prior efforts focus solely on kinase-domain inhibition or lack comparative selectivity profiling. This work addresses this gap by providing an initial, exploratory concurrent screening protocol against three PLK-PBDs, with filters that prioritize compounds based on high PLK1 affinity and minimal off-target binding. Third, the workflow was designed with efficiency and usability in mind, particularly for educational and resource-limited settings. The entire pipeline from database filtering to ADMET-S evaluation can be completed within two weeks on standard academic hardware (a laptop with 8 GB RAM), leveraging free web-based software (CB-Dock2, PRODIGY, SwissADME, ADMETlab). Docking and binding affinity calculations are not time-intensive steps (~30 secs per ligand). The most time-intensive step is the QM stability analysis with ORCA, which can be deferred to later stages or run on high-performance computing resources, as demonstrated. The scripts are modular and require only basic command-line or Jupyter Notebook edits, enabling seamless integration into existing curricula. Runtime is modest with database filtering and Lipinski compliance taking minutes; clustering of ~1,000 molecules completes in under 30 min on a typical desktop. All software tools are freely available for academic use, cross-platform (Windows, macOS, Linux), and do not require commercial licenses, dramatically lowering barriers to entry. Fourth, the identified ligands demonstrate promising binding affinities consistent with nanomolar-range interactions, coupled with favorable drug-likeness, metabolic stability, and low toxicity profiles. Several candidates emerge as strong, selective PLK1-PBD binders with desirable ADMET-S properties, warranting further validation via molecular dynamics simulations or in vitro assays.
Therefore, beyond its methodological utility, this study exemplifies how accessible, open-source, and efficient computational tools can be harnessed as a starting point to address a high-value biomedical challenge while fostering inclusive scientific training. As PLK1-PBD inhibitors continue to gain traction in oncology, this workflow provides a reproducible, education-friendly blueprint for early-stage drug discovery. Its versatility makes it suitable for high school, undergraduate, and graduate settings, and it provides an excellent foundation for CUREs that offer students authentic, hands-on research opportunities. Unlike pipelines relying solely on kinase-domain docking or single-protein screening, the approach concurrently evaluates PBD selectivity across PLK1–3, a necessity given their >38% structural homology and divergent biological roles. Moreover, by combining clustering, ADMET-S, and QM stability in an open-access framework, redundancy and attrition risk were reduced relative to brute-force virtual screening.
Disclosures
The authors declare no competing interests.
Acknowledgements
This research was supported by funding from the National Institute of General Medical Sciences, National Institutes of Health (1R15GM148942-01), National Library of Medicine (R25LM014208), and a Momentum Grant from the University of Pittsburgh. This work used DARWIN at Udel (darwin.hpc.udel.edu) through allocation [MED230016] from the Advanced Cyberinfrastructure Coordination Ecosystem: Services & Support (ACCESS) program supported by National Science Foundation grants #2138259, #2138286, #2138307, #2137603, and #2138296.
Materials
| Name | Company | Catalog Number | Comments |
|---|---|---|---|
| ADMETLab3 | Simulations Plus. Inc | V3.0 | ADMET properties |
| Alphafold | Google DeepMind & Isomorphic Labs (Alphabet subsidiaries) | V3.0.1 | 3D Protein modeling |
| Anaconda/Conda | Anaconda, Inc. | V24.9.2 | Open source package management system |
| CB-Dock2 | Yang Cao Lab | V2.0 | Protein-ligand blind docking |
| CHARMM-GUI | Lehigh University | V3.8 | Biomolecular manipulation and simulation |
| DARWIN on ACCESS | University of Delaware | N/A | High performance computing |
| ORCA | FAccTs GmbH | V6.1.0 | Quantum chemistry package |
| Protein Data Bank | Worldwide Protein Data Bank | RRID:SCR_006555 | Protein database |
| RDKit | Open source | RRID:SCR_014274 | Cheminformatics programming |
| SuperNatural 3.0 | Institute of Physiology and Science-IT (Berlin) | V3.0 | Natural molecules library |
| SwissADME | Swiss Institute of Bioinformatics | RRID:SCR_017865 | ADME properties |
| Toxtree | Ideaconsult Ltd | V3.1.0 | Toxicity classification |
References
- Eckerdt, F., Yuan, J., Strebhardt, K. Polo-like kinases and oncogenesis. Oncogene. 24 (2), 267-276 (2005).
- Dube, D. Polo-like kinases: An antimitotic drug target for cancer therapy. Protein Kinase Inhib. 2022, 457-477 (2022).
- de Cárcer, G., Manning, G., Malumbres, M. From PLK1 to PLK5: Functional evolution of polo-like kinases. Cell Cycle. 10 (14), 2255-2262 (2011).
- Lee, S. Y., Jang, C., Lee, K. A. Polo-like kinases (Plks), a key regulator of cell cycle and new potential target for cancer therapy. Dev Reprod. 18 (1), 65-71 (2014).
- Park, J. E., Hymel, D., Burke, T. R. Jr, Lee, K. S. Current progress and future perspectives in the development of anti-polo-like kinase 1 therapeutic agents. F1000Res. 6, 1024(2017).
- Stafford, J. M., Wyatt, M. D., McInnes, C. Inhibitors of the PLK1 polo-box domain: Drug design strategies and therapeutic opportunities in cancer. Expert Opin Drug Discov. 18 (1), 65-81 (2023).
- Feng, Y. B., et al. Overexpression of PLK1 is associated with poor survival by inhibiting apoptosis via enhancement of survivin level in esophageal squamous cell carcinoma. Int J Cancer. 124 (3), 578-588 (2009).
- Gutteridge, R. E. A., Ndiaye, M. A., Liu, X., Ahmad, N. PLK1 inhibitors in cancer therapy: From laboratory to clinics. Mol Cancer Ther. 15 (7), 1427-1435 (2016).
- Steegmaier, M., et al. BI 2536, a potent and selective inhibitor of polo-like kinase 1, inhibits tumor growth in vivo. Curr Biol. 17 (4), 316-322 (2007).
- Vanden Bossche, J., et al. Spotlight on volasertib: preclinical and clinical evaluation of a promising PLK1 inhibitor. Med Res Rev. 36 (4), 749-786 (2016).
- Yin, Z., Song, Y., Rehse, P. H. Thymoquinone blocks pSer/pThr recognition by PLK1 polo-box domain as a phosphate mimic. ACS Chem Biol. 8 (2), 303-308 (2013).
- Reindl, W., Yuan, J., Krämer, A., Strebhardt, K., Berg, T. Inhibition of polo-like kinase 1 by blocking polo-box domain-dependent protein-protein interactions. Chem Biol. 15 (5), 459-466 (2008).
- Scharow, A., et al. Optimized PLK1 PBD inhibitors based on poloxin induce mitotic arrest and apoptosis in tumor cells. ACS Chem Biol. 10 (11), 2570-2579 (2015).
- Reindl, W., Yuan, J., Krämer, A., Strebhardt, K., Berg, T. A pan-specific inhibitor of the polo-box domains of polo-like kinases arrests cancer cells in mitosis. ChemBioChem. 10 (7), 1145-1148 (2009).
- Park, J. E., et al. Specific inhibition of an anticancer target, polo-like kinase 1, by allosterically dismantling its mechanism of substrate recognition. Proc Natl Acad Sci U S A. 120 (35), e2305037120(2023).
- Archambault, V., Normandin, K. Several inhibitors of the PLK1 polo-box domain turn out to be non-specific protein alkylators. Cell Cycle. 16 (12), 1220-1224 (2017).
- Jo, S., Kim, T., Iyer, V. G., Im, W. CHARMM-GUI: A web-based graphical user interface for CHARMM. J Comput Chem. 29 (11), 1859-1865 (2008).
- Park, S. J., Kern, N., Brown, T., Lee, J., Im, W. CHARMM-GUI PDB manipulator: Various PDB structural modifications for biomolecular modeling and simulation. J Mol Biol. 435 (14), 167995(2023).
- Kim, J. H., Ku, B., Lee, K. S., Kim, S. J. Structural analysis of the polo-box domain of human polo-like kinase 2. Proteins. 83 (7), 1201-1208 (2015).
- Jumper, J., et al. Highly accurate protein structure prediction with AlphaFold. Nature. 596 (7873), 583-589 (2021).
- UniProt Consortium. UniProt: The universal protein knowledgebase in 2023. Nucleic Acids Res. 51 (D1), D523-D531 (2023).
- Gallo, K., et al. SuperNatural 3.0—A database of natural products and natural product-based derivatives. Nucleic Acids Res. 51 (D1), D654-D659 (2023).
- Du, J., et al. KEGG-PATH: Kyoto encyclopedia of genes and genomes-based pathway analysis using a path analysis model. Mol Biosyst. 10 (9), 2441-2447 (2014).
- Bento, A. P., et al. An open source chemical structure curation pipeline using RDKit. J Cheminform. 12 (1), 51(2020).
- Chung, N. C., Miasojedow, B., Startek, M., Gambin, A. Jaccard/Tanimoto similarity test and estimation methods for biological presence-absence data. BMC Bioinformatics. 20 (Suppl 15), 644(2019).
- Liu, Y., et al. CB-Dock2: Improved protein–ligand blind docking by integrating cavity detection, docking and homologous template fitting. Nucleic Acids Res. 50 (W1), W159-W164 (2022).
- Vangone, A., et al. Large-scale prediction of binding affinity in protein–small ligand complexes: the PRODIGY-LIG web server. Bioinformatics. 35 (9), 1585-1587 (2019).
- Fu, L., et al. ADMETlab 3.0: An updated comprehensive online ADMET prediction platform enhanced with broader coverage, improved performance, API functionality and decision support. Nucleic Acids Res. 52 (W1), W422-W431 (2024).
- Daina, A., Michielin, O., Zoete, V. SwissADME: A free web tool to evaluate pharmacokinetics, drug-likeness and medicinal chemistry friendliness of small molecules. Sci Rep. 7 (1), 1-13 (2017).
- Patlewicz, G., Jeliazkova, N., Safford, R., Worth, A., Aleksiev, B. An evaluation of the implementation of the Cramer classification scheme in the Toxtree software. SAR QSAR Environ Res. 19 (5-6), 495-524 (2008).
- Neese, F. Software update: The ORCA program system—version 5.0. Wiley Interdiscip Rev Comput Mol Sci. 12 (5), e1606(2022).
- Daina, A., Zoete, V. A BOILED-Egg to predict gastrointestinal absorption and brain penetration of small molecules. ChemMedChem. 11 (11), 1117-1121 (2016).
- Sehnal, D., et al. Mol* Viewer: Modern web app for 3D visualization and analysis of large biomolecular structures. Nucleic Acids Res. 49 (W1), W431-W437 (2021).
- Liu, Y., Cao, Y. Protein–ligand blind docking using CB-Dock2. Comput Drug Discov Des. 2023, 113-125 (2023).
- Manallack, D. T. The pKa distribution of drugs: application to drug discovery. Perspect Med Chem. 1, 25-38 (2007).
- Manallack, D. T., Prankerd, R. J., Yuriev, E., Oprea, T. I., Chalmers, D. K. The significance of acid/base properties in drug discovery. Chem Soc Rev. 42 (2), 485-496 (2013).
- Charifson, P. S., Walters, W. P. Acidic and basic drugs in medicinal chemistry: A perspective. J Med Chem. 57 (23), 9701-9717 (2014).
- Wildman, S. A., Crippen, G. M. Prediction of physicochemical parameters by atomic contributions. J Chem Inf Comput Sci. 39 (5), 868-873 (1999).
- Pasha, T., et al. Therapeutic importance of biological half-life of antineoplastic agents – A review. Adv Pharmacol Pharm. 10, 265-272 (2022).
- Smith, D. A., Beaumont, K., Maurer, T. S., Di, L. Relevance of half-life in drug design. J Med Chem. 61 (10), 4273-4282 (2018).
- Sharma, P., et al. A cryptic hydrophobic pocket in the polo-box domain of the polo-like kinase PLK1 regulates substrate recognition and mitotic chromosome segregation. Sci Rep. 9 (1), 1-15 (2019).
- Kurkcuoglu, Z., et al. Performance of HADDOCK and a simple contact-based protein–ligand binding affinity predictor in the D3R Grand Challenge 2. J Comput Aided Mol Des. 32 (1), 175-185 (2018).
- Gaieb, Z., et al. D3R Grand Challenge 2: Blind prediction of protein–ligand poses, affinity rankings, and relative binding free energies. J Comput Aided Mol Des. 32 (1), 1-20 (2018).
- Delgado, J., Radusky, L. G., Cianferoni, D., Serrano, L. FoldX 5.0: Working with RNA, small molecules and a new graphical interface. Bioinformatics. 35 (20), 4168-4169 (2019).
- Wang, Z., et al. fastDRH: A webserver to predict and analyze protein–ligand complexes based on molecular docking and MM/PB (GB) SA computation. Brief Bioinform. 23 (5), bbac201(2022).
- Wang, H., Liu, H., Ning, S., Zeng, C., Zhao, Y. DLSSAffinity: Protein–ligand binding affinity prediction via a deep learning model. Phys Chem Chem Phys. 24 (17), 10124-10133 (2022).
- Schöning-Stierand, K., et al. Proteins Plus: A comprehensive collection of web-based molecular modeling tools. Nucleic Acids Res. 50 (W1), W611-W615 (2022).
- Flores-Holguín, N., Glossman-Mitnik, D. CDFT-based chemical reactivity properties analysis of the fluorine substitution in the selective estrogen receptor modulator (SERM) tamoxifen. Theor Chem Acc. 142 (8), 79(2023).
- Akçay, H. T., Bayrak, R. Computational studies on the anastrozole and letrozole, effective chemotherapy drugs against breast cancer. Spectrochim Acta A Mol Biomol Spectrosc. 122, 142-152 (2014).
- Georgieva, I., Trendafilova, N., Dodoff, N., Kovacheva, D. DFT study of the molecular and crystal structure and vibrational analysis of cisplatin. Spectrochim Acta A Mol Biomol Spectrosc. 176, 58-66 (2017).
- Lawal, M. M., Kucukkal, T. G. Evaluation of small molecule binding to the polo-box domain of PLK1 at the molecular level. J Comput Biophys Chem. 25 (5), 751-768 (2026).
- Zhao, C., et al. Discovery of novel dual-targeting inhibitors against PLK1-PBD and PLK4-PB3: structure-guided pharmacophore modelling, virtual screening, molecular docking, molecular dynamics simulation, and biological evaluation. J Enzyme Inhib Med Chem. 40 (1), 2522810(2025).
- Zhou, N., Zheng, C., Tan, H., Luo, L. Identification of PLK1-PBD inhibitors from the library of marine natural products: 3D QSAR pharmacophore, ADMET, scaffold hopping, molecular docking, and molecular dynamics study. Mar Drugs. 22 (2), 83(2024).
Reprints and Permissions
