Here, we experimentally compare singly curved and straight piezoelectric transducers embedded in reinforced concrete structures for energy harvesting and structural health monitoring by evaluating their open-circuit voltage, power generation, power storage, and damage detection capability. Curved transducers have surpassed the straight ones, offering better performance for real-world applications.
A subscription to JoVE is required to view this content. Sign in or start your free trial.
Method Article
Investigating the Potential of Singly Curved Thin Piezoelectric Transducers for Energy Harvesting and Structural Health Monitoring
In This Article
Summary
Abstract
Over the past two decades, piezoelectric materials have become an integral part of structural health monitoring (SHM) and energy harvesting. These materials are available in various forms and configurations, yet the potential of curved configurations remains largely unexplored. This article experimentally explores the performance of singly curved thin piezoelectric transducers compared to their straight configuration when embedded in reinforced concrete (RC) structures for energy harvesting and SHM applications. The research includes a side-by-side comparison of these configurations based on (a) the open-circuit voltage generated by them under pure harmonic excitations, (b) the power generated under the impedance matching conditions, and (c) their potential for power storage in capacitors under real-life erratic vibrations with impedance mismatch conditions. Additionally, the article investigates the damage detection capabilities of curved piezo transducers using the electromechanical impedance (EMI) technique, an area that has not been thoroughly explored.
The results from all four experiments demonstrate that the curved piezo transducers outperform their straight configurations in both SHM and energy harvesting applications. Therefore, the findings from these investigations are crucial for the effective utilization of curved piezoelectric transducers in real-world RC structures, enhancing both energy harvesting and structural health monitoring, which in fact, leads to the economic maintenance and safe operation of RC structures.
Introduction
Structural Health Monitoring (SHM) is a crucial engineering science aimed at ensuring the safety, durability, economical operation, and performance of structures, such as buildings, bridges, dams, etc. SHM utilizes various sensors, data acquisition systems, and advanced technologies to gather real-time data such as stress, strain, vibration, displacement, temperature, etc. to periodically analyze the state of a structure throughout its lifecycle1,2. By detecting the signs of damage, wear and tear, degradation, or any other anomalies at an early stage, SHM enables cost-effective maintenance and safe operation of the structure, thereby extending its lifespan.
Piezoelectric materials are a class of smart materials with a unique ability to develop electric potential across their surfaces in response to mechanical vibrations/ stresses or strains and vice versa. The direct and converse effects of piezoelectricity are explained in Figure 1. Due to this unique ability, they are widely used as sensors, actuators, and energy harvesters in engineering, medical, and SHM fields3,4,5,6,7,8. The various types of piezoelectric materials include natural crystals such as Quartz (SiO2), Topaz, etc., piezoceramics like lead zirconate titanate (PZT), piezoelectric polymers basically polyvinylidene fluoride (PVDF), and many more. Kaur and Bhalla (2015) established that the same set of piezoelectric transducers (PZT patches) can be utilized for SHM of concrete structures and for harvesting the energy required for their functioning as sensors9. Thus, the ambient energy harvested in real-time eliminates the demand for numerous batteries as the energy needs to be stored only transiently for SHM10.
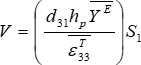
The property of the piezoelectric materials as a sensor and energy harvester is based on the phenomenon of the direct piezoelectric effect (Figure 1), where the piezoelectric material develops electric potential or voltage (V) across the opposite surfaces when subjected to mechanical strain (S1). This is represented by the equation:
 (1)
(1)
Where d31 is the piezoelectric strain coefficient, expressed in C/N or m/V. The subscript "31" indicates that an electric field applied in direction 3 induces strain in direction 1, hp denotes the thickness of the piezoelectric material in meters,  represents the dynamic Young's modulus under a constant or zero electric field, measured in N/m2, and
  is the dynamic electric permittivity under constant or zero mechanical stress, measured in F/m3,11,12.
The piezoelectric materials embedded inside or surface-bonded on a structure can be utilized to monitor the anomalies in the structure based on the strain and impedance measurements they record. These materials can provide the curvature mode shapes directly and are therefore often utilized for global dynamic techniques13,14. With the development of the electromechanical impedance (EMI) technique, these materials have also proved their effectiveness in localized damage detection15,16. The EMI technique has gained wide popularity in the field of SHM due to its non-destructive nature, ease of implementation, and cost-effectiveness of the PZT transducers. In this technique, the PZT patches installed on the host structure are electrically excited with the application of harmonic electric potential at high frequencies (in the kilohertz [kHz] range) in sweep mode using an inductance-capacitance-resistance (LCR) meter or impedance analyser.
As a result of the direct piezoelectric effect, it generates mechanical vibrations in the structure. And due to the converse piezoelectric effect, these mechanical vibrations influence the electromechanical impedance of the piezoelectric transducer17,18. This electromechanical impedance signature is generated in the same frequency range as that of the excitation signal. The following equation represents the electromechanical admittance  , the inverse of the electromechanical impedance, for a 1-D model system19
 (2)
(2)
Where ω is the angular frequency in rad/s,  , l, w and h are respectively the half-length, the width and the thickness of the PZT patch. Z and Za represent the complex mechanical impedance of the structure and the PZT patch respectively and κ is the wave number. These signatures remain stable and consistent as long as the structure is intact. However, on occurrence of any damages, significant changes are observed between the current and baseline signature (the signature acquired during the healthy stage of the structure). By analyzing the impedance signature, it is possible to detect the presence, location, and severity of damage at early stages and timely implement cost-effective rectification works, improving the durability of the structure20,21,22.
Over the past two decades, extensive research has been carried out to examine the energy-harvesting potential of piezoelectric materials. Though these materials are available in several configurations like tubes, spheres, disks, and so on, most of the studies are based on straight piezoelectric patches, strips, bars, etc.23,24. Hence, the potential of various other configurations of the piezo transducers needs to be explored.
The PZT patches have established a significant presence in the field of SHM over the last two decades. However, the usage of bare PZT patches for concrete structures is not recommended as they may deteriorate during construction. Therefore, Bhalla and Gupta (2007, 2022) came up with the idea of a concrete vibration sensor (CVS), which is a ready-to-use sensor primarily for the SHM of concrete structures25,26, developed at the Smart Structures and Dynamics Laboratory (SSDL), IIT Delhi. In CVS, the piezoelectric transducer (PZT patch) is meticulously covered with a composite protection layer, rendering it ready to use for direct installation in real-life before being installed in a concrete structure. The grade of the concrete cylinder encapsulating the PZT patch shall be equal to or higher than that of the concrete structure in which it has to be embedded. CVS has very strong strain compatibility with the host structure and, can readily acquire curvature mode shapes and resonant frequencies, and can withstand extreme conditions as compared to the surface-bonded PZT sensors. Kaur (2015) experimentally established the use of CVS for SHM and as an energy harvester by generating the energy required for SHM work during idle time27.
Similar to CVS, the concrete vibration energy harvester (CVEH) is a ready-to-use sensor developed in SSDL for energy harvesting from concrete structures; however, unlike CVS, CVEH encapsulates a curved transducer28. The increased bending stress/strain created across the piezo patch as a result of the curved shape raises the voltage developed and, consequently, the power generation. However, due to the fragile nature of the piezoceramics, not all piezo patches can be used to manufacture CVEH. The piezo element used for the fabrication of CVEH shall be carefully selected so that it solely produces the d31 effect. The presence of the d33 effect will counteract the benefits of d31 in curved piezo transducers, where the poling direction varies perpendicularly throughout the curvature, lowering the transducer's efficiency29. Using a d31 type macro fiber composite (MFC) patch, a very flexible and high-performance piezo variant developed by the National Aeronautics and Space Administration (NASA), Singh (2017) successfully fabricated a CVEH and experimentally confirmed that the CVEH produces almost double open circuit voltage generating capability than the CVS. However, there is a dearth of systematic computational and experimental investigations covering power measurement under real-life settings in comparison to the straight arrangement, despite indications of the curved configuration's superior performance. Furthermore, no research has been done on exploring the possibilities of a curved arrangement for SHM.
The curved piezoelectric energy harvesting materials (CVEH) are expected to offer several advantages over traditional flat or planar piezoelectric energy harvesting materials. Curved piezoelectric materials exhibit improved stress/strain distribution across the piezoelectric surface due to the nature of their deformation when subjected to external forces. As the strain in these materials is more evenly spread, it improves the efficiency of energy conversion and power generation and allows functioning at very low frequency ranges30,31,32,33. The performance of MFCs (Macro-Fiber Composites) has been demonstrated globally in terms of flexibility, reliability, durability, damage tolerance, enhanced actuator efficiency, and directional actuation and sensing capabilities34,35,36,37. The MFC-based CVS or CVEH is fabricated by encapsulating the patches within concrete or mortar cylinders after applying a suitable protective coating. Once these transducers are embedded in a structure during its casting, the entire structure, with the CVS/CVEH integrated inside, functions as a unified system. As long as the structure remains durable, the CVEHs or CVS (Structural Health Monitoring Systems) will also maintain their operational effectiveness and longevity. Therefore, MFC-based CVS and CVEH systems offer superior durability for structural health monitoring.
The purpose of this study is to compare the curved and straight configurations of piezoelectric transducers (CVEH and CVS, respectively) incorporated inside RC structures in terms of performance for energy harvesting and SHM. Open-circuit voltage across the piezo transducers, power development under impedance matching conditions, and the possibility of power storage into capacitors for both configurations are investigated in the research. The heretofore undiscovered damage detection potential of curved piezo transducers using the EMI technique is also experimentally investigated in this work.
Access restricted. Please log in or start a trial to view this content.
Protocol
NOTE: This protocol is a brief description of the presenter's M. Tech. project carried out at the Smart Structures and Dynamics Laboratory (SSDL), Indian Institute of Technology Delhi. Full details can be assessed from the M. Tech. thesis11 and related publications12,13.
1. Experimentation: Materials, fabrication, and setup
- Materials
NOTE: Piezoceramics have established a prominent position in the fields of SHM and energy harvesting owing to their high strength, stiffness, and coupling factors. These materials' brittleness, however, limits their use to curved surfaces. Consequently, the National Aeronautics and Space Administration (NASA) developed a particularly flexible and high-performance piezo version, namely the MFC, which was selected as the piezoelectric transducer for the current study.- Use the variant M5628-P2, with a 300 µm thickness and having sole d31 effect.
- Fabrication and setup
- Cast two cement mortar cylinders of 100 mm diameter and 30 mm thickness.
- Encase the straight and curved MFC piezo transducers in the mortar cylinders at the mid-depth location during casting (Figure 2A, B).
- Apply a protective layer of standard epoxy adhesive to the MFC patches to avoid degradation during casting.
- Cure the mortar cylinders (Figure 2C, D) enclosing the transducers for 7 days.
- Cast an RC beam (1500 mm [L] × 300 mm [B] × 100 mm [D]) of grade M30.
- Embed the CVEH and the CVS at the mid-span location by tying them to the top layer compression reinforcement of the beam while casting. Ensure that their top surface coincides with that of the beam, as shown in Figure 2E29. The properties of the RC beam and the piezo transducer are listed in Table 1.
- Ensure that the electrical connections of the piezo transducers are kept safe during the entire process.
- Place the RC beam in a supported condition with an effective span of 1100 mm for performing various experiments.
2. Comparative analysis of open circuit voltage generated across piezo transducers under pure harmonic excitation
NOTE: This section compares the open circuit voltage generated by the straight and the curved piezo transducers under pure harmonic excitations.
- Experimental setup
- Set up an RC beam with CVS and CVEH embedded inside at mid-span, as mentioned in the previous paragraph.
- Set up a portable shaker for inducing harmonic excitation, placed at a distance of L/2 from the support, where L is the effective span of the beam.
- Set up a function generator to generate electrical signals.
- Set up a power amplifier for amplifying the signals generated by the function generator and transmitted to the shaker (hence connected to the shaker and function generator)
- Set up an oscilloscope to measure the open circuit voltage generated across the sensors. Connect the electrical wires from the piezo sensors to the two channels of the oscilloscope.
- Set up an accelerometer with a sensitivity of 100 mV per g placed on the beam closer to the shaker to measure the acceleration, where g represents the acceleration due to gravity.
- Set up an ICP amplifier to record the measurements from the accelerometer (hence connected to the accelerometer and to the third channel of the oscilloscope)
NOTE: Refer to Figure 3 for the experimental setup.
- Procedure for frequency domain analysis
- Excite the RC beam using the portable shaker in sweep mode. The input shall be given to the Function generator: Dynamic sweep excitation from 10 Hz to 100 Hz for 2.5 s.
- Conduct frequency domain analysis of the responses received from the piezo sensors and accelerometer to determine the natural frequency of the beam. Please refer to previously published articles for the detailed procedure on frequency domain analysis38,39,40.
- Procedure for open circuit voltage comparison
- Excite the beam at distinct frequencies from 25 Hz to 85 Hz using the shaker. Adopt a step interval of 15 Hz. Record the response from CVS and CVEH for all the frequencies.
- Shift the position of the shaker to L/3 and L/6 distance from the support, and repeat the above step ( step 2.3.1) for each shaker position.
- Compare the responses of CVS and CVEH in each case either graphically or analytically.
3. Comparative analysis of power generated by piezo transducers
NOTE: This section compares the power generated by the piezo transducers for favorable impedance-matching conditions.
- Experimental setup
- Set up an RC beam with CVS and CVEH embedded inside at mid-span, as mentioned in step 2.1.1.
NOTE: Refer to Figure 4A for the experimental setup. - Place an eccentric rotary-type shaker at a distance of L/4 from the nearest support
- Set up a speed controller and connect it to the shaker.
- Set up an oscilloscope. Connect the CVS and CVEH to the two channels of the oscilloscope.
- Place an accelerometer with a sensitivity of 100 mV per g at the mid-span of the beam. Connect it to the ICP amplifier.
- Set up an ICP amplifier to record the measurements from the accelerometer.
- Connect an additional circuit, as shown in Figure 4B, to the piezo transducers for power measurement. The circuit consists of two resistors, R1 and R2 (R1 = 335 kΩ and R2 = 340 kΩ), connected in series across the piezo sensors.
NOTE: The impedance of the selected resistors shall be in a similar range as that of the piezo sensors (source impedance). A significant impedance mismatch can lead to excessive heat dissipation, substantial power loss, and even circuit failure. The impedance of the sensors can be measured for various frequencies using an LCR meter. For the current CVS and CVEH, the average impedance for various frequencies ranging from 20 Hz to 80 Hz (step interval = 5 Hz) is 32 kΩ and 35 kΩ respectively. - Set up a digital multimeter and connect it across the resistor R1 to measure the output voltage (V2) of the circuit.
- Connect the laptop to a digital multimeter for data acquisition.
- Set up an RC beam with CVS and CVEH embedded inside at mid-span, as mentioned in step 2.1.1.
- Procedure
- Start the shaker and induce vibrations to the RC beam. Adjust the acceleration of the shaker using the speed controller.
- Record the output voltage (V2) using the multimeter for each sensor.
- Repeat the above step for two or more accelerations of the shaker.
NOTE: The adopted peak accelerations in the study were 15.19 m/s2, 17.39 m/s2, and 21.68 m/s2. - Calculate the power generated (P) by both sensors for each acceleration of the shaker using the formula given below12,27:
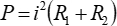

Where i is the current flowing through the circuit.
4. Power storage potential of piezo transducers
NOTE: This section focuses on analyzing the potential for power storage or energy harvesting of the piezo transducers under real-life erratic vibrations with general field (impedance mismatch) conditions. A 1000 µF capacitor was used to harvest the energy generated by the piezo transducers.
- Experimental setup
- Set up the experimental apparatus as described in section 3.1, excluding the power measurement circuit.
- Replace the power measurement circuit with a simple full bridge rectifier circuit. Refer to Figure 4C, D for the experimental setup.
NOTE: Purpose of a simple full bridge rectifier circuit: The output voltage generated by the piezo transducers is in the alternating current (AC) mode, which cannot be stored as it reverses the direction periodically. Therefore, the simple full bridge rectifier circuit is utilized to convert AC signals to direct current (DC) mode, which is a stable power supply and can be stored in capacitors or batteries. The circuit consists of four Schottky-type diodes labeled D1 to D4, with a lower forward bias voltage (in the range of 0.1 V)41. The diodes are arranged in series pairs, with only two diodes functioning during each half cycle. In the positive half-cycle, the two diodes, D1 and D4 will conduct in series where the diodes D2 and D3 will be turned off (reverse biased) and vice versa during the negative half-cycle. Thus, the full bridge rectifier circuit ensures stable and passive circuit systems42.
- Procedure
- Start the shaker and induce vibrations to the RC beam. Adjust the acceleration of the shaker using the speed controller.
- Record the output voltage (Vc) of the rectifier circuit using the multimeter for both the sensors.
- Calculate the total energy ET and average power Pavg stored in the capacitor by both sensors using the equations given below 12,13:


Where C is the capacitance (1000 µF), and Tc is the total charging time of the capacitors. - Repeat the above steps for various accelerations.
5. Suitability of piezo transducers for SHM based on the damage detection potential
NOTE: This section evaluates the suitability of piezoelectric transducers for SHM by assessing their potential for damage detection using the EMI technique.
- Experimental setup:
- Place the same RC beam as mentioned in the previous sections.
- Set up an LCR meter to measure the electrical admittance signature and connect it with the piezo transducers.
- Also, connect the laptop to the LCR meter.
- Place a digital thermometer to ensure a uniform room temperature throughout the experiment.
NOTE: Refer to Figure 5A for the experimental setup.
- Procedure
- Using the LCR meter, apply a harmonic electric potential across the transducers to excite them at high frequencies in sweep mode.
Case 1: Coarser frequency range: 1 kHz to 1000 kHz, step interval of 1 kHz
Case 2: Finer frequency range: 100 kHz to 300 kHz, step interval of 100 Hz - Acquire the admittance signature generated by the transducers using the LCR meter and laptop for both cases. These signatures during the healthy stage of the structure are called baseline signatures.
- Repeat the steps again to check the correlation between the signatures in each case.
- Induce damage in the beam by drilling a hole and repeat steps 5.2.1 and 5.2.2 to obtain the signatures during stage 1 damage.
- Induce more damage by drilling more holes and repeat steps 5.2.1 and 5.2.2 to obtain the signatures during each stage of damage. Three damages are induced in the current study, as shown in Figure 5B.
- Compare and analyze the signatures visually and numerically by comparing the root mean square deviation (RMSD) value between the healthy stage and damaged stage signatures.
- RMSD can be calculated using the equation given below12,13:

where n is the sample size, xdi and xhi are the ith values in the signatures under the damaged and healthy stages, respectively.
- Using the LCR meter, apply a harmonic electric potential across the transducers to excite them at high frequencies in sweep mode.
Access restricted. Please log in or start a trial to view this content.
Results
Comparative analysis of open circuit voltage generated across piezo transducers under pure harmonic excitation
The time domain responses of the piezo transducers and accelerometer are shown in Figure 6A,B. From the time domain signals, their frequency domain responses are derived using the Fast Fourier Transform (FFT) method, and the responses are shown in Figure 6C,D. The natural frequency of the beam with ...
Access restricted. Please log in or start a trial to view this content.
Discussion
A critical step in the presented protocol involves accurately determining the natural frequency of the beam-shaker system. This step is essential because both the energy harvesting and structural health monitoring (SHM) capabilities of piezoelectric transducers are highly dependent on the system's dynamic behavior. The use of sweep excitation facilitated the identification of the resonance frequency of the beam-shaker system. During this procedure, the frequency domain responses of the CVEH, CVS, and accelerometer were r...
Access restricted. Please log in or start a trial to view this content.
Disclosures
This article is adapted from the authors' previously published works11,12,13and is intended solely for educational purposes, specifically to facilitate the dissemination of knowledge and scientific art through video format. Figures 1 to 12 are reproduced with due permission of Elsevier.
Acknowledgements
This work was financially supported by the Indian Institute of Technology (IIT) Delhi and the Department of Science and Technology [DST/INSPIRE/04/2015/000545]. The authors greatly acknowledge the support extended by Mr. Sameer Hasan and Mr. Pawan for creating the video for the journal.
Access restricted. Please log in or start a trial to view this content.
Materials
| Name | Company | Catalog Number | Comments |
|---|---|---|---|
| Accelerometer | PCB Piezotronics | 352C34 | |
| Aggregates - 10 mm | N/A | N/A | |
| Aggregates - 20 mm | N/A | N/A | |
| Capacitor (1000 μF) | N/A | N/A | |
| Cement | N/A | N/A | |
| Digital multimeter | Agilent Technologies | 34411A | |
| Digital thermometer | La Crosse Technology | WS-9006U | |
| Epoxy | N/A | N/A | |
| Function generator | Agilent Technologies | 33210A | |
| ICP amplifier | PCB Piezotronics | 482C Series | |
| LCR meter | Agilent Technologies | E4980A | |
| Macro fiber composite (MFC) | Smart Material | M5628-P2 | |
| Oscilloscope | Tektronix | TDS 2004B | |
| Portable shaker | LDS | V406 | |
| Power amplifier | LDS | PA500L | |
| Resistors | N/A | N/A | |
| Rotary type shaker | Crompton Greaves | XKF5577 | Not available now |
| Sand | N/A | N/A | |
| Schottky-type diodes | Diodes Incorporated | BAT1000 | |
| Wires | N/A | N/A |
References
- Farrar, C. R., Worden, K. An introduction to structural health monitoring. Philos Trans R Soc A. 365 (1851), 303-315 (2007).
- Sohn, H., et al. A review of structural health monitoring literature: 1996-2001. Los Alamos Natl Lab. 1 (16), 10-12989 (2003).
- Bhalla, S., Moharana, S., Talakokula, V., Kaur, N. Piezoelectric Materials: Applications in SHM, Energy Harvesting and Biomechanics. , John Wiley & Sons Ltd. London. (2017).
- Sekhar, M. C., Veena, E., Kumar, N. S., Naidu, K. C. B., Mallikarjuna, A., Basha, D. B. A review on piezoelectric materials and their applications. Cryst Res Technol. 58 (2), 2200130(2023).
- Zhao, X., Yang, E. C., Li, Y. H., Crossley, W. Closed-form solutions for forced vibrations of piezoelectric energy harvesters by means of Green's functions. J Intell Mater Syst Struct. 28 (17), 2372-2387 (2017).
- Zhao, X., Li, S. Y., Zhu, W. D., Li, Y. H. Nonlinear forced vibration analysis of a multi-cracked Euler-Bernoulli curved beam with inclusion of damping. Mech Syst Signal Process. 180, 109147(2022).
- Zhao, X., Zhu, W. D., Li, Y. H. Closed-form solutions of bending-torsion-coupled forced vibrations of a piezoelectric energy harvester under a fluid vortex. J Vib Acoust. 144 (2), 021010(2022).
- Zhao, X., Meng, S., Zhu, W., Zhu, Y., Li, Y. A closed-form solution of forced vibration of a double-curved-beam system by means of the Green's function method. J Sound Vib. 561, 117812(2023).
- Kaur, N., Bhalla, S. Combined energy harvesting and structural health monitoring potential of embedded piezo-concrete vibration sensors. J Energy Eng. 141 (4), D4014001(2015).
- Sezer, N., Koç, M. A comprehensive review on the state-of-the-art of piezoelectric energy harvesting. Nano Energy. 80, 105567(2021).
- Krishnanunni, A. V. Experimental and numerical investigations on efficacy of singly curved thin piezo transducers for energy harvesting and structural health monitoring. [M.Tech. thesis]. , Indian Institute of Technology Delhi. New Delhi, India. (2022).
- Krishnanunni, A. V., Kaur, N., Bhalla, S. Singly Curved Thin Piezo Transducers for Energy Harvesting and Structural Health Monitoring. , BP International. West Bengal. (2024).
- Krishnanunni, A. V., Kaur, N., Bhalla, S., Singh, N., Balguvhar, S. Efficacy of singly curved thin piezo transducers for structural health monitoring and energy harvesting for RC structures. Energy Rep. 9, 2506-2524 (2023).
- Aulakh, D. S., Bhalla, S. 3D torsional experimental strain modal analysis for structural health monitoring using piezoelectric sensors. Measurement. 180, 109476(2021).
- Giurgiutiu, V., Zagrai, A. N. Embedded self-sensing piezoelectric active sensors for on-line structural identification. J Vib Acoust. 124 (1), 116-125 (2002).
- Park, G., Cudney, H. H., Inman, D. J. Impedance-based health monitoring of civil structural components. J Infrastruct Syst. 6 (4), 153-160 (2000).
- Baptista, F. G., Budoya, D. E., De Almeida, V. A., Ulson, J. A. C. An experimental study on the effect of temperature on piezoelectric sensors for impedance-based structural health monitoring. Sensors. 14 (1), 1208-1227 (2014).
- Panigrahi, R., Bhalla, S., Gupta, A. A low-cost variant of electromechanical impedance (EMI) technique for structural health monitoring. Exp Tech. 34 (2), 25-29 (2010).
- Bhalla, S., Soh, C. K. Structural health monitoring by piezo-impedance transducers. I: Modeling. J Aerosp Eng. 17 (4), 154-165 (2004).
- Annamdas, V. G. M., Pang, J. H. L., Chew, Y. X., Hoh, H. J., Zhou, K., Song, B. Fatigue monitoring of double surface defects using PZT-based electromechanical impedance and digital image correlation methods. Adv Mater Res. 891 - 892, 551-556 (2014).
- Ai, D., Luo, H., Wang, C., Zhu, H. Monitoring of the load-induced RC beam structural tension/compression stress and damage using piezoelectric transducers. Eng Struct. 154, 38-51 (2018).
- Dixit, A., Bhalla, S. Prognosis of fatigue and impact induced damage in concrete using embedded piezo-transducers. Sensors Actuators A Phys. 274, 116-131 (2018).
- Pourashraf, T., Bonello, P., Truong, J. Analytical and experimental investigation of a curved piezoelectric energy harvester. Sensors. 22 (6), 2207(2022).
- Zhang, X., Huang, X., Wang, B. A quad-stable nonlinear piezoelectric energy harvester with piecewise stiffness for broadband energy harvesting. Nonlinear Dyn. , 19633-19652 (2024).
- An embeddable piezo composite concrete vibration sensor for structural health monitoring of reinforced concrete structures and process of preparation thereof. Indian patent. , 412929 (2022).
- Foundation for Innovation Technology and Transfer (FITT), IIT Delhi, New Delhi, India. A novel vibration sensor for concrete structures. Patent application no. , 1011/DEL/2011 (2007).
- Kaur, N. Integrated structural health monitoring and energy harvesting potential of adhesively bonded thin piezo patches operating in d31 mode. [Ph.D. thesis]. , Indian Institute of Technology. Delhi, New Delhi, India. (2015).
- Concrete vibration energy harvester. Indian patent no. , 477706 (2023).
- Singh, N. Fabrication and evaluation of concrete vibration energy harvester (CVEH). [M.Tech. thesis]. , Department of Civil Engineering, IIT Delhi. Delhi, New Delhi, India. (2017).
- Jung, W. S., et al. Powerful curved piezoelectric generator for wearable applications. Nano Energy. 13, 174-181 (2015).
- Kathpalia, B., Tan, D., Stern, I., Valdes, F., Kim, S., Erturk, A. Modeling and characterization of a curved piezoelectric energy harvester for smart paver tiles. Procedia Comput Sci. 109, 1060-1066 (2017).
- Wang, B., Li, Z., Yang, Z. A distributed-parameter electromechanical coupling model for a piezoelectric energy harvester with variable curvature. Smart Mater Struct. 29 (11), 115015(2020).
- Zhou, W., Wang, B., Lim, C. W., Yang, Z. A distributed-parameter electromechanical coupling model for a segmented arc-shaped piezoelectric energy harvester. Mech Syst Signal Process. 146, 107005(2021).
- Nuffer, J., et al. Reliability investigation of piezoelectric macro fiber composite (MFC) actuators. Adaptronic Congress, 2007. , Göttingen. (2007).
- Sodano, H. A., Park, G., Inman, D. J. An investigation into the performance of macro-fiber composites for sensing and structural vibration applications. Mech Syst Signal Process. 18 (3), 683-697 (2004).
- Upadrashta, D., Yang, Y. Experimental investigation of performance reliability of macro fiber composite for piezoelectric energy harvesting applications. Sensors Actuators A Phys. 244, 223-232 (2016).
- Vu, V. H., Nguyen, M. H., Hwang, C. L., Huynh, T. P. High-strength high-performance concrete incorporating different macro fiber types and contents: engineering and durability performance. J Chin Inst Eng. 47 (1), 81-95 (2024).
- Chopra, A. K. Dynamics of structures. , Pearson Education. India, New Delhi. (2007).
- Chowdhury, I., Dasgupta, S. P. Dynamics of structure and foundation-a unified approach: 1. Fundamentals. , CRC Press. Boca Raton. (2008).
- Kausel, E., Roësset, J. M. Frequency domain analysis of undamped systems. J Eng Mech. 118 (4), 721-734 (1992).
- Diodes. , Diodes Incorporated. At https://www.diodes.com/ (2022).
- Balguvhar, S., Bhalla, S., Soh, C. K. Efficacious piezoelectric energy harvesting, including storage from low-frequency non-periodic bridge vibrations. Curr Sci. 123 (4), Volume needed 554-567 (2022).
- Balguvhar, S., Bhalla, S. Evaluation of power extraction circuits on piezo-transducers operating under low-frequency vibration-induced strains in bridges. Strain. 55 (3), 12303(2019).
- Shanker, R., Bhalla, S., Gupta, A., Praveen Kumar, M. Dual use of PZT patches as sensors in global dynamic and local electromechanical impedance techniques for structural health monitoring. J Intell Mater Syst Struct. 22 (16), 1841-1856 (2011).
Access restricted. Please log in or start a trial to view this content.
Reprints and Permissions
