The protocol shows the development of a myocardial infarction (MI) model by permanently ligating the left anterior descending coronary artery in rats. Animal survival post-MI is essential to salvage cardiomyocytes in the ischemic zone, prevent infarct expansion, and reduce post-myocardial inflammation and fibrosis.
Method Article
Ligation of Left Anterior Descending Coronary Artery in Rats for Developing Occlusive Myocardial Infarction Model
In This Article
Summary
Abstract
Cardiovascular disease (CVD), including ischemic heart disease and stroke, is a major cause of mortality and morbidity throughout the world. Myocardial infarction is a clinical syndrome of ischemic heart disease that occurs due to prolonged ischemia. Ischemic myocardium undergoes functional, metabolic, and structural alterations, leading to irreversible damage to a portion of the myocardium due to necrosis. Experimental models of myocardial infarction are crucial for understanding the acute and chronic cellular, molecular, and morphological changes occurring during and post-MI and for developing and optimizing novel targets or strategies for treatment. The surgical model of MI in small animals employing permanent closure of the left anterior descending coronary artery (LAD) nearly resembles human MI. The goal of this study is to establish a surgically induced MI model involving the closure of the LAD coronary artery indelibly in rats. The experimental protocol includes an initial induction of anesthesia with ketamine 80 mg/kg and xylazine 12 mg/kg i.p., intubation of an endotracheal cannula using an otoscope without performing tracheotomy under ventilator-assisted ventilation with the use of extrinsic positive end-expiratory pressure (PEEP) to prevent the collapse of alveoli. A thoracotomy procedure was adopted that limits the lesions caused to skeletal muscles during surgery. This approach is minimally invasive, repeatable, and lowers mortality post-surgery. In this model, animals survived 4 days post-MI to understand the short-term pathobiological changes, mainly post-MI inflammation, angiogenesis as a natural process of infarct healing, and ultimately, fibrosis in infarcted myocardium.
Introduction
Cardiovascular disease (CVD), mainly comprising ischemic heart disease (IHD) and stroke, is a major cause of mortality and morbidity across the world. According to the World Heart Federation, 20.5 million people died from cardiovascular disease in 20211,2. Myocardial infarction (MI), also known as a heart attack, is an acute clinical syndrome of IHD. During MI, myocardial tissue suffers irreversible damage as a result of prolonged ischemia, which is usually caused by an occlusive thrombus formed over a ruptured atherosclerotic plaque in a coronary artery3.
Timely reperfusion using percutaneous coronary intervention (PCI) or thrombolytic agents is the mainstay therapy to salvage ischemic myocardium from necrosis3,4. In developed countries, due to greater implementation of PCI, mortality following MI has declined, but the incidence of MI is increasing in developing countries like South Asia5. After MI, a portion of the myocardium that undergoes necrosis is surrounded by a zone of reversibly damaged myocardial cells and an ischemic zone. The ischemic myocardium undergoes post-MI ventricular remodeling that can lead to ventricular dilation and dysfunction, ultimately progressing to heart failure6.
Currently, extensive research is being carried out to promote the regeneration of damaged cardiomyocytes by means of stem cell therapy7 and to facilitate myocardial repair by stimulating angiogenesis within the ischemic zone8. However, considerable improvements in strategies are required for the clinical success of both approaches. Thus, experimental models mimicking myocardial infarction or ischemia are crucial for understanding the pathological, cellular, molecular, and morphological changes occurring during and post-MI so that novel therapeutic targets or strategies for treatment can be identified and optimized for clinical translation. In this study, an experimental model of MI is developed by performing closure of the left anterior descending (LAD) coronary artery irreversibly in rats. Firstly, endotracheal intubation was performed in anesthetized animals without tracheotomy under ventilator-assisted ventilation by applying extrinsic positive end-expiratory pressure (PEEP) to prevent atelectasis (deflation/collapse of air sacs in lungs). A minimally invasive procedure was adopted to open the chest cavity, avoiding any injury to skeletal muscles during surgery. The location of ligation involves the origin of the first diagonal branch of the LAD, which produces sufficient infarction and mimics the clinical condition of Occlusive Myocardial Infarction (OMI). As the location of ligation is the mid-LAD region, the mortality rate after surgery, as well as post-surgical complications, is lower9. In this model, animals survived 4 days post-MI to understand the short-term modifications occurring in myocardial tissue post-MI and identification of novel targets and strategies to treat MI.
Protocol
The experimental procedures were performed as per protocol after approval from Institutional Animal Ethics Committee (IAEC) [Protocol No. (IAEC/KCP/2023/009)]. The guidelines of the Committee for the purpose of control and supervision (CCSEA) and the Ministry of Environment, Forest and Climate Change, Government of India, were followed in handling and taking care of experimental animals.
1. Anesthesia and intubation of endotracheal cannula (Duration: 10-15 min)
- Use Wistar rats of either sex, weighing 200 - 240 g, aged more than 6 months. Record the weight of the rats. Anesthetize the rat by administering Ketamine (80 mg/kg) and Xylazine (12 mg/kg) according to body weight through the intraperitoneal route.
NOTE: Ketamine, a dissociative anesthetic, produces rapid anesthesia but partial muscle immobilization10. Thus, it is used in combination with Xylazine to produce muscle relaxation and achieve a state of surgical anesthesia11. - Pinch the tail to ensure the extent of anesthesia. If the rat shows reflexes, administer 1/3rd of the dose of Ketamine. Connect a heating pad to the Ventilator to lay over the operating table to provide homeothermic warming.
- Place the rat in a dorsal decubitus position on the heating pad (Figure 1A). Retain the rat in this position by applying adhesive tapes and set the operation table in an inclined position.
- Adjust the ventilator respiratory parameters with the tidal volume at 8 mL/kg (2-3 mL/min), respiratory rate at 77 breaths per min (bpm), and peak pressure (peak inspiratory pressure) at 15 cm H2O. To prevent the collapse of the lungs, adjust positive end-expiratory pressure (PEEP) to 2 cm H2O.
- To perform endotracheal intubation, grasp the tongue and raise it with blunt tweezers. Insert an otoscope (Figure 1B) in the mouth to view the vocal cords and introduce the endotracheal cannula (Figure 1B and Figure 2A) through the vocal cords. To clearly see the epiglottis, project a flashlight around the throat from above.
- Connect the endotracheal cannula with the ventilator tube (Figure 1A and Figure 2B) and monitor the chest movements to confirm correct intubation. Swelling of abdomen indicates a suspicion of esophageal intubation, repeat the intubation as per step 1.8.
- After all the setup is done, use a surgical stereomicroscope for LAD ligation (Figure 1A), and use a heating lamp during the operation to maintain the rat body temperature at 37 °C.
- Apply depilation cream to the rat's neck and thoracic region and leave for 10 - 20 min. Gently remove the rat's fur from the neck to the thoracic region.
2. Surgical induction of myocardial infarction (Duration: 20 - 25 min)
- Use the tweezers to pluck the skin on the xiphoid process and make a slight incision (about 1 cm) with the help of scissors, followed by cutting longitudinally beginning at the xiphoid process, directed towards the sternocleidomastoid muscle.
- Avoid harming fascia so as to prevent severe bleeding. If there is bleeding, use wrapped wipes to gently press on the bleeding area.
- From the base of the sternocleidomastoid muscle to the 5th- 6th rib, cut the fascia and pectoral muscles along the left side of the sternum.
- Use forceps to make a puncture at the 3rd and 4th intercostal space towards the left side of the sternum. Do not damage the heart or lungs while creating a hole (about 6-8 mm). Apply the peep at this step.
- Use a rib-cut nipper to cut the 4th, 5th, and 6th ribs along with intercostal muscles and detach the remaining intercostal muscles with forceps (Figure 2C).
- Insert the rib retractor gently to hold the ribs apart and expose the heart (Figure 2D). To clearly view the left atrium, separate the pericardium and thymus from the front side of the heart using tweezers and curved scissors.
- Identify the location of the left anterior descending (LAD) coronary artery for ligation by suture.
- After carefully removing the pericardium, identify LAD as a prominent superficial artery running diagonally from the base of the heart to the apex along the interventricular groove. The LAD divides into two sets of branches: first, the septal branches (S1 and S2) that perforate the interventricular septum. The second set of branches, called diagonal branches (D1 and D2), perforate the anterior of the left ventricle.
- Identify the three regions of LAD, namely, proximal, mid, and distal regions. Proximal LAD: the region of LAD from its origin to the first branch, which could be either a septal or a diagonal; Mid LAD: the region between the first branch and the second diagonal branch; Distal LAD: the region beyond the second diagonal branch is known as distal LAD (Figure 2E).
- LAD appears as a pulsatile reddish artery with thicker walls. To confirm its location, gently press with micro forceps, and a pulsation is felt.
- Perform permanent closure of LAD by passing 8-0 silk suture in the mid-LAD region near the origin of the first diagonal branch D1 using a needle holder and tugging the suture gently, preventing any harm to the heart (Figure 2E).
- Using forceps, make two knots of ligature in identical orientation (surgeon's knot). Fasten the ligature by making multiple knots in a two-sided direction with the help of forceps.
3. Sham surgery
- Perform steps 2.1-2.6. After performing a left-sided thoracotomy, expose the heart, pass a silk suture, and pull underneath the left main coronary artery (LAD) without ligating.
4. Administration of treatment drug (Duration: 2-5 min)
- After LAD ligation, immediately inject Doxazosin 0.06 mg/kg intravenously through the tail vein in the treatment group (Figure 3)
5. Chest cavity closure after surgical procedure (Duration: 5 min)
- Remove the retractors so that the ribs and intercostal muscles revert to their original position. Close the chest cavity by suturing the left and right intercostal muscles using a 6-0 silk suture. Make stitches with a 4-0 Prolene suture to close the skin (Figure 2F).
6. Post-surgery care and monitoring (Duration: 40 min - 60 min)
- Follow the operated rat for recovery from anesthesia for 40 min or more. Assure complete recovery by lifting or pinching the tail.
- Remove the connection from the ventilator temporarily and ensure the self-regulated breathing of the rat by examining the normal movement of the thoracic region.
- Switch off the ventilator and remove the endotracheal cannula. Detach the adhesive tapes fastened to the limbs.
- Inject Tramadol (12.5 mg/kg) through the intraperitoneal route to relieve post-operative pain.
- Keep the rat on the heating pad to keep the body temperature at 37 °C for at least 30 min. Continuously monitor the rat for any morbid conditions, such as irregular breathing or difficulty, or any dangerous signs of infarction.
- When the rat is able to move around freely, consider it in a state of complete recovery from anesthesia. Even though the rat is not capable of moving voluntarily, keep it in the cage within 45 min after removal from the ventilator.
- Observe the rat daily for the first 4 days. On the 4th day, sacrifice the rat using a CO2 euthanasia chamber.
7. Analysis of biochemical markers of myocardial infarction
- Assess the troponin level as a biomarker of Myocardial infarction at 6 h and 4 days after surgery in blood samples of animals.
- Sample collection and preparation: Collect blood sample (200 µL) from the tail vein after 6 h of infarction in EDTA-coated or heparin-coated tubes and by retro-orbital puncture (1 mL) after 4 days of MI.
NOTE: An Anticoagulated whole blood sample is preferred for Troponin T testing. - Apply 150 µL of sample to the test strip using cardiac pipettes and disposable dosing syringes supplied in the kit.
- Incubate at room temperature for 15-20 minutes, and then interpret the results based on the appearance of a signal line (reddish line) in the detection zone within 15-20 min. Use the following parameters: No detection line, only control line = negative; visible detection line and control line = positive (Figure 6B).
- Sample collection and preparation: Collect blood sample (200 µL) from the tail vein after 6 h of infarction in EDTA-coated or heparin-coated tubes and by retro-orbital puncture (1 mL) after 4 days of MI.
- Detect Troponin I in a serum sample using the Standard F analyzer.
- Sample collection and preparation: Collect blood samples (200 µL) from a tail vein after 6 h of infarction in EDTA-coated or heparin-coated tubes and by retro-orbital puncture (1 mL) after 4 days of MI.
- Allow the kit and blood sample to be at room temperature before the test. Check the expiry date on the back of the foil pouch. Open the foil pouch and check the test device (Figure 4).
- Insert the test device into the test slot of the analyzer. The analyzer reads the barcode data and checks the test device is valid (Figure 4).
- Collect 100 µL of sample with a fixed volume dropper (100 µL). Dispense the collected sample into the extraction buffer tube. Then, discard the used fixed volume dropper (100 µL).
- Mix the sample and buffer 2x-3x with the disposable dropper (100 µL). Then, collect 100 µL of the sample mixture.
- After applying the sample in the sample well of the test device, immediately press the TEST START button of the analyzer. The analyzer will automatically display the test result within 10 min.
NOTE: If Troponin I (TnI) is present, it will be bound to the europium microparticle. This complex will be captured by the capture antibody on the test line, and the intensity of fluorescence light will be detected by the analyzer.
8. Analysis of the infarction area
- After sacrificing the rats 4 days post-infraction, determine the area of infarction using the macroscopic method of 2,3,5-Triphenyltetrazolium chloride (TTC) dye.
- Remove the heart from the animal body and keep overnight at 4 °C. Excise both the auricles, the root of the aorta, and the right ventricle. Cut the frozen left ventricle into 2-4 mm-thick slices using a surgical blade. Incubate the ventricular slices at 37 °C in 1% TTC solution (prepared using 0.1 M Tris buffer maintained at pH 7.8) for a duration of 20 min.
- Analyze the staining pattern as the viable myocardium, which contains a dehydrogenase enzyme and a cofactor NADH, stained brick red with TTC due to the formation of a formazan, whereas the myocardial area that undergoes infarction remains unstained.
- Determine the infarcted area by volume method.
- Place ventricular slices between two glass slides and a transparent plastic grid with 100 squares in 1 cm placed over it.
- Calculate the average area of each ventricular slice by counting the number of squares on either side. Similarly, calculate the number of squares falling on stained and unstained areas on both sides. The non-stained dull yellow area represented the infarcted portion, and the red area represented the viable portion.
- Express the infarct size as a percentage of total left ventricular volume (%LVV).
9. Histopathological analysis
- Hematoxylin and eosin staining
- For histopathological findings, sacrifice the animal 4 days post-LAD ligation, remove the heart, wash with phosphate buffer (PBS, pH 7.4), and preserve in formalin solution (10%) immediately.
- Perform tissue processing by dehydrating the tissue for 1 h in a series of increasing alcohol concentrations (70%, 80%, 95%, 95% and absolute alcohol) so that water is removed from the tissue and alcohol enters inside the tissue. Perform clearing of alcohol from tissue by immersion in xylene.
- After clearing, transfer the tissue using forceps to molten paraffin wax in a stainless steel mold. The clearing agent diffuses out, and the molten wax infiltrates into the tissue. Chill the mold on the cold plate to solidify the paraffin. When the wax is completely cooled and hardened (30 min), remove the paraffin block easily from the mold.
- Cut the paraffin blocks containing embedded tissue into sections of 4 µm thickness using a microtome. Place the ribbon of paraffin sections in a water bath at 40-45 ˚C. Mount the sections on a slide and air dry or gently warm the slide. Then, deparaffinize the sections by washing them with xylene and rehydrating them with absolute alcohol and water.
- Stain with hematoxylin for 15 min. Wash the stained sections with water and treat them with a 1% acid alcohol mixture for 20 s.
- After washing with water, stain the sections with counterstain (1% aqueous solution of eosin) for 2 min. Observe the slides under the microscope to visualize histopathological changes at 10x and 40x magnification.
- Masson trichrome staining
- Prepare the following reagents.
- Bouin's Solution: Add 75 mL of saturated Picric acid, 25 mL of 40% Formaldehyde, and 5 mL of Glacial acetic acid. Weigert's Iron Hematoxylin Solution: Prepare stock solution A containing Hematoxylin 1 g in 100 mL of 95% alcohol. Prepare stock solution B containing 29% Ferric chloride in 4 mL of water, 1 mL of concentrated hydrochloric acid, and 95 mL of distilled water. Add equal parts of stock solution A and B for use. The mixture is only stable for no more than 3 months.
- Biebrich Scarlet-Acid Fuschin Solution: Add 90 mL of 1% aqueous Biebrich Scarlet, 10 mL of 1% aqueous Acid fuschin, and 1 mL of Glacial acetic acid. Phosphomolybdic-Phosphotungstic Acid Solution: Add 25 mL of 5% Phosphomolybdic acid and 25 mL of 5% Phosphotungstic acid. Aniline Blue Solution: Add 2.5 g of Aniline blue and 2 mL of glacial acetic acid to 100 mL of distilled water. 1% Glacial Acetic Acid Solution.
- Deparaffinize the paraffin-embedded heart sections using xylene, followed by rehydration in different concentrations of alcohol.
- Incubate the heart sections with Bouin's solution for 30 min at 56 °C to increase the final color intensity. Rinse the sections in running tap water until the yellow color is removed.
- Stain the tissue with hematoxylin for 1 min then, wash with running tap water for 2-3 min. Stain the sections with Biebrich scarlet-acid fuchsin solution for 15 min.
- Differentiate with 5% phosphomolybdic - phosphotunstic acid for 5 - 8 min. Transfer the section directly (without rinsing) to an aniline blue solution for 6- 8 min.
- Wash with distilled water. Then, differentiate with 1% acetic acid solution. Dehydrate with 95% ethanol, clear with xylene, mount on the slide, and examine under a microscope12.
- Prepare the following reagents.
Results
Endotracheal intubation is necessary to assist ventilation during the LAD ligation procedure involving open-chest thoracic procedures in rats. Successful intubation is confirmed by basal respiratory parameters before surgery and the maintenance of stable respiration, tidal volume, and minute volume during the surgical procedure (Figure 5).
The success of the LAD ligation procedure was confirmed by evaluating cardiac Troponin T and Troponin I as biochemical markers of myocardial injury13, measuring the infarct size, and observing histopathological changes. Cardiac troponin (cTn) protein interacts with actin filaments and regulates the contraction and relaxation of cardiac muscles. The two isotypes of troponin present in the heart, namely troponin I (cTnI) and troponin T (cTnT), are released in blood after damage to myocardial cells13. Troponin T (cTnT) level is detected using TropT qualitative kit. The test strip contains two monoclonal antibodies, one gold-labeled and the other biotinylated antibody specific for troponin T (cTnT), which forms the sandwich complex with troponin present in the blood sample. If the concentration of Troponin T exceeds 0.1 ng/mL, cTnT sandwich complexes gather along a line, appearing as a red detection line, indicating that the result is positive. Excess gold-labeled antibodies gather along the control line, indicating the validity of the test. Standard F analyzer 200 is a fluorescent immunoassay system used for quantitative determination of cardiac troponin I in serum and whole blood14. When a blood sample is applied into the sample well of the test device, it migrates through the membrane. If Troponin I (TnI) is present, it will be bound to the europium microparticle. The europium microparticle complex will be captured by capturing the antibody on the test line, where it is detected by the analyzer.
In the Sham group, Troponin T was undetectable in blood. The absence of Troponin T is related to the absence of infarction. In LAD-ligated animals, the presence of a detection line indicates positive results for Troponin T (i.e., the concentration of Troponin T in the blood sample is > 0.1 ng/mL; Figure 6). Similarly, serum Troponin I levels detected by the analyzer were increased after 6 h and 4 days of infarction as compared to the sham group (Table 1).
TTC staining revealed that the exposure of ischemia produced by LAD ligation resulted in damage to the myocardium as demonstrated by a significant rise in infarct size (52.01% ± 2.5%) as assessed by volume method in comparison to the sham group (4.8% ± 0.72%; Figure 7).
The histopathological section of rat heart tissue of the sham group shows the normal architecture of cardiomyocytes with nucleus and branching. In LAD-ligated rats, derangement and degeneration of cardiomyocytes were observed (Figure 8).
Masson's Trichrome staining is a histological technique commonly employed to identify collagen fibers in various tissues, including the skin, heart, and muscles. The procedure begins with Weigert's Hematoxylin, an iron-based hematoxylin dye that stains cell nuclei. This dye is particularly advantageous because it resists decolorization by acidic staining agents. Following this, a Biebrich scarlet-acid fuchsin solution is applied, which stains all acidic tissue components, such as cytoplasm, muscle fibers, and collagen. A solution of phosphomolybdic or phosphotungstic acid is used as a decolorizer to selectively differentiate collagen fibers. This step removes the Biebrich scarlet-acid fuchsin from the collagen, leaving the muscle tissue-stained red. Collagen fibers are then counterstained with aniline blue, and 1% acetic acid is added to enhance contrast between tissue components. As a result, collagen fibers appear blue, nuclei appear black, and the overall tissue background is red. Masson's Trichrome is especially useful in detecting post-myocardial infarction (MI) fibrosis. In stained heart sections, collagen fibers are observed as blue, while cardiomyocytes appear pink. Minimal fibrosis is typically noted in sham-operated hearts. In contrast, hearts from rats with left anterior descending (LAD) artery ligation exhibit substantial fibrosis, evidenced by intense intramuscular (grade 4+) and perivascular (grade 4+) collagen deposition, as shown in Figure 9.
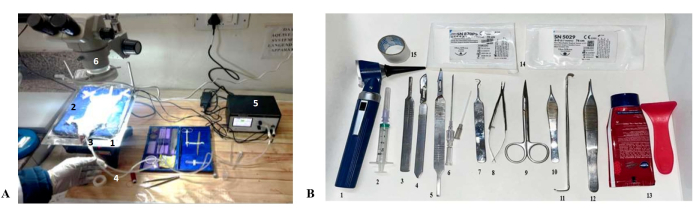
Figure 1: Experimental setup for endotracheal intubation. (A) An endotracheal cannula is inserted into the mouth with the help of an otoscope and connected to a ventilator. 1. Operation table, 2. Heating pad, 3. Endotracheal cannula 4. Endotracheal tube, 5. Ventilator, 6. Surgical Stereomicroscope. (B) Surgical tools required for LAD Ligation include 1. Otoscope, 2. Syringe, 3. Surgical blade holder, 4. Surgical blade 22G, 5. Surgical blade 24 G, 6. Cover gauge wire 7. Hooked cannula 8. Needle holder, 9. Curved scissors, 10. Forceps, 11. Retractor, 12. Adison forceps, 13. Hair remover, 14. Suture, 15. Tape. Please click here to view a larger version of this figure.
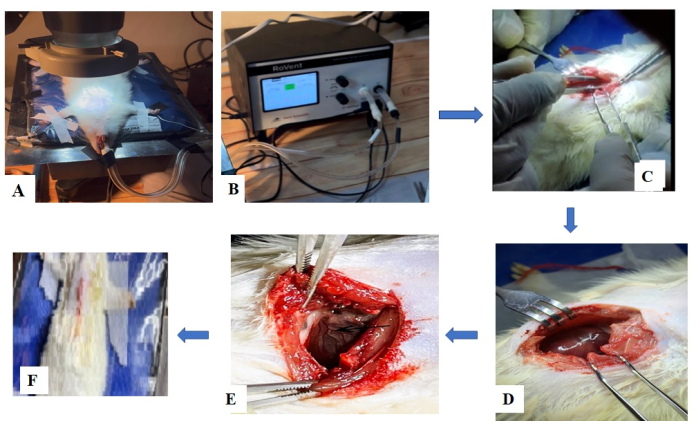
Figure 2: Surgical procedure for LAD ligation. (A) Endotracheal intubation in an anesthetized rat. (B) Attachment of endotracheal cannula with ventilator tube. (C) Starting surgery. (D) Cutting ribs and exposure of the heart by rib retractors. (E) Ligation of the coronary artery: After removal of the pericardium, LAD appears as a prominent red pulsatile artery extending from the margin of the left auricle toward the apex of the heart. The LAD gives off two septal branches (S1 and S2) that perforate the interventricular septum and two diagonal branches (D1 and D2) that perforate the anterior of the left ventricle. The stenosis can occur in proximal LAD, the portion of LAD from its origin to the first branch (either a septal or diagonal); mid LAD (the region between the first branch and the second diagonal branch), as well as distal LAD region beyond the second diagonal branch. In the present study, the ligation point lies in the first diagonal branch (D1) of LAD near its origin, indicated by a black arrow. (F) Suturing of the chest cavity and post-operative care. Please click here to view a larger version of this figure.
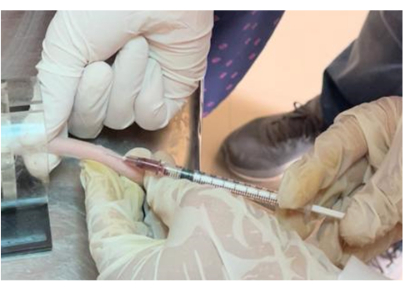
Figure 3: Administration of drug by tail vein. In the treatment group, the experimental drug under investigation was administered by intravenous route through the tail vein immediately after LAD ligation within one minute. Please click here to view a larger version of this figure.
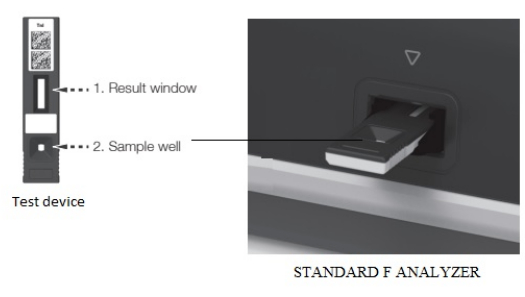
Figure 4: Test device to detect Troponin I. The test device contains a sample well. After inserting the test device into the test slot of the analyzer, the serum sample (150 µL) is applied into the sample well. Please click here to view a larger version of this figure.
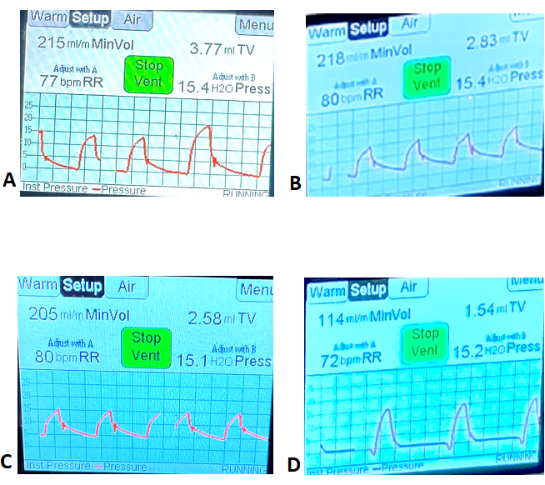
Figure 5: Representative images of respiratory parameters during surgery. Tidal Volume, Minute Volume, and Respiratory Rate (RR) were recorded after endotracheal intubation before surgery (basal respiratory parameters) and after surgery using the ventilator. (A) Sham group (baseline value); (B) Sham group (after surgery); (C) LAD ligation (baseline value); (D) After surgery. Please click here to view a larger version of this figure.
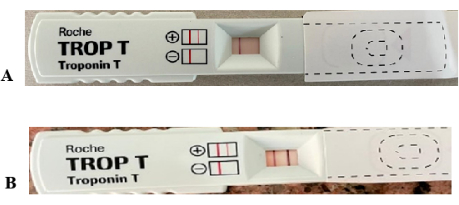
Figure 6: Troponin T level in blood after myocardial infarction. (A) Representative image of Sham group: no detection line indicates a normal sample with no infarction. (B) Representative image of LAD ligated animal: The presence of a red detection line indicates positive results for Troponin T (the concentration of Troponin T in the blood sample is > 0.1 ng/mL). Please click here to view a larger version of this figure.
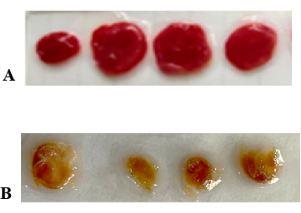
Figure 7: Representative images of TTC-stained sections of the ventricles of rats. Viable myocardium is stained red, and infarcted myocardium appears yellow. Infarct size was estimated by the volume method. (A) Sham, (B) LAD Ligation. Please click here to view a larger version of this figure.
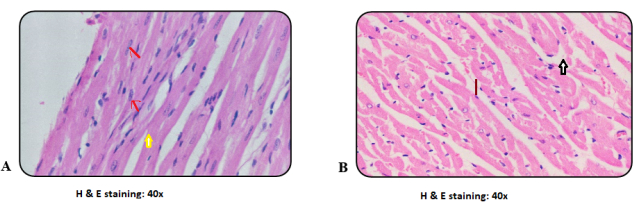
Figure 8: Histopathological changes of the myocardium by H and E staining. (A) Microphotograph of Sham group showing the normal architecture of regularly arranged myocardial fibers with central nuclei (red arrow) and branching (yellow arrow)at 40x.(B) Microphotograph of LAD ligated heart showing derangement (red line) and degeneration (white arrow) of myocardial fibers at 40x. Please click here to view a larger version of this figure.

Figure 9: Histopathological findings by Masson Trichrome staining. Representative images of ventricular sections, stained with Masson Trichrome stain, show the deposition of collagen fibers, indicated by blue stain. (A) Microphotograph of Sham (Normal) heart 10x, stained with Masson's Trichrome stain: minimal or nearly absent collagen deposition. (B) Microphotograph of LAD ligated heart (MI) 10x, showing increased intramuscular collagen (4+) and perivascular collagen (4+) as compared to sham hearts. Please click here to view a larger version of this figure.
| Troponin I (After 6 hours of Infarction) pg/mL | Troponin I (After 4 days of Infarction) pg/mL | ||
| Sham | Control | Sham | Control |
| 0.005 ± 0.001 | 44.33 ± 7.58a | 0.004 ± 0.0005 | 52 ± 5.71a |
Table 1: Serum Troponin I levels. Values are expressed as mean ± S.D. (n=3). Statistical analysis was performed by one-way ANOVA (for three groups: Sham, LAD ligation, and treatment group). Post-hoc test was performed for comparison between the control group and the sham group using t-test for Troponin I. a= **** p < 0.0001 versus Sham.
Discussion
Our present study represents the induction of Myocardial Infarction through permanent closure of the left anterior descending coronary artery (LAD) in rats. In this surgical protocol, anesthetic Ketamine 80 mg/kg administered by intraperitoneal route induced quick anesthesia, along with intraperitoneal administration of Xylazine 12 mg/kg, produced sufficient muscle relaxation, thereby facilitating the whole surgical procedure effectively as well as smooth post-surgery recovery after a short duration with minimal side effects. Similar anesthesia protocols at varying doses of Ketamine and xylazine have been established in previous studies, such as the administration of Ketamine 80 mg/kg and xylazine 10 mg/kg, which produced sufficient anesthesia desirable to perform surgery for induction of MI and a high survival rate after MI in rats15,16. Intubation of the endotracheal cannula was achieved successfully by placing the rat over a heating pad in a supine position on an inclined operating table by visualizing the vocal cords using an otoscope under a flashlight. In a previous study, Kastl et al. demonstrated that positioning the animal over an inclined metal plate and otoscope-assisted visual access to vocal cords facilitated intubation17.
In this technique, continuous warming by the heating pad and temperature monitoring by the ventilator through temperature sensing probes attached to the heating pad were crucial for the success of the whole surgical procedure of LAD ligation. The whole surgical procedure was performed under a stereomicroscope provided with an LED light source. Thoracotomy was carried out carefully by creating a small hole using forceps on the left side of the sternum at the third intercostal space. Excessive bleeding can occur during this step, leading to death during the operation. The entire surgical procedure was performed carefully with training and experience to prevent any injury to the heart or lungs, preventing bleeding from cutting the fascia and using wipes in case of bleeding during the procedure. After cutting the third, fourth, and fifth ribs with a rib cut nipper along with intercostal muscles, a rib retractor was used to spread the ribcage to expose the heart. In a recent study, these critical steps are demonstrated in a descriptive protocol18. While opening the chest cavity, pneumothorax (lung collapse) may be a cause of death during or after surgery. To avoid pneumothorax, open the chest cavity for a very short interval of time and adjust the PEEP at 2-7 cm H2O.
The most critical step is the identification of LAD and its branches. Careful removal of the pericardium facilitates the clear visualization and identification of LAD as a branch of the left main coronary artery, originating from the base of the aorta16. The ligation point of LAD critically determines the size of the infarction. Ligation at the proximal region results in higher infarct size and a high mortality rate19. This protocol involves ligation in the mid-LAD region, specifically at the origin of the first diagonal branch of LAD20. This protocol mimics the clinical syndrome of occlusive MI (OMI) arising due to occlusion of diagonal branch D1 of LAD21. A clinical case representing anterior wall myocardial infarction occurring due to a bifurcation lesion in the left anterior descending artery was reported by Kasturi et al.22. Angiographic findings detected 99% stenosis in the mid-region of the LAD coronary artery at the proximal site of the diagonal 1 (D1) branch22. Occlusion of the first diagonal branch (D1) of the left anterior descending artery (LAD) may produce isolated ST elevation in ECG lead I and aVL, V221,22. The significance of this protocol is developing an experimental model of acute myocardial infarction (acute coronary occlusion) representing occlusive MI (OMI).
Ligation of LAD using 8-0 silk suture resulted in myocardial infarction as confirmed macroscopically by staining with triphenyl tetrazolium chloride, an increase in Troponin T level in a blood sample (qualitatively estimated by appearance of red detection line, indicating Troponin positive, TnT > 0.1 ng/mL) and serum Troponin I (44.33 ± 7.58 pg/mL). The histopathological findings (Hematoxylin and Eosin staining) in rat heart tissue of the sham group show the normal architecture of cardiomyocytes with nucleus and branching. Meanwhile, in infarcted myocardium, the normal architecture of cardiomyocytes was disrupted, and loss of nucleus, vacuolization, and degeneration of cardiomyocytes were detected. After myocardial infarction, the infarcted portion undergoes tissue remodeling consisting of three phases: early inflammatory phase, during which macrophages and neutrophils clear the wound of necrotic cardiomyocytes; proliferation phase, during which endothelial cells and fibroblast proliferate to form vascularized granulation tissue and finally scar formation during which granulation tissue is converted into scar by deposition of collagen after apoptosis of endothelial cells and fibroblasts6. Thus, to detect changes occurring in the course of post-infarct remodeling, after 4 days of LAD ligation, heart sections were fixed with 10% formalin and stained with Masson trichrome stain. The presence of collagen deposition in both intracardiac muscle (4+) and in the perivascular region (4+) confirms cardiac remodeling 4 days post-MI.
ST-segment elevation (STE) on the electrocardiogram (ECG) has been considered a surrogate marker for acute coronary occlusion (ACO), allowing for rapid diagnosis and emergency revascularization. However, the vast research on the STEMI paradigm has revealed increasing anomalies: 25% of non-STEMI have ACO with delayed reperfusion and higher mortality21. Moreover, Meyers found that STEMI criteria missed 40% of OMI (defined as acute culprit with TIMI flow grade 0-2, or TIMI flow grade 3 with troponin T >1.0 ng/L)23. Acute occlusion of the first diagonal branch of the left anterior descending coronary artery (LAD-D1) may result in occlusive MI (OMI) with ischemic symptoms but STEMI (negative) and can be diagnosed by the South African flag pattern in ECG21. Thus, our model of Myocardial infarction may serve to understand the pathophysiological basis of infarction, aid in diagnosis, and develop novel targets or strategies against Myocardial infarction.
Limitations of the study procedure
The limitations of the procedure include, firstly, the ligation of the D1 branch of the LAD artery, which is technically challenging than LAD itself, requiring greater procedural time and experience to identify and perform ligation. Subsequently, animals show vast variations in sensitivity to ketamine, requiring careful dose adjustments ranging from 40 mg - 80 mg/kg ketamine and 5-12 mg/kg xylazine i.p. Moreover, prolonged recovery time from anesthesia in some animals and a greater risk for anesthetic-related complications can occur. Additionally, the surgical procedure was performed successfully in rats weighing > 200 g, where the D1 branch of the LAD artery was large enough to be ligated without delay. Finally, a minimal duration of chest opening was highly desirable under sterile and balanced environmental conditions, like temperature maintenance of the surgical area.
Disclosures
All authors have disclosed any and all conflicts of interest.
Acknowledgements
Dr. Ravi Kumar Dhawan, Principal, Khalsa College of Pharmacy, Amritsar, for providing guidance and support to purchase all surgical equipment; Management of Khalsa College Governing Council for providing funds; Dr. Harish Kumar Verma, Principal, Khalsa College of Veterinary and Animal Sciences, Amritsar for providing gift sample of Ketamine and Xylazine; Dr. Rekha Singh, Histopathology Department, Fortis Memorial Research Institute, Gurugram for Histopathology facilities and grading; Mr. Hemaant Arora, M.D., Universal Diagnostics providing facility for Troponin I evaluation; Dr Rachna Hora, Associate Prof, Department of Molecular Biology and Biochemistry for blotting techniques.
Materials
| Name | Company | Catalog Number | Comments |
|---|---|---|---|
| 18-Gauge intravenous cannula | Kent scientific, US | ||
| 20-Gauge intravenous cannula | Kent scientific, US | ||
| 4-0 Polypropylene suture | Khanna Surgical | ||
| 6-0 silk suture | Nanak Surgical | ||
| 8-0 silk suture | Nanak Surgical | ||
| Adson forceps | Nanak Surgical | ||
| Anaesthesia apparatus | Orchid Scientific | ||
| Anaesthesia induction chamber | Orchid Scientific | ||
| Curved scissors | Nanak Surgical | ||
| Endotracheal intubation tube | Kent Scientific, US | ||
| Hair removal cream | Nanak Surgical | ||
| Heating pad | Kent scientific, US | ||
| Hooked forceps | Nanak Surgical | ||
| Ketamine | Gift sample from KVAS, Amritsar | ||
| Micro needle holder | Nanak Surgical | ||
| Nitrile gloves | Nanak Surgical | ||
| Operation table | |||
| Otoscope | Nanak Surgical | ||
| Pean forceps | Nanak Surgical | ||
| Rib retractor | Nanak Surgical | ||
| Straight tweezer | Nanak Surgical | ||
| Strait nipper | Nanak Surgical | ||
| Surgical hair cap | Nanak Surgical | ||
| Surgical mask | Nanak Surgical | ||
| Surgical Stereomicroscope | Olympus Magnus | 24B1187 | Stereo zoom MSZ-TR microscope with arm boom stand, zoom ratio: 1:7 objective zoom: 0.65 - 4.5x Eyepiece 10x/22 mm Magnification : 6.5 - 45x with 10x eye piece LED ring illumination |
| Toothless forceps | Nanak Surgical | ||
| Tramadol | Gift sample from Amandeep hospital, ASR | ||
| Tweezers | Nanak Surgical | ||
| Ventilator | RoVent (Kent Scientific, US) | RV-04-220 | Automatic Ventilator with volume and pressure control and temprature warming and monitoring |
| Xylazine | Gift sample from KVAS, Amritsar |
References
- World Heart Report. , World Heart Federation. https://world-heart-federation.org/wp-content/uploads/World-Heart-Report-2023.pdf (2023).
- Lindstrom, M., et al. Global Burden of Cardiovascular Diseases and Risks Collaboration, 1990-2021. J Am Colleg Cardiol. 80 (25), 2372-2425 (2022).
- Byrne, R. A., et al. ESC guidelines for the management of acute coronary syndromes. Eur Heart J. 44 (38), 3720-3826 (2023).
- Widimsky, P., et al. Long distance transport for primary angioplasty vs immediate thrombolysis in acute myocardial infarction. Final results of the randomized national multi-center trial-PRAGUE-2. Eur Heart J. 24 (1), 94-104 (2003).
- Roth, G. A., et al. Global, regional, and national age-sex-specific mortality for 282 causes of death in 195 countries and territories, 1980-2017: a systematic analysis for the Global Burden of Disease Study 2017. Lancet. 392, 1736-1788 (2018).
- Frangogiannis, N. G. The mechanistic basis of infarct healing. Antioxid Redox Signal. 8, 1907-1939 (2006).
- Gill, J. K., Rehsia, S. K., Verma, E., Sareen, N., Dhingra, S. Stem cell therapy for cardiac regeneration: past, present, and future. Can J Physiol Pharmacol. 102, 161-179 (2024).
- Robich, M. P., et al. Myocardial therapeutic angiogenesis: a review of the state of development and future obstacles. Expert Rev Cardiovasc Ther. 9 (11), 1469-1479 (2011).
- Ahn, D., et al. Induction of myocardial infarcts of a predictable size and location by branch pattern probability-assisted coronary ligation in C57BL/6 mice. Am J Physiol Heart Circ Physiol. 286, H1201-H1207 (2004).
- Domino, E. F. Taming the ketamine tiger. 1965. Anesthesiology. 113, 678-684 (2010).
- Van Pelt, L. F. Ketamine and Xylazine for surgical anesthesia in rats. J Am Vet Med Assoc. 171, 842-844 (1977).
- Li, C., et al. Silver nanoparticles/chitosan oligosaccharide/ poly(vinyl alcohol) nanofiber promotes wound healing by activating TGFβ1/Smad signaling pathway. Silver nanoparticles/chitosan oligosaccharide/ poly(vinyl alcohol) nanofiber promotes wound healing by activating TGFβ1/Smad signaling pathway. Int J Nanomedicne. 11, 373-387 (2016).
- Thygesen, K., et al. Fourth universal definition of myocardial infarction. Eur Heart J. 40, 237-269 (2018).
- Radha, R., Shahzadi, S. K., Al-Sayah, M. H. Fluorescent Immunoassays for Detection and Quantification of Cardiac Troponin I: A Short Review. Molecules. 26, 4812(2021).
- Srikanth, G. V. N., Parkash, P., Tripathy, N. K., Dixit, M., Nityanand, S. Establishment of a rat model of myocardial infarction with a high survival rate: A suitable model for evaluation of efficacy of stem cell therapy. J Stem Cells Regen Med. 5 (1), 30-36 (2004).
- Lugrin, J., Parapanov, R., Kueger, T., Liaudet, L. Murine Myocardial Infarction Model using Permanent Ligation of Left Anterior Descending Coronary Artery. J Vis Exp. (150), e59591(2019).
- Kast, S., et al. Simplification of rat intubation on inclined metal plate. Adv Physiol Educ. 28, 29-32 (2004).
- Maruyama, K., et al. Anterior descending coronary artery in mice to generate a model of myocardial infarction. STAR Protoc. 2, 100775(2021).
- Pop, I. C., et al. Induction of a chronic myocardial infarction in the laboratory animal - experimental model. Clujul Medical. 86 (4), 334-339 (2013).
- Durant, E., Singh, A. Acute first diagonal artery occlusion: a characteristic pattern of ST elevation in noncontiguous leads. Am J Emerg Med. 33 (9), 1326.e3-1326.e5 (2015).
- McLaren, J., et al. From ST-Segment Elevation MI to Occlusion MI: The New Paradigm Shift in Acute Myocardial Infarction. JACC Adv. 3 (11), 101314(2024).
- Kasturi, S., Bandimida, S., Gajiwal, N., Thakkar, A. A Challenging Case of Bifurcation Lesion in Left Anterior Descending Artery: Managed Successfully with Everolimus-Eluting Bioresorbable Vascular Scaffold and Kissing Balloon Technique under Optical Coherence Tomography Guidance. Heart India. 3 (3), 79-81 (2015).
- Meyers, H. P., et al. Comparison of the ST-elevation myocardial infarction (STEMI) vs. NSTEMI and occlusion MI (OMI) vs. NOMI paradigms of acute MI. J Emerg Med. 60, 273-284 (2021).
Reprints and Permissions
This article has been published
Video Coming Soon