This workflow enables lamella production targeting fluorescently labeled biological structures that are small (<1 μm in axial extent) and rare (1 copy per cell) using a cryogenic tri-coincident imaging platform. This platform integrates fluorescence microscopy, focused ion beam milling, and scanning electron microscopy at a single focal position and enables simultaneous fluorescence microscopy while milling.
Method Article
Workflow Using a Cryogenic Coincident Fluorescence, Electron, and Ion Beam Microscope for Targeted Milling of Cells
In This Article
Summary
Abstract
Cryogenic focused ion beam milling with scanning electron microscopy (CryoFIB-SEM) has become the dominant approach for preparing sub-200-nm thick lamellae of cells for cryogenic electron tomography (CryoET). Recently, fluorescence microscopy has been incorporated into CryoFIB-SEM systems to guide lamella production toward fluorescently labeled targets. However, in most implementations, the optical and ion beam imaging systems have distinct focal planes in different regions of the vacuum chamber—functioning effectively as two separate microscopes. This configuration requires image registration between modalities, which often lacks the accuracy needed to reliably target small, rare structures in situ. We present a workflow based on a customized tri-coincident imaging platform that enables simultaneous fluorescence imaging and focused ion beam milling. This allows for real-time fluorescence feedback that can be used to determine when to terminate milling in order to preserve fluorescently labeled structures of interest in the final lamella. Using this approach, we targeted the microtubule-organizing center (MTOC) in vitrified macrophages and achieved a >60% success rate, confirmed by subsequent cryogenic electron tomography and correlative light and electron microscopy.
Introduction
Cryogenic electron tomography (CryoET) enables visualization of biological specimens in a near-native state at macromolecular resolution1,2,3,4,5,6,7,8,9,10,11. However, the thickness of eukaryotic cells — often several microns — exceeds the mean free path (~300 nm) of 300 kV electrons, limiting the penetration depth of unscattered electrons and thereby restricting usable sample thickness. To address this, a focused ion beam (FIB) can be used to ablate most of the cryogenically preserved cell in a process known as CryoFIB milling, producing lamellae thin enough for CryoET imaging12,13,14,15,16.
In previously reported workflows, samples are first preserved in vitrified ice via plunge freezing17,18,19 and then loaded into a dual-beam instrument equipped with both a CryoFIB and a scanning electron microscope (SEM). SEM imaging can be used to identify subcellular features of interest such as organelles and even some proteinaceous structures20,21. This information can be used to direct the CryoFIB milling process, where the sample is ablated in a stepwise manner with the goal of producing a sub-200 nm thick lamella suitable for CryoET13,14,22. However, this approach presents two key challenges that the present protocol addresses. First, it is often necessary to obtain CryoET of specific proteinaceous structures, but the SEM can be damaging, and most proteinaceous structures are not discernible by the SEM when imaging unstained biological material. How can milling be accurately guided to specific subcellular regions or regions containing specific biomolecules in a damage-free manner? Second, even after the production of thin lamellae and subsequent CryoET, it can be challenging to identify specific biomolecules in the final reconstructions due to insufficient resolution, signal-to-noise ratio, and/or contrast required for the unambiguous identification. How can the spatial positions of these biomolecules be determined within cryo-ET reconstructions?
To address both challenges, the field has increasingly turned to fluorescence microscopy. Genetically encoded fluorescent proteins or exogenous dyes that bind target proteins are routinely used to label specific biomolecules of interest5,23,24. Cryogenic fluorescence microscopy of vitrified cells taken after milling can be correlated with the resulting tomograms. This approach, known as cryogenic correlative light and electron microscopy (CryoCLEM), is well-established and has been widely used to localize specific proteins within CryoET reconstructions5,12,23,24. Recent advances include the use of fluorescent biosensors and super-resolution methods to enhance complementary information and spatial precision25,26,27,28,29.
CryoCLEM is one way to overcome the second challenge identified above, permitting the location of specific proteins within the lamella to be determined. However, CryoCLEM does nothing for the user if the final lamella does not contain the proteins of interest. Thankfully, fluorescence microscopy can also be used to direct milling to labeled regions of interest. While fluorescently guided FIB milling is a newer development than CryoCLEM, initial workflows emerging about a decade ago12, it has found rapid and widespread adoption. The early protocols relied on external light microscopes to acquire 2D or 3D fluorescence datasets, which were then registered to SEM and ion beam images after transferring the sample into the CryoFIB-SEM. More recently, fluorescence microscopes have been integrated directly into CryoFIB-SEM vacuum chambers. This integration reduces ice contamination during transfers and enables imaging of the final lamella more easily. Several platforms have now been developed to combine fluorescence microscopy with CryoFIB-SEM for fluorescence-guided milling. These have successfully targeted organelles and large protein complexes5,23,24. However, with few exceptions30, the optical path produces a separate focal plane in a different physical region of the vacuum chamber from the FIB-SEM. As a result, precise registration between fluorescence and ion images is still required to direct milling, just as is required with the use of stand-alone optical microscopes.
This registration process is prone to inaccuracy due to three key factors: refractive index mismatches (which cause apparent focal shifts)31,32, sample motion during milling, and localization error. Further, registration is typically aided by micron-sized fluorescent fiducials that are visible in both ion and optical modalities and are used as alignment point pairs to compute transformations between the ion and optical images. However, these beads can obscure or compete with the fluorescence signal from the sample, and their localization and alignment across optical and ion images is slow and user-intensive. Together, these limitations have hindered the routine targeting of small and rare features. While it is difficult to define a precise limit to the structures that can be currently preserved in thin lamella, registration-based approaches are generally considered ineffective for capturing targets with axial dimensions below one micron33.
Here, we report the use of a tri-coincident imaging system that integrates FIB, SEM, and fluorescence microscopy at a single focal position34,35. This configuration allows for simpler and more accurate fluorescence-guided milling compared to non-coincident integrations by removing the need to register optical and ion images. Under ideal conditions of low background and high signal, guidance accuracy on the order of 10 nm can be achieved36. It also permits the acquisition of multicolor cryogenic fluorescence microscopy data throughout the milling process, including from the final thin lamella, enabling correlative analysis and localization of sub-diffraction-limited targets35. To accomplish this, we employ a customized image transformation toolkit to precisely align these fluorescence images with low-magnification transmission electron microscopy to determine where to collect CryoET, streamlining data collection and ensuring target capture in the final tomographic reconstructions.
To guide milling, we exploit the system's ability to monitor changes in fluorescence intensity in real time. Instead of trying to align optical and ion images to find our target, the user simply watches the fluorescent signal from the sample. As milling progresses, the fluorescence behaves in a very characteristic way: it first gets brighter as the carbon support film between the microscope objective and the fluorescently labeled sample is removed, then gradually declines as out-of-focus autofluorescent material is milled away, and finally, decreases sharply as the labeled structure itself is partially removed. This real-time signal determines precisely where one is in the milling process and when to stop milling, ensuring that the target of interest is retained within the final lamella37. In the detailed protocol, we will also discuss a more advanced approach that uses oscillations in fluorescence brightness due to interferometric effects to guide milling to objects that are <300 nm in axial extent.
We demonstrate the utility of the platform by targeting the microtubule-organizing center (MTOC)38. The MTOC is a critical organelle involved in cell division and differentiation. In mammalian cells, fluorescence microscopy of labeled tubulin reveals the MTOC as a single fluorescent punctum approximately 1 µm in diameter in live cells. This approach has been used to successfully localize the MTOC with high fidelity to thin lamellae of vitrified cells. The detailed organization of microtubules at the MTOC and their interactions with other organelles are revealed in subsequent tomographic reconstructions. This workflow enables high-precision correlative fluorescence microscopy and CryoFIB-SEM without registration, reducing user input and expanding access to cellular structures that were previously prohibitively small to capture robustly with non-coincident approaches.
Definitions and instrument description
The integrated optical microscope is described in detail in Boltje et al.35, and further details on the use of the integrated microscope can be found in a recently published protocol34. The objective is integrated from below and equipped with x, y, and z positioning capabilities to enable alignment with the FIB-SEM coincident point. It currently operates with a 100x, 0.85 NA objective with a coverslip corrector.Optical imaging is performed through a coverglass, which protects the objective from sputtered material and irradiation from both the FIB and SEM.Widefield illumination is provided by a set of LEDs spanning multiple visible wavelengths.Fluorescence detection is accomplished using an sCMOS detector.There are three defined stage positions: loading: the stage position where the sample is loaded; coating: the stage position for coating via the gas injection system; 3-Beam: the stage position for which all three (FIB, SEM, and optical) microscopes can be co-aligned.
Protocol
NOTE: The tri-coincident system used here is a customized cryogenic fluorescence imaging component integrated into a commercially available, dual-beam FIB-SEM system. The principle and order of operations can be generally adapted to future tri-coincident implementations.
1. Setup
- Cool the system to cryogenic temperature. Monitor the temperature using two sensors: one located on the sample stage and the other inside the chamber. Maintain the sample stage approximately 20 °C warmer than the chamber (e.g., stage at ~-170 °C, chamber at ~-190 °C) to minimize ice buildup on the sample. The cooling process typically takes about 1.5 h.
2. Sample loading
- Use liquid nitrogen to manually cool the transfer station once the system temperature approaches cryogenic temperature (approximately -167.5 °C). The system temperature is displayed in the top-left corner of the light microscopy software.
- Load one clipped Autogrid into the sample cassette designed for the cryogenic light microscopy system. The cassette consists of a glued coverslip and a spacer, with the Autogrid positioned between them. Close the cassette by tightening the ring screw, then insert it into the slot on the transfer station34.
- Attach the transfer station to the system and use the internal chamber camera to guide the sample cassette onto the sample stage.
3. Gas injection system (GIS) for sample coating
- Open the light microscopy control software and move the sample stage from the Loading to Coating position.
- Insert the GIS needle using the FIB-SEM control software by clicking the Snowflake icon. Under GIS control, choose the option insert GIS needle.
- Allow GIS deposition for 30 s by opening the gas flow.
NOTE: This varies from 20 s to 1 min based on the sample type. The goal of this step is to sufficiently protect the sample during the subsequent FIB milling procedure. - Retracting the GIS needle, move the sample stage back to the predefined Loading position.
4. Three-beam system alignment
NOTE: This section is adapted from Wang39.
- In the light microscopy software, move the sample stage from the Loading position to the predefined 3-beam position.
- In the FIB-SEM software, click on the top left window and set the SEM at a magnification of 100x.
- In the light microscopy software's Alignment tab, click the View function to acquire an SEM atlas of the grid. This atlas image uses previously set parameters.
- Identify a square area with broken carbon film and double-click on it to move the sample stage to that location.
- Return to the FIB-SEM control software and adjust the SEM to a higher magnification to focus on the selected square area, centered in the field of view.
- Repeat steps 4.4 and 4.5 as needed until the SEM is focused on a distinguishable pattern, such as the sharp edge of a broken carbon film.
- Turn on the fluorescence microscope and adjust x, y, z coordinates to match the SEM view.
- Mill a small pattern with the FIB, for instance, a small rectangle or circle.
- Confirm the pattern is visible in both the FIB and fluorescent microscope views. If necessary, adjust the alignment by following steps 4.3-4.7 if necessary.
NOTE: Alignment and registration of the optical and ion microscopes are complete.
5. Target localization and milling
NOTE: This section is adapted from Wang39.
- Move on to the Localization tab in the light microscopy software, and set up fluorescent channels by activating proper excitation and filtering conditions. Assign each fluorophore as a separate channel and include an additional channel for transmitted light (or brightfield).
- Identify the target of interest by tuning the LED power and exposure time for each fluorescent channel. As a reference, when imaging SiR-tubulin, use a 1.2 s exposure with a constant LED power setting of 30 mW.
NOTE: Parameters may vary between fluorophores. Optical intensity should remain below ~25-50 W/cm2 at the sample. Greater intensity than this can result in significant heating and devitrification of the sample37,40. - Once satisfied with parameters, acquire a pre-milling fluorescent z-stack stepping through the axial direction. Then, mark the target as an ROI.
- Switch to the FIB-SEM software to draw a lamella at the ROI.
- Perform rough milling to remove the bulk of material approximately 3 µm above and below the ROI. Meanwhile, keep the fluorescence microscope on during milling to monitor any decrease in fluorescent signal.
- Thin the ROI to ~2 µm using the cleaning cross-section mode.
- Open the Python-based interferometric toolkit from the terminal to monitor the fluorescent signal while thinning the lamella (https://github.com/pdahlb/trico_softwaresuite)36.
- For subsequent milling and polishing, follow one of the two approaches described below in steps 5.9 or 5.10 to direct milling based on the dimensions of selected targets.
- Axial extent of target > 300 nm
NOTE: Here we will use a semi-destructive approach to direct milling.- In the Python-GUI, select the target of interest in the fluorescence micrograph. The software will automatically begin plotting the brightness as a function of time with each new frame.
- Monitor fluorescence intensity through the Python toolkit. Mill the sample in cleaning-cross-section mode from below to remove any remaining support film material if applicable.
NOTE: When the support film is removed, an enhancement in fluorescence should be observed. - Use rapid drops in fluorescence intensity — indicating loss of fluorescent material — as a cue for when to switch milling directions. For example, if milling from the bottom up and a sharp decrease in fluorescence is observed, stop milling and switch to milling from the top down.
NOTE: If a structure is removed too quickly, reduce the milling current in the FIB-SEM software to slow down the removal of the target.
- Axial extent of target ≤ 300 nm
NOTE: Here, we will use the interferometric effect to direct milling36.- In the Python-GUI, select the target of interest in the fluorescence micrograph. The software will automatically begin plotting the brightness as a function of time with each new frame.
- Begin by milling from the top down through a test target. Monitor the fringe contrast just before milling through the target through the fluorescence intensity. The fluorescence target is continually fit to a 2D Gaussian, with the fit being used to get an integrated intensity that is then plotted.
- After the target is milled through, fit the oscillations in the intensity trace to the following model function using the Python-GUI:

Where A is the amplitude of the oscillation, λ the wavelength of excitation, k a dampening term representing the coherence length of the light source, a phase factor Φ, and d is the distance to the object of capture. From the test target, all terms can be predicted within reasonable bounds such that the distance, d, is the only free variable used to tell the user where the fluorescent object is relative to their milling. See Sica et al. for more details36.
NOTE: For subsequent targets, the toolkit will live-fit the intensity trace with the same model function and estimate where to stop milling from the top down. All fittings are done simultaneously with the milling. The goal is to halt milling when the target lies at a depth equal to half the desired lamella thickness below the top surface. - After top-down milling is complete, finalize the lamella by milling from the bottom up in cleaning cross-section mode until the desired thickness is achieved.
- Axial extent of target > 300 nm
- Take a post milling fluorescence image.
6. Correlative light microscopy and tilt series collection
- After transferring the sample to CryoTEM, collect an atlas overview of the grid at 182x to allow sufficient coverage of the entire grids.
- At an appropriate intermediate magnification ranging from 6,500x to 11,000x, collect a series of montage images of the final lamella at 0° tilt.
- Read the post milling multi-channel fluorescence images and the projection image from step 6.2 into a custom projective transformation software for ROI registration (https://github.com/pdahlb/CLEM_software_suite.git).
- Pick a total of 8-10 pairs of reference points to precisely compute the projective image transformation.
NOTE: These points can be obvious features (e.g., lamellae edges, visible ice contamination, or open grid holes) that are present in both brightfield optical microscopy and electron microscopy.
7. High magnification tilt-series collection
- Use this overlaid fluorescence and transmission electron microscopy image as a reference for users to select an imaging area within the limit of the camera frame size for high magnification tilt-series collection.
- Select magnification and parameters of the tilt-series based on the biological question.
NOTE: For the demonstration, we collected data from 54° with 2° increments at a pixel size of 3.5 Å41,42,43.
Results
We labeled differentiated macrophage cells with the tubulin marker SiR-tubulin prior to freezing. Following the protocol, we identified the MTOC as a single ~ 1 µm-diameter fluorescent punctum under the fluorescence microscope (Figure 1A). Additionally, we observed fibril-like fluorescent structures radiating from the MTOC toward the cell periphery, consistent with the microtubule network (Figure 1A). Stepwise milling snapshots at different specimen thicknesses are shown in Figure 1B. Notably, as the lamella reached a thickness of approximately 800 nm, the single MTOC punctum resolved into two adjacent speckles, each about 700 nm in diameter. Subsequent analysis confirmed that each speckle corresponded to an individual centriole.
Simultaneous imaging and milling allowed us to monitor changes in fluorescence intensity in real time. Notably, we observed an increase in fluorescence after the removal of bulk non-fluorescent material and the absorptive support film (Figure 1B-D). As the lamella was thinned from 2 µm to 800 nm, fluorescence intensity sharply decreased, reflecting the progressive removal of labeled structures. This decline continued as the lamella was further thinned below 200 nm (Figure 1B-D). The correlated fluorescence image and electron microscopy atlas demonstrate that our workflow enables precise targeting for milling (Figure 2A). Reconstructed tomograms and segmented models reveal that the centrioles are composed of microtubule triplets, consistent with previous reports42,43,44,45 (Figure 2A,B). In cases where only one fluorescent speckle is preserved in the final lamella, we observe a single centriole in the corresponding tomogram (Figure 2B).
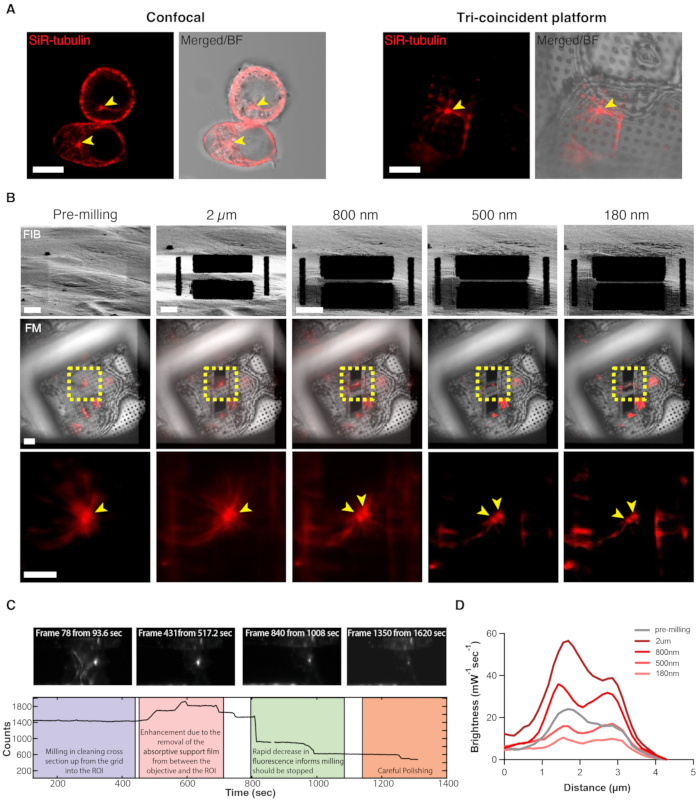
Figure 1: Workflow of tri-coincident CryoFM-FIB-SEM for precise localization of the microtubule-organizing center. (A) (left) Live cell microscopy and (right) CryoFM of the MTOC. Scale bar = 10 µm. (B) Stepwise snapshots of CryoFM and CryoFIB for targeted milling. Close-up FM view is indicated as yellow dashed boxes. Centrioles are marked as yellow arrows. Scale bar = 5 µm. (C) Fluorescence intensity of MTOC during CryoFIB milling. (D) Fluorescence line profile across the MTOC taken at different stages during CryoFIB milling. Abbreviations: CryoFM-FIB-SEM = Cryogenic fluorescence microscopy with focused ion beam milling and scanning electron microscopy; MTOC = microtubule-organizing center; ROI = region of interest. This figure is adapted from Wang39. Please click here to view a larger version of this figure.
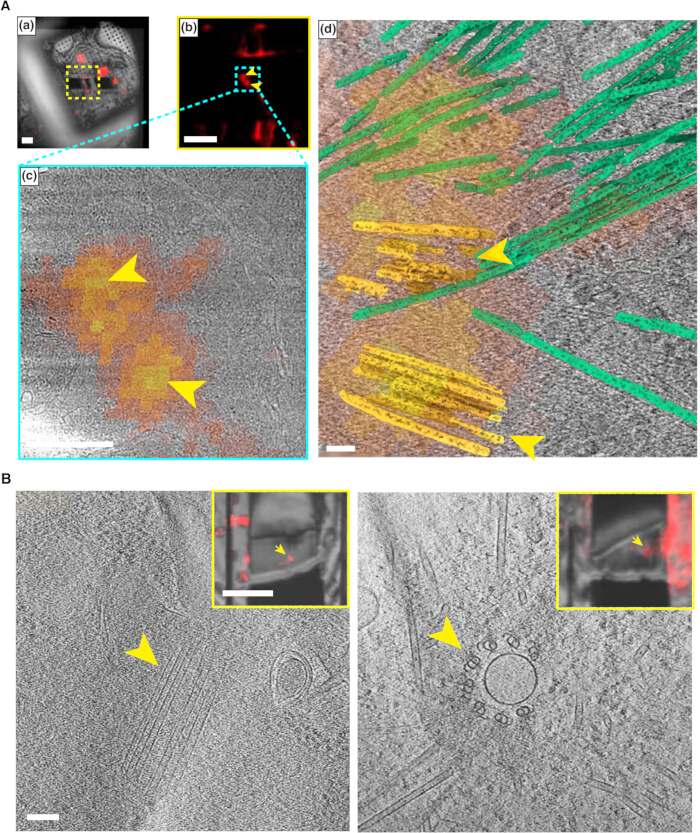
Figure 2: Molecular details of the MTOC revealed by tri-coincident CryoFM-FIB-SEM workflow. (A) Correlated FM, EM, and segmentation model of the MTOC. (a) Post milling FM image. This is the same image from the last panel of Figure 1B marked as 180 nm but rotated to match the CryoET reconstruction and segmentation. Scale bar = 5 µm; (b) Enlarged view of the dashed area in yellow from (a). (c) Correlated FM and TEM projection of the dashed area in cyan indicated in (2). Scale bar = 1 µm. (d) Segmented model of tomographic reconstruction at the region of interest (yellow, centriole; green, microtubule). Scale bar = 100 nm. (B) Representative FM images and tomographic slices of two different lamellae presenting different centriole orientations. FM: Scale bar = 5 µm. Tomographic slice: Scale bar = 200 nm. Abbreviations: CryoFM-FIB-SEM = Cryogenic focused ion beam milling with scanning electron microscopy; MTOC = microtubule-organizing center; FM = fluorescence microscopy; ET = electron transmission; TEM = transmission electron microscopy. This figure is adapted from Wang39. Please click here to view a larger version of this figure.
Discussion
Our results highlight the utility of the tri-coincident imaging platform, which enables simultaneous fluorescence imaging and milling. Leveraging this feedback, we demonstrate two fluorescence-guided milling strategies — semi-destructive and interferometric — that avoid the need for cumbersome and registration-based approaches that face fundamental accuracy limitations related to refractive index mismatch and motion during milling12,33,46. Further, since the precise guidance relies on fluorescence microscopy rather than SEM, the optical radiation does not lead to detectable damage so long as the intensity is kept below the threshold that leads to devitrification37,47. The capabilities demonstrated here expand the accessible biological samples to include rare and small (<300 nm in axial extent) targets of interest while streamlining the workflow.
The key step in this protocol is determining when to stop milling based on changes in fluorescent brightness of a target of interest. Currently, this involves rapid manual intervention to stop milling at desired times. This method has proved sufficient for the current targets that have been explored, but future modification could further integrate the Python toolkit into the FIB system to directly stop milling. This modification may be necessary if faster milling rates are required, as this will give less time for manual intervention. Alternatively, if slower milling rates can be tolerated, this will give more time for manual intervention if needed.
Following the generation of lamella-containing biological structures of interest, our customized image transformation software enables correlation at the CryoTEM level, using atlas overviews of lamellae to guide CryoET data collection. Overall, the protocol presented here is essential for imaging fluorescently labeled, small, and rare biological targets by cryogenic electron tomography in thick eukaryotic cellular samples. Compared to existing non-coincident Cryo-FIB systems, such as the Aquilos 2 with iFLM, our workflow achieves a higher success rate in targeting these features.
This high targeting precision does come at the cost of efficiency. Because the milling is manual rather than automated, the throughput of lamella generation is limited. In an 8 h milling session, we typically produce 6-8 lamellae, with approximately five containing a target of interest. However, we believe this workflow could be automated in the future to improve throughput. Automation would require custom scripts to continuously monitor active milling areas in the FIB image and track fluorescence intensity in real time to ensure target retention. Key challenges remain, including establishing effective communication between all custom scripts and the control software for both the CryoFIB-SEM and the fluorescence microscope.
Looking towards the future, there is much work to be done to incorporate other advanced fluorescence microscopy techniques discussed earlier, including fluorescent biosensors, super-resolution imaging, and confocal microscopy. Nonetheless, we anticipate that tri-coincident geometries will become standard in future instruments and that simultaneous fluorescence imaging during milling will become routine. If so, this protocol may serve as a valuable guide for researchers aiming to capture molecular-scale details of the small and rare biological structures, that despite their size and abundance, are central to cell biology.
Disclosures
The authors have no conflicts of interest to disclose.
Acknowledgements
We would like to acknowledge members from Delmic for their help with imaging workflow development. P.D.D. was supported in part by the Panofsky Fellowship at the SLAC National Accelerator Laboratory as part of the Department of Energy Laboratory Directed Research and Development program under contract DE-AC02-76SF00515 and by the Department of Energy, Office of Science, Office of Biological and Environmental Research, under Contract No. DE-AC02-76SF00515 FWP 100883. This work was supported in part by grant AI127401 from the National Institutes of Health to G.J.J. J.W. was supported by grant 2021-234593 from the Chan Zuckerberg Initiative DAF, an advised fund of Silicon Valley Community Foundation.
Materials
| Name | Company | Catalog Number | Comments |
|---|---|---|---|
| Aquilos 2 Cryo-FIB | ThermoFisher Scientific | https://www.thermofisher.com/us/en/home/electron-microscopy/products/dualbeam-fib-sem-microscopes/aquilos-cryo-fib.html?cid=msd_ls_xseg_xmkt_sdb-aquilos_285811_na_pso_gaw_pei90m &gad_source=1&gad_campaignid=12 764255901&gbraid=0AAAAADxi_GS s7OvZmg4cgCUm0PjSiq9X9&gclid= Cj0KCQjwh5vFBhCyARIsAHBx2w xlIfYHMvqY3sSWu6oEAdUynCSf9 KRg9Jhjp7l0Dot9qTl6GyQaEo8aAiy 2EALw_wcB | |
| Autogrid compatible cryo grid box | Electron Microscopy Sciences | https://www.emsdiasum.com/autogrid -compatible-cryo-grid-box?srsltid= AfmBOorQAd3esD8fLmnDDO2TvrNk cj4UINXFnPSMgrpEmkWd0H7ImUq7 | |
| Autogrid rings and C-clips | Nanosoft | https://www.nanosoftmaterials.com/product-page/100-pack-autogrid-rings-c-clips | |
| CLEM Software Suite | Dahlberg Research Group at Stanford/SLAC | https://github.com/pdahlb/CLEM_software_suite.git | |
| Dragonfly 2022.1 | Object Research Systems | https://dragonfly.comet.tech/ | |
| ENZEL | Delmic B. V. | ENZEL system is a customized instrument and currently not commercially available | |
| IMOD 4.12 | University of Colorado | https://bio3d.colorado.edu/imod/ | |
| LD4 liquid nitrogen dewar | Nanosoft | https://www.nanosoftmaterials.com/product-page/ld4-liquid-dewar-4-liters | |
| MATLAB 2023 | MathWorks | https://www.mathworks.com/products/matlab.html | |
| Pin lid manipulator tool | Nanosoft | https://www.nanosoftmaterials.com/product-page/pin-lid-manipulator-tool | |
| Python toolkit | Dahlberg Research Group at Stanford/SLAC | https://github.com/pdahlb/trico_softwaresuite | |
| Quantifoil R2/2, LF, 200 mesh, Au EM grid | Electron Microscopy Sciences | https://www.emsdiasum.com/quantifoil-r-22-lf-200-mesh-gold | |
| Serial EM | University of Colorado Boulder | https://bio3d.colorado.edu/SerialEM/ | |
| Spearlab standard vessel (transfer dewar) | Nanosoft | https://www.nanosoftmaterials.com/product-page/spearlab-standard-vessel | |
| Tweezers | Electron Microscopy Sciences | https://www.emsdiasum.com/style-3sa |
References
- Komeili, A., Li, Z., Newman, D. K., Jensen, G. J. Magnetosomes are cell membrane invaginations organized by the actin-like protein MamK. Science. 311 (5758), 242-245 (2006).
- Bykov, Y. S., et al. The structure of the COPI coat determined within the cell. eLife. 6, e32493(2017).
- Mahamid, J., et al. Visualizing the molecular sociology at the HeLa cell nuclear periphery. Science. 351 (6276), 969-972 (2016).
- Xue, L., et al. Visualizing translation dynamics at atomic detail inside a bacterial cell. Nature. 610 (7930), 205-211 (2022).
- Hampton, C. M., et al. Correlated fluorescence microscopy and cryo-electron tomography of virus-infected or transfected mammalian cells. Nat Protoc. 12 (1), 150-167 (2017).
- Oikonomou, C. M., Jensen, G. J. Cellular electron cryotomography: Toward structural biology in situ. Annu Rev Biochem. 86 (1), 873-896 (2017).
- Grimm, R., et al. Electron tomography of ice-embedded prokaryotic cells. Biophys J. 74 (2), 1031-1042 (1998).
- Medalia, O., et al. Macromolecular architecture in eukaryotic cells visualized by cryoelectron tomography. Science. 298 (5596), 1209-1213 (2002).
- Tamborrini, D., et al. Structure of the native myosin filament in the relaxed cardiac sarcomere. Nature. 623 (7988), 863-871 (2023).
- Kaplan, M., et al. Bdellovibrio predation cycle characterized at nanometre-scale resolution with cryo-electron tomography. Nat Microbiol. 8 (7), 1267-1279 (2023).
- Schur, F. K. M., et al. An atomic model of HIV-1 capsid-SP1 reveals structures regulating assembly and maturation. Science. 353 (6298), 506-508 (2016).
- Arnold, J., et al. Site-specific cryo-focused ion beam sample preparation guided by 3D correlative microscopy. Biophys J. 110 (4), 860-869 (2016).
- Lam, V., Villa, E. Practical approaches for cryo-FIB milling and applications for cellular cryo-electron tomography. cryoEM: Methods and Protocols. , Springer. 49-82 (2020).
- Rigort, A., Plitzko, J. M. Cryo-focused-ion-beam applications in structural biology. Arch Biochem Biophys. 581, 122-130 (2015).
- Noble, A. J., de Marco, A. Cryo-focused ion beam for in situ structural biology: State of the art, challenges, and perspectives. Curr Opin Struct Biol. 87, 102864(2024).
- Rigort, A., et al. Focused ion beam micromachining of eukaryotic cells for cryoelectron tomography. Proc Natl Acad Sci U S A. 109 (12), 4449-4454 (2012).
- Iancu, C. V., et al. Electron cryotomography sample preparation using the Vitrobot. Nat Protoc. 1 (6), 2813-2819 (2006).
- Dobro, M. J., Melanson, L. A., Jensen, G. J., McDowall, A. W. Plunge freezing for electron cryomicroscopy. Methods Enzymol. 481, 63-82 (2010).
- Chang, Y. -W., et al. Correlated cryogenic photoactivated localization microscopy and cryo-electron tomography. Nat Methods. 11 (7), 737-739 (2014).
- Wu, G. -H., et al. Multi-scale 3D cryo-correlative microscopy for vitrified cells. Structure. 28 (11), 1231-1237.e3 (2020).
- Lin, C., Zhang, L., Zhang, Z., Jiang, Y., Li, X. Locating cellular contents during cryo-FIB milling using cellular secondary-electron imaging. J Struct Biol. 215 (3), 108005(2023).
- Wagner, F. R., et al. Preparing samples from whole cells using focused-ion-beam milling for cryo-electron tomography. Nat Protoc. 15 (6), 2041-2070 (2020).
- Carter, S. D., Mamede, J. I., Hope, T. J., Jensen, G. J. Correlated cryogenic fluorescence microscopy and electron cryo-tomography shows that exogenous TRIM5α can form hexagonal lattices or autophagy aggregates in vivo. Proc Natl Acad Sci U S A. 117 (47), 29702-29711 (2020).
- Guo, Q., et al. In situ structure of neuronal C9orf72 poly-GA aggregates reveals proteasome recruitment. Cell. 172 (4), 696-705.e12 (2018).
- Perez, D., et al. Identification and demonstration of roGFP2 as an environmental sensor for cryogenic correlative light and electron microscopy. J Struct Biol. 214 (3), 107881(2022).
- Sartor, A. M., Dahlberg, P. D., Perez, D., Moerner, W. E. Characterization of mApple as a red fluorescent protein for cryogenic single-molecule imaging with turn-off and turn-on active control mechanisms. J Phys Chem B. 127 (12), 2690-2700 (2023).
- Sexton, D. L., Burgold, S., Schertel, A., Tocheva, E. I. Super-resolution confocal cryo-CLEM with cryo-FIB milling for in situ imaging of Deinococcus radiodurans. Curr Res Struct Biol. 4, 1-9 (2022).
- Dahlberg, P. D., Moerner, W. E. Cryogenic super-resolution fluorescence and electron microscopy correlated at the nanoscale. Annu Rev Phys Chem. 72 (1), 253-278 (2021).
- Perez, D., et al. Exploring transient states of PAmKate to enable improved cryogenic single-molecule imaging. J Am Chem Soc. 146 (42), 28707-28716 (2024).
- Li, S., et al. ELI trifocal microscope: A precise system to prepare target cryo-lamellae for in situ cryo-ET study. Nat Methods. 20 (2), 276-283 (2023).
- Loginov, S. V., Boltje, D. B., Hensgens, M. N. F., Hoogenboom, J. P., vander Wee, E. B. Depth-dependent scaling of axial distances in light microscopy. Optica. 11 (4), 553-568 (2024).
- Petrov, P. N., Moerner, W. E. Addressing systematic errors in axial distance measurements in single-emitter localization microscopy. Opt Express. 28 (13), 18616-18632 (2020).
- Yang, J., et al. Precise 3D localization by integrated fluorescence microscopy (iFLM) for cryo-FIB-milling and in situ cryo-ET. Microsc Microanal. 29 (Suppl. 1), 1055-1057 (2023).
- Perton, E., Boltje, D., Jakobi, A., Hoogenboom, J. Workflow for fluorescence-targeted lamella milling from vitrified cells with a coincident fluorescence, electron, and ion beam microscope. Bio Protoc. 15 (14), e5390(2025).
- Boltje, D. B., et al. A cryogenic, coincident fluorescence, electron, and ion beam microscope. eLife. 11, e82891(2022).
- Sica, A. V., et al. Optical interference for the guidance of cryogenic focused ion beam milling beyond the axial diffraction limit. bioRxiv. , (2024).
- Dahlberg, P. D., Perez, D., Hecksel, C. W., Chiu, W., Moerner, W. E. Metallic support films reduce optical heating in cryogenic correlative light and electron tomography. J Struct Biol. 214 (4), 107901(2022).
- Lukinavicius, G., et al. Fluorogenic probes for live-cell imaging of the cytoskeleton. Nat Methods. 11 (7), 731-733 (2014).
- Wang, J. Direct visualization of cellular protein complexes in situ by fluorescence-guided cryo-FIB-SEM and cryo-ET. , California Institute of Technology. (2025).
- Last, M. G., Tuijtel, M. W., Voortman, L. M., Sharp, T. H. Selecting optimal support grids for super-resolution cryogenic correlated light and electron microscopy. Sci Rep. 13 (1), 8270(2023).
- Mastronarde, D. N. Automated electron microscope tomography using robust prediction of specimen movements. J Struct Biol. 152 (1), 36-51 (2005).
- Mastronarde, D. N., Held, S. R. Automated tilt series alignment and tomographic reconstruction in IMOD. J Struct Biol. 197 (2), 102-113 (2017).
- Kremer, J. R., Mastronarde, D. N., McIntosh, J. R. Computer visualization of three-dimensional image data using IMOD. J Struct Biol. 116 (1), 71-76 (1996).
- Meng, E. C., et al. UCSF ChimeraX: Tools for structure building and analysis. Protein Sci. 32 (11), e4792(2023).
- Heebner, J. E., et al. Deep learning-based segmentation of cryo-electron tomograms. J Vis Exp. (189), e64435(2022).
- Klumpe, S., et al. A modular platform for automated cryo-FIB workflows. eLife. 10, e70506(2021).
- Li, Y., Kang, D. -D., Dai, J. -Y., Wang, L. -W. The cage effect of electron beam irradiation damage in cryo-electron microscopy. npj Comput Mater. 10 (1), 115(2024).
Reprints and Permissions
