Integrated image management, artificial intelligence (AI), and reporting systems have revolutionized diagnostic pathology practice. In this paper, we introduce FlexLIS, a state-of-the-art system that enables AI to assist pathologists in performing histopathology image assessments and generating diagnostic reports.
Method Article
Introduction of an Integrated Pathology Image Management, Artificial Intelligence, and Reporting System
In This Article
Summary
Abstract
The development of electronic reporting systems (LIS), image management systems (IMS), and AI models has revolutionized pathology practices. By integrating advanced IMS and sophisticated AI algorithms, these systems further streamline the diagnostic process, enabling more precise and efficient diagnoses. FlexLIS is a cutting-edge digital pathology software incorporating AI models for image analysis and transcribing the AI-generated results into comprehensive pathology reports. This AI-integrated system can also support quality control (QC), order special stains for challenging cases, and facilitate consultations. As a result, it has the potential to improve pathologists' diagnostic accuracy and workflow. In this paper, we provide a concise protocol for pathologists on how to use the software to review slide images and generate pathology reports. We also discuss its application in diagnosing prostate cancer using prostate needle core biopsy and bladder cancer screening through urine cytology, showcasing the platform's versatility and impact in clinical practices.
Introduction
Diagnostic pathology is an important medical specialty that makes the diagnosis of diseases by examination of tissues obtained from patients. Tissue samples are processed, and thin sections of tissue are placed on glass slides, which are then stained with chemicals such as hematoxylin and eosin (H&E). Traditionally, pathologists examine stained tissue on glass slides under microscopes and issue diagnostic reports via computer software, i.e., laboratory information systems (LIS; Figure 1A). In the past decade, digital pathology has gradually been introduced into pathology practice, where glass slides were digitized by scanning the glass slide to produce a whole slide image (WSI)1. Pathologists only need to review slide images using an image management system (IMS) to render diagnoses, which significantly impacts the workflow of pathology practice (Figure 1B). More recently, artificial intelligence (AI) with deep machine learning of digitized histopathology images provides a potential opportunity to improve diagnostic accuracy and efficiency of pathologists1,2.
Due to the introduction and development of LIS, IMS, and pathology AI at different time periods, these systems are supplied by different vendors and function independently. Currently, pathologists have to work with two separate systems, i.e., LIS for reporting diagnoses and IMS for reviewing images1. Furthermore, current AI models are designed to work better with IMS but not with LIS3. The incompatibility of LIS, IMS, and AI significantly impacts the development and implementation of digital pathology and AI models in routine pathology practice. It is ideal and important to have an integrated system that combines LIS and IMS so that AI can review images in IMS and generate pathology reports in LIS.
Therefore, it is our goal to develop a cloud-based, integrated LIS/IMS/AI system that allows pathologists to access the images and issue reports anytime and anywhere. Furthermore, the AI models seamlessly interact between IMS and LIS so that the results of the AI assessment of images in IMS can be transcribed into the pathology reports in LIS automatically. Pathologists only need to review the image in IMS and confirm the diagnosis in LIS without manual input. In this article, we present the protocol for pathologists to use FlexLIS and demonstrate the real-world applications of the AI-assisted image analysis and reporting in prostate cancer diagnosis and urine cytology for bladder cancer screening.
Protocol
FlexLIS was designed with strict adherence to data privacy standards and regulatory frameworks, including the Health Insurance Portability and Accountability Act (HIPAA). All patient data processed within the system is encrypted both at rest and in transit using industry-standard protocols.
1. Account set up
- Open the web browser. Type Continue (Figure 2). An email is sent to the user.
- Go to email and click the Link to sign in, which will open the Accession List window (Figure 3).
2. Digitization of glass slides
- Turn on the Digital scanner power and load previously stained-glass slides (i.e., hematoxylin and eosin) into the scanner.
- Press Start to start scanning of glass slides. The images will be automatically uploaded into the system by direct interface and arranged in a case format as pathologists usually see in the slide tray.
3. Data analysis
- See the list of cases in the Accession List window (Figure 3 and Figure 4) and corresponding images in the Image Review window (Figure 5 and Figure 6).
NOTE: The software uses the following benchmarks to gauge user usability: task success rate, time on task, error rate, number of actions per task, system usability scale (SUS), and user satisfaction via user studies and interviews. We use Datadog for real-time user monitoring (RUM) and to monitor for application errors. - In the Accession List window, the user sees the list of assigned cases (Figure 3C). Click the down arrow button in front of the case (PN24-00004) to see the stains ordered by staff and AI (PIN4 in this case). A green dot on the microscope icon indicates the completion of AI analysis (Figure 2C). A red dot in front of the accession number indicates cancer detected in the image by AI (Figure 2C). Reviewed/Ready/Total indicates the total number of images in each category. The ! mark after the image number indicates the AI assessment of the image quality (i.e., missing images or blurry).
- Click the User icon in front of case PN24-00004 , which brings the user to the Pathologist Review window (Figure 4). All specimens are listed alphabetically (Figure 4B) in the Specimen Summary Table. The user sees the AI analysis results for each specimen, including Diagnosis (Benign, HGPIN, ASAP, Cancer) and Description (Gleason scores, tumor length, and grade group; Figure 4B). Users also see the AI results in a diagram (red-cancer, orange-ASAP, and black-benign; Figure 4B).
- Click the Microscope icon on the left to B (Figure 4B), which opens the Image Review window (Figure 5). The user sees the corresponding image in a separate Image Review window (Figure 5). The user also sees AI annotations, red highlights indicate cancer, and green highlights indicate Gleason 4 (Figure 5).
- Click C (Figure 5A) to view image C, click D to view image D, etc. Click the AI Feedback icon in Figure 5C to see the details of AI outputs (Figure 6).
Results
In this section, two use cases are presented to demonstrate how the AI can assist pathologists in assessing images and providing diagnostic inputs.
Prostate cancer diagnosis (Figure 7): Histopathology assessment of prostate biopsy with cancer, including tumor length and percentage, Gleason scores (3, 4, and 5), percentage of Gleason 4 and 5, etc. This information is then used to classify patients into 4 grade groups (1 to 4), with 4 being the most aggressive prostate cancer4,5. This information is required to be included in the pathology report; therefore, it is a perfect example to illustrate AI-assisted pathology diagnosis.
In this example, the glass slides with prostate biopsy were initially stained with the hematoxylin-eosin (H&E) procedure. The stained slide was then digitized to generate a whole slide image (WSI), which was uploaded to the system via a direct interface between the scanner computer and the software (Figure 7). Once uploaded, an AI-powered model processes the label, identifies and tags every entity, including the specimen source (i.e., prostate) and staining type (i.e., H&E). This model determines whether the image is a H&E-stained prostate biopsy. If it is, another AI-based model analyzes the image and generates feedback or outputs based on the analysis (Figure 7A). This AI-based model is also able to pre-order PIN4 immunohistochemical stains to assist pathologists in confirming the presence of small tumor areas (Figure 3).
This model was trained on over 1700 prostate whole slide images (WSI) that were pixel-wise annotated by a team of experienced pathologists. Following the annotation of WSIs, a deep learning model is applied to classify prostatic tissue tiles into four categories: Benign, Gleason3, Gleason4, and Gleason5. As illustrated in Figure 5, tile-based outputs are aggregated to create a whole-slide mask highlighting cancerous regions: Cancer (red), Gleason4 (green), and Gleason5 (blue; Figure 6). In addition to these masks, the AI model generated a final label (Cancer or Benign) for the prostate WSI. This classification is based on morphological features such as the areas of Gleason3, Gleason4, and Gleason5, the certainty of Gleason3, Gleason4, and Gleason5 masks, and other factors. The performance of our current prostate model for the detection of prostate cancer was confirmed by using an independent set of 1,000 WSIs that were not used during model development or validation. Each slide in the validation set is labeled as either Benign or Cancer. The trained model also assigns a label to each slide as described. By comparing the ground truth labels with the model's predictions, performance metrics such as accuracy, sensitivity, specificity, and F1 score were calculated, as presented in Table 1. The results indicate that the trained model performs comparably to other prostate AI models6.
In addition to Gleason scores, the AI model is able to determine tumor length and percentage, and grade group (Figure 7). Furthermore, the AI model is also able to calculate NCCN risk group-based pathology and clinical information if provided (Figure 7A). In FlexLIS, AI is able to transcribe all diagnostic information into the pathology report, so that pathologists do not have to manually enter it into the report (Figure 7B). Although the entire AI process is completed in the background and is not visible to pathologists, the AI analysis results and the same image are visible to pathologists who can decide to keep or change the AI results in the pathology report (Figure 7B).
Urine cytology for bladder cancer screen: Urine cytology is the primary non-invasive method for bladder cancer screen, diagnosis, and monitoring7. Urine cytology classifies patients into four categories: negative for high-grade urothelial carcinoma, atypical urothelial cells, suspicious for high-grade urothelial carcinoma, and high-grade urothelial carcinoma8. Review of urine cytology requires experience and skill and is very time-consuming. Therefore, AI-assisted urine cytology screening is highly demanded. This case presents a single-cell assessment by AI.
Examining urine cytology slides can be a labor-intensive and time-consuming process for pathologists. It requires meticulously scanning wide fields and frequently zooming in and out to locate rare, diagnostically significant cells, often resembling a search for a needle in a haystack. This manual approach not only demands considerable time and focus but also contributes to diagnostic fatigue and potential variability in interpretations. To streamline this process, the AI-based urine cytology model integrated within FlexLIS has been developed to support pathologists by automatically detecting and classifying a wide range of cell types in urine specimens. The model is capable of identifying the following categories: HGUC (High-Grade Urothelial Carcinoma cells), suspicious (urothelial cells with marked abnormalities suggestive of malignancy but not definitively diagnostic), atypical urothelial cells, RBCs (Red Blood Cells), crystals, lymphocytes, polymorphous cells, polyoma virus, renal tubular cells, sperm, squamous cells, normal urothelial cells, yeast, and others. To further enhance usability, the diagnostically significant categories-HGUC, atypical urothelial cells, and suspicious ones-are highlighted using distinct colors (Figure 8), enabling pathologists to rapidly focus on areas of interest without the need for exhaustive manual scanning.
Furthermore, the AI model quantifies the number of cells in each detected category and seamlessly integrates this data into the output (Figure 8). These findings are automatically transcribed into the pathology report, enabling the pathologist to focus solely on reviewing, verifying, and finalizing the case. This greatly enhances diagnostic efficiency, reduces manual workload, and promotes consistency and accuracy across reports.
To train the AI model, 500 regions were randomly selected from 150 whole slide images of urine cytology specimens. Expert cytopathologists manually annotated cells within these regions into 14 predefined categories, as previously described, resulting in over 30,000 annotated cells. Regions from 80% of the slides were used for training, while the remaining 20% were reserved for validation. An object detection model was then trained and evaluated to accurately identify and classify cells across the defined categories.
In addition to prostate and urine cytology models, the gastroenterology AI model is also available in the software. Other models, including bladder cancer and lung cancer, are in the process of development.

Figure 1: Pathology workflow. (A) Traditional pathology workflow. (B) Digital pathology workflow. Please click here to view a larger version of this figure.

Figure 2: Log in window. Enter email in the email box. Please click here to view a larger version of this figure.
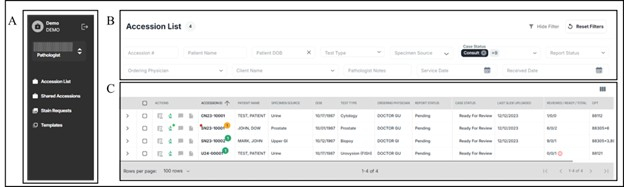
Figure 3: Accession List window. (A) The left sidebar indicates different user options. (B) Accession Filter to search and sort the cases. (C) Accession List with the information of each case, including accession number, patient name, case status, number and quality of the images, etc. In this case, 4 cases were assigned to the user. Please click here to view a larger version of this figure.
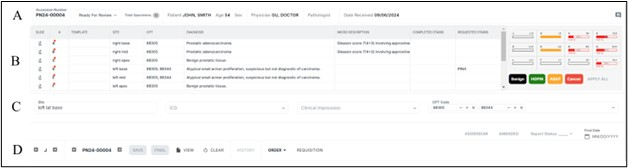
Figure 4: Pathologist Review window. (A) Case information, including the status of the case. (B) The Specimen Summary table provides a summary of each specimen, including site, diagnosis, and comments. (C) Specimen information provides additional information about the specimen. (D) Case Control Panel for navigating the case. The right diagram indicates prostate biopsy sites and AI results (red-cancer, orange-ASAP, and black-benign). Please click here to view a larger version of this figure.
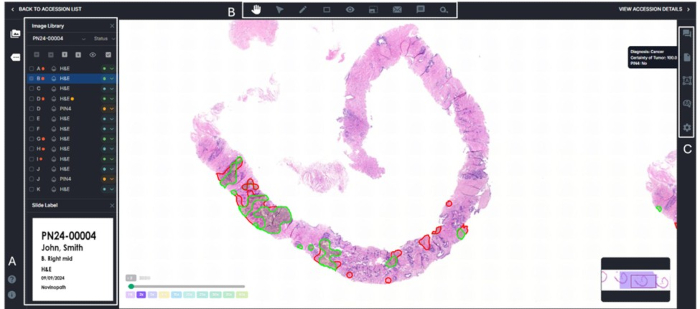
Figure 5: Image Review window. (A) Image library (left sidebar) lists all specimens alphabetically with information on stain type and status. (B) Toolbar (top) to move, annotate, and share the images. (C) Case information/AI (right sidebar) for making comments, communicating with staff, and viewing AI feedback/outputs. This case is a prostate biopsy with prostate cancer masked by AI (red-cancer and green-Gleason 4). Please click here to view a larger version of this figure.
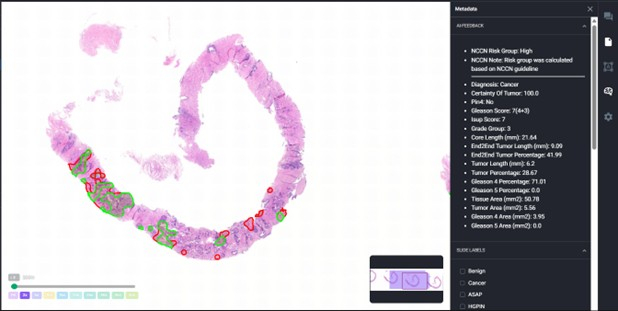
Figure 6: AI outputs. (A) Histology image. (B) AI feedback, i.e., AI assessment of image, including tumor length, Gleason score, grade group, etc. Please click here to view a larger version of this figure.
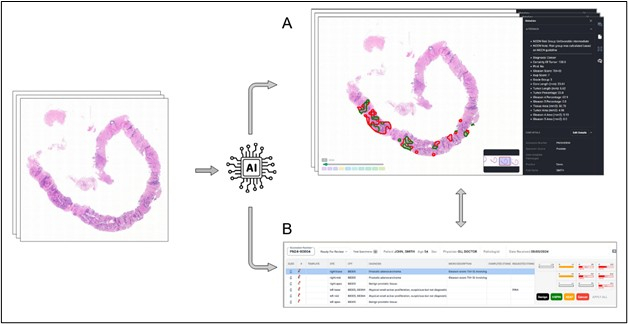
Figure 7: Prostate AI model automatically assesses the image of prostate biopsy and assists in generating pathology reports. (A) After analysis of images in IMS. (B) AI outputs the results to the pathology report. Please click here to view a larger version of this figure.
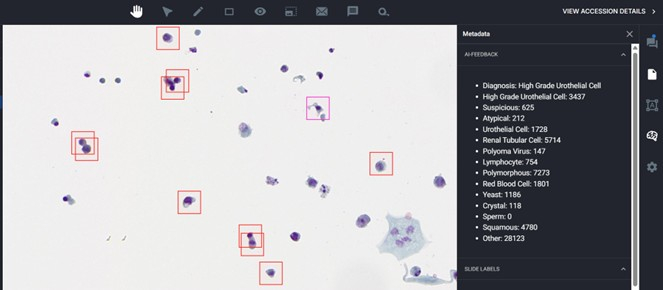
Figure 8: AI assessment of urine cytology slide. Abnormal urothelial cells were highlighted in red (high-grade urothelial cancer cells) and pink (suspicious cells). AI results showing in the insert (right upper corner). Please click here to view a larger version of this figure.
| Accuracy | Precision | Sensitivity | Specificity | F1-score |
| 97% | 96% | 98% | 96% | 97% |
Table 1: Performance of the prostate AI model for detection of adenocarcinoma in prostate biopsies.
Discussion
The successful and accurate application of FlexLIS relies on several critical steps within the process, which can be defined as pre-analytical, analytical, and post-analytical factors1. The most important preanalytical factor is the image quality, which is affected by digital scanners, slide labels, and staining. Poor quality of the images significantly impacts image assessment and AI performance. The analytical factors include internet speed, quality of image display (pixel and resolution), stability of the software, and correct operation by users. The post-analytical factors include storage and retention of images, image backup, resilience, data security, and HIPAA compliance1. Since the software is designed by pathologists for pathologists, many potential analytical errors encountered in daily practice, including maloperation, can be detected and flagged by the software to ensure these errors are corrected before moving to the next step. For example, if an image is not reviewed and the diagnosis is not entered (Figure 4), the case cannot be finalized.
While the software significantly streamlines the workflow, occasional adjustments or troubleshooting may be necessary. For instance, discrepancies between the AI's assessments and the pathologist's interpretations may arise. These differences can result from factors such as image quality, variations in slide staining techniques, or the presence of rare tumor types and histopathological patterns that were underrepresented in the initial training datasets. To address these challenges, a human-in-the-loop approach is utilized, where pathologists provide feedback to the AI model. This feedback is used to periodically update the model with new and more diverse training data, improving its accuracy and generalizability over time. This ensures that the system continues to evolve and improve based on real-world clinical experience.
Although each LIS9, IMS, and AI10 system has been reported previously, FlexLIS stands out as an integrated system that, to our knowledge, has not been reported previously. More importantly, this integrated system, including its AI models, has been used daily in several pathology practices and has demonstrated its utility and reliability. Such a system is designed to be used in routine pathology laboratories, therefore supports handling and reporting a variety of pathology specimens, including prostate, bladder, breast, lung, GI, GYN, etc. This system incorporates several AI-based quality control features, including detection and flagging of artifacts in the images (blurry and missing tissue), which can impact the diagnostic accuracy. Finally, this system is very flexible and can be tailored to the specific needs of each individual laboratory.
The future applications of this integrated LIS/IMS/AI system are very broad, including clinical services, biomedical research, and medical student/resident education. It offers a separate research module which ensures to meet high standards in research including those required by the Institutional Review Board, such as 1) de-identify the images by blank out the original slide label which contains patient's ID and assign a new research ID; 2) sort and arrange slides and cases as required by the study design; 3) record and track participants' diagnosis and comments for data analysis and summary, etc.
Its utility in education is evidenced by our ongoing resident training project11, which indicates that AI assistance can increase residents' accuracy in identifying key histopathological features. Several features within the software described here, including the user-friendly IMS and a large number of images in the system, controllable access of AI masks and annotations, integrated pathology-specific ChatGPT features, and secure and convenient case-sharing capability, make it a useful platform for both self-directed learning and mentor-guided training.
Currently, the software faces several limitations and challenges, like any other AI-based image management platform1. Challenges of integration, including interface with existing EMR, storage, and retrieval of large images, etc., should be taken into consideration when implementing. The generalizability of AI models across different institutions, scanners, staining protocols, and patient populations, as well as sensitivity to image artifacts, tissue preparation variability, and rare histology patterns, are a few limitations associated with pathology AI models. Finally, interoperability is another challenge of pathology AI systems due to the fragmentation of data formats, diagnostic terminology, and platform-specific tools.
Disclosures
Authors are involved in the development of FlexLIS. The LIS/IMS system, as well as AI, was developed by NovinoAI and is proprietary to NovinoAI.
Materials
| Name | Company | Catalog Number | Comments |
|---|---|---|---|
| FlexLIS | Novino AI |
References
- Zhang, D. Y., et al. Implementation of digital pathology and artificial intelligence in routine pathology practice. Lab Invest. 104 (9), 102111(2024).
- Zhu, M., et al. Artificial intelligence in pathologic diagnosis, prognosis and prediction of prostate cancer. Am J Clin Exp Urol. 12 (4), 200-215 (2024).
- Park, S. L., et al. Anatomic pathology laboratory information systems: a review. Adv Anat Pathol. 19 (2), 81-96 (2012).
- Epstein, J. I., et al. The 2019 genitourinary pathology society (gups) white paper on contemporary grading of prostate cancer. Arch Pathol Lab Med. 145 (4), 461-493 (2021).
- Moses, K. A., et al. NCCN guidelines insights: Prostate cancer early detection, version 1.2023. J Natl Compr Canc Netw. 21 (3), 236-246 (2023).
- Bryant, R. J., et al. Local anaesthetic transperineal biopsy versus transrectal prostate biopsy in prostate cancer detection (TRANSLATE): a multicentre, randomised, controlled trial. Lancet Oncol. 21, (2025).
- Flaig, T. W., et al. NCCN guidelines insights: Bladder cancer, version 3.2024. J Natl Compr Canc Netw. 22 (4), 216-225 (2024).
- Barkan, G. A., et al. The Paris system for reporting urinary cytology: The quest to develop a standardized terminology. J Am Soc Cytopathol. 5 (3), 177-188 (2016).
- Sepulveda, J. L., et al. The ideal laboratory information system. Arch Pathol Lab Med. 137 (8), 1129-1140 (2013).
- Fu, Q., et al. Design and Implementation of Clinical LIS360 Laboratory Management System Based on AI Technology. Int J Comput Intelligence Syst. 16, 33(2023).
- Zhu, M., et al. Artificial Intelligence-Assisted Histopathology As A Training Tool For Residents. Lab Invest. 105 (3), 102736(2025).
Reprints and Permissions
