Modern football helmets underperform at the posterior aspect of the helmet. The measurement process described herein elucidates the sports helmet's ability to mitigate translational and rotational accelerations caused by impacts of various magnitudes. It robustly characterizes energy dissipation mechanisms and can be used to refine the helmet design process.
Research Article
Impact Mitigation in Modern Football Helmets: Advances and Limitations of Position-Specific Designs
In This Article
Summary
Abstract
It has been established that repetitive head impacts lead to the accrual of changes in brain function, structure, and chemistry. The helmet is the primary piece of protective equipment for participants in American football. The first helmets were constructed from leather. Plastic helmets with chin straps were developed in the 1950s, but testing standards were not developed until 1973. While those standards resulted in improved padding materials, previous work demonstrated that modern helmets mitigate translational accelerations better than rotational accelerations, especially on a helmet's Rear Aspect. The goal of this study was to detail the methodology used to examine the impact mitigation of football helmets with differing energy dissipation mechanisms, including position-specific helmets. The experiments were integrated within a dimensional analysis framework to yield a technique that makes it possible to simultaneously evaluate translational and rotational accelerations due to quantified impact loads at multiple locations around the helmet. Despite improvements in the overall impact mitigation of one of the helmets tested here, in general, they did not achieve their design goals.
Introduction
It has been established that there are 1.6-3.8 million sports-related traumatic brain injuries (TBIs) each year in the United States1,2,3,4, resulting primarily from contact sports such as football, ice hockey, soccer, lacrosse, rugby, and wrestling. While football consistently exhibits the greatest rate of diagnosed concussion, it should be noted that these rates are dramatically underestimated due to the underreporting of concussion symptoms5,6,7,8,9. With or without a diagnosed concussion, it has been established that repeated head acceleration events (rHAEs) can lead to marked changes in brain structure10, function, and chemistry11,12,13,14,15,16,17,18,19,20,21. These rHAEs may be the result of direct impacts between players, a player and the ground, or whiplash events resulting from impacts to the legs or torso. Subsequent research illustrated the effects of rHAEs on cognitive impairment, depression, and anxiety22. It has even been suggested that many years of exposure to rHAEs may increase the risk for long-term neurodegenerative disorders such as Alzheimer's Disease (AD) and chronic traumatic encephalopathy (CTE)23 in both soccer and football players24,25,26. In order to protect participants in contact sports such as American football from the deleterious effects of rHAEs, it is critical to understand the physics of head impacts, starting with the helmet, which serves as the principal piece of protective equipment.
The first football helmets were made of leather and became a required piece of equipment in college football in 193927. Chin straps and facemasks were in use by the 1950s, but it was not until 1973 that a testing standard was developed by the National Operating Committee on Standards for Athletic Equipment (NOCSAE). This drop tower-based standard was responsible for numerous improvements, including new cushioning materials and novel impact mitigating systems28. While this methodology provided an important baseline, Breedlove et al. were the first to point out that not including the facemask led to underprediction of the peak accelerations at the rear of the helmet29. In order to mitigate this shortcoming in the testing process, researchers began using the Hybrid III head form, originally developed for use in automotive crash tests, to evaluate protective gear for contact sports30,31,32,33. Recent work has demonstrated that modern helmets mitigate up to 83% of the translational acceleration from a given impact to the front of the helmet, 80% to the side of the helmet, and 75% to the rear of the helmet34,35. Mitigation of the rotational acceleration is considerably more variable, despite the fact that it is thought to be the primary correlate with tissue damage36,37,38,39,40,41,42,43. Modern helmets mitigate up to 70% of the rotational acceleration from a given impact to the front of the helmet, and 82% to the side of the helmet, but only 48% to the rear of the helmet34,35.
Based on previous results, the Riddell SpeedFlex (Riddell; Rosemont, IL) and Vicis Zero 1 (Seattle, WA) were the best-performing helmet models35 with respect to both the translational and rotational accelerations. In 2022, a new version of the Riddell SpeedFlex was developed, as well as three new models of the Vicis: Vicis Zero 2; Vicis Zero 2 Trench, specifically designed for linemen; and the Vicis Zero 2 QB, specifically designed for quarterbacks. The current study was intended to evaluate the helmets that previously performed the best35 and determine whether or not subsequent design modifications, including those intended to optimize the helmet design for specific positions, substantially improved performance. The overall goal of this study was to test the hypothesis that the newest helmets would perform better than the previous generation for both translational and rotational impacts.
Protocol
The consumables and the equipment used are listed in the Table of Materials.
1. Overview of data collection
Herein, four different helmet models from two manufacturers were utilized. These included the 2022 edition of the SpeedFlex (Riddell, Rosemont, IL), denoted by H1; the Zero 2 (Vicis, Seattle, WA), denoted by H2; the Zero 2 Trench (Vicis, Seattle, WA), denoted by H2T, designed for offensive and defensive line players; and the Zero 2 Quarterback (Vicis, Seattle, WA), denoted by H2Q, designed for quarterbacks, although it should be noted that the differences between H2 and H2Q were not obvious. For each helmet model, three separate helmets were tested for a total of 12 helmets.
The current study followed the basic procedure developed by Cummiskey et al.34,44, and McIver et al.35. Consistent with these previous studies, a 50th percentile Hybrid III head and neck assembly testing rig, secured to a steel baseplate, was used to quantify forces and accelerations resulting from direct impacts to the bare head form as well as each of three helmets of each tested model. The impact mitigation, as defined here, was simply a measure of the decrease in acceleration due to the presence of the helmet.
2. Detailed process of data collection
After ensuring the DAQ and the computer that runs the LabView code were properly connected to power, all the sensors were plugged into the DAQ.
3. Software initialization
The custom LabView program, entitled "Hammer_Time_2017.vi" was double-clicked to initiate the start of the data collection. Basic data were then entered into the appropriate fields, including the path for the final data file, number of hits per file (typically five), number of files per location (typically four), and the headgear profile. Once the data were entered, the LabView code was initiated by pressing Run.
As a preliminary evaluation of the entire system, the modal impulse hammer was used to strike the front, top, and side in order to confirm that the hammer and all nine accelerometers were successfully collecting data.
4. Impact delivery
During the delivery of each impact, resultant accelerations at the center of mass (CoM) were measured using a nine-accelerometer array in a 3-2-2-2 setup, as defined by Padgaonkar et al.45. A 200 ms time series was collected for each normal and oblique impact with a 70 ms pre-trigger, providing 130 ms of acceleration and impact force measurements, with all signals collected at 5120 Hz.
5. Impact types
Fourteen impact types (Figure 1) were evaluated for all test cases (bare head form and each helmet model), representing two angles of incidence (normal and oblique) at each of seven impact locations (Front, Front Boss, Side, Rear Boss, Rear, Top, and the SpeedFlex Cut Out). Normal impacts were delivered perpendicular to the surface, and oblique impacts were delivered at an angle of approximately 45o to the normal direction. These impact types are hereafter denoted by: (1) Front-Normal, (2) Front-Oblique, (3) Front Boss-Normal, (4) Front Boss-Oblique, (5) Side-Normal, (6) Side-Oblique, (7) Rear Boss-Normal, (8) Rear Boss-Oblique, (9) Rear-Normal, (10) Rear-Oblique, (11) Top-Normal, (12) Top-Oblique, and, at the location of the SpeedFlex Cut Out, both (13) Cut Out-Normal and (14) Cut Out-Oblique (Figure 1). To simplify the discussion of the position-specific impact mitigation characteristics, two aggregated regions were also defined: the Frontal Aspect of the helmet encompassed impact types 1, 2, 3, 4, 13, and 14; and the Rear Aspect of the helmet consisted of impact types 7, 8, 9, and 10.
Impacts were first administered to the bare head form using a modally tuned impulse hammer (PCB Piezotronics, Inc.; Depew, NY) as described by Cummiskey et al.34,44, to record the applied force during impact.
For each hit, the impact of the modal impulse hammer triggered the 200 ms acquisition window. After the data were visually inspected to ensure that there were no recording errors, the Save button was pressed to write the data to a file. Due to the violence of the experiments, most recording errors result from loose wires, a broken hammer cable, or broken accelerometer wires. For five hits per file, and four files per location, a total of twenty impacts were recorded at each location at levels 1 (2-4 Ns), 2 (5-7 Ns), 3 (8-10 Ns), 4 (11-13 Ns), 5 (> 14 Ns), with three repeats.
Subsequent to the acquisition of a bare head form reference set, three examples of each helmet were serially fitted to the head form, according to manufacturer specifications. All 14 impact types were delivered to each of the three helmets (Figure 2). These procedures resulted in a total of 840 data points being collected for each helmet model. Note that for the collection of the last, largest hammer strike at each location, a high-speed camera was used to document the blow at a frame rate of 959 Hz (Figure 3).
6. Post-processing
This study focuses on two important output parameters that result from impacts delivered to a Hybrid III head form: the peak translational and peak rotational accelerations, ap,and  , respectively. For the purposes of comparison, these parameters were recast in dimensionless form,
  , and
, and  , respectively, as described by Cummiskey et al.34,
 (1)
(1)
 (2)
(2)
where t* is the difference between a reference time (100 ms) and the impact duration as measured by the impulse hammer, and wn is the width of the neck. The impulse delivered to the head form (bare or helmeted) was also converted into a dimensionless input variable,  , and given by,
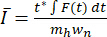 (3)
(3)
where mh is the mass of the head form, and F(t) is the impact force as a function of time, integrated over the duration of the impact.
Acceleration traces were collected and processed using a custom MATLAB program. After collection, all traces were passed through a fourth-order Butterworth low-pass filter (750 Hz cutoff frequency) to reduce noise. Kinematic equations were then used to calculate resultant translational and rotational acceleration at the CoM44,45. These values were output as dimensionless quantities to assess the response of the head form34. Peak Translational Acceleration (PTA) and Peak Rotational Acceleration (PRA) were output as trace data for each recorded impact.
7. Statistical analysis
The current study also followed the data reduction and statistical analysis pipeline developed previously34,35. Briefly, both , and , were shown to be related to the dimensionless impulse, , by a power law relationship46. For the translational acceleration, this model has the form,
 (4)
(4)
A similar approach was used to model the dimensionless rotational acceleration. A modified version of Grubb's method was then used to remove outliers, and a final curve fit was generated34. An ANCOVA test with an α level of 0.05 was used to examine differences between the regression coefficients for each helmet, with a Tukey post-hoc test and Holm-Sidak p-value correction34,47.
The final intermediate asymptotic curves generated by this process were utilized to determine the impact mitigation for each helmet. Once the area under each curve was calculated using a total of 100 evenly spaced values spanning the distance between the minimum and maximum values for , it was possible to determine the effectiveness of the helmet at each location (Figure 4),
 (5)
(5)
This process was repeated for the peak rotational accelerations. With a maximum value of one (representing 100% attenuation), the higher the impact attenuation, the better the helmet performed. A change in mitigation of 0.05 was used as a threshold value, representing a physically meaningful effect size. Such an increase corresponds to 5% of the maximum possible mitigation and would roughly eliminate the effects of 25-50 head impacts for a typical athlete participating in an entire season of contact and accumulating a typical number of 500-1,000 head impact exposures1,12.
Results
The masses of the four helmets tested herein ranged from 1.986 kg for the H2Q to 2.243 kg for the H2T (Table 1), which is the most massive helmet reported to date.
Over the course of the experiment, the peak force generated by the modal impulse hammer was 5,307 N.
Translational accelerations
As demonstrated previously34,35, the addition of any helmet to the bare head form caused a significant decrease in peak dimensionless acceleration and a corresponding decrease in the regression coefficients relating the peak accelerations to the impulse delivered. Among the four helmets tested for this study, the translational impact mitigation ranged from 0.643 to 0.872 (Table 2). For the base models, the H1 exhibited a reduction in translational impact mitigation of at least 0.05 for five impact types (impact types 5 - 8, and 10) and did not exhibit an increase of at least 0.05 for any impact types. In contrast, the H2 demonstrated an increase in translational impact mitigation of at least 0.05 for five impact types (impact types 5 - 8, and 10) and no decreases of that magnitude.
On an impact type basis, the H2T achieved the maximum mitigation for eight of the 14 impact location/incidence types (Table 2). The H2Q performed best for two types: impact type 7 - tied with the H2T - and impact type 9. Interestingly, two helmets from a previous study, the Vicis Zero 1 and Riddell SpeedFlex 18, each performed best for two impact types (impact types 1 and 2). The H2 achieved the maximum mitigation for impact type 6, while the H1 did not register any of the top performances.
Rotational accelerations
The impact mitigation for rotational accelerations ranged from 0.444 to 0.882 for impact type 14 (Table 3). For the base models, the H1 exhibited a reduction in rotational impact mitigation of at least 0.05 for five impact types (impact types 2, 5, 7, 10, and 13) and an increase of at least 0.05 only for impact type 12. In contrast, the H2 demonstrated an increase in rotational impact mitigation of at least 0.05 for nine impact types (impact types 3-6, 8, 9, and 12-14) and a decrease of that magnitude only for impact type 11.
The H2 achieved the maximum mitigation for seven of the 14 impact types (Table 3). The H2Q performed best for two impact types: (impact types 2 and 4). The H2T performed best for impact type 12. Interestingly, two previously tested models performed best for two impact types apiece: the Schutt Pro VTD II exhibited the highest impact mitigation for impact types 7 and 10, while the Vicis Zero 1 performed best for impact types 1 and 1135.
This study represents the first time that any football helmet tested according to this protocol has demonstrated impact mitigation greater than 50% for impact type 9. Three helmets, the H1, H2, and H2T, all surpassed that mark, with the H2 demonstrating the best response at 0.529 (Table 3). Interestingly, the H2Q only reached 0.473 for this impact type, which is substantially lower than the value for the base model.
On the Frontal Aspect (impact types 1-4, 13, and 14), the chief region of import to offensive and defensive line players, the H2T was demonstrably the best at mitigating translational accelerations, with the highest mitigation scores at four of the six locations (Table 2). In contrast, the H2T was less effective at mitigating rotational accelerations on the Frontal Aspect, being outperformed for every associated impact type (Table 3) by the Vicis Zero 1, H2, or the H2Q.
Across the Rear Aspect (impact types 7-10), the primary region of import to quarterbacks and some receivers, the best performing helmets were the H2 and the previously tested Schutt Pro VTD II.
DATA AVAILABILITY:
All data used for the calculations described herein will be made available through UC Figshare (DOI: 10.60696/uc.30661718).
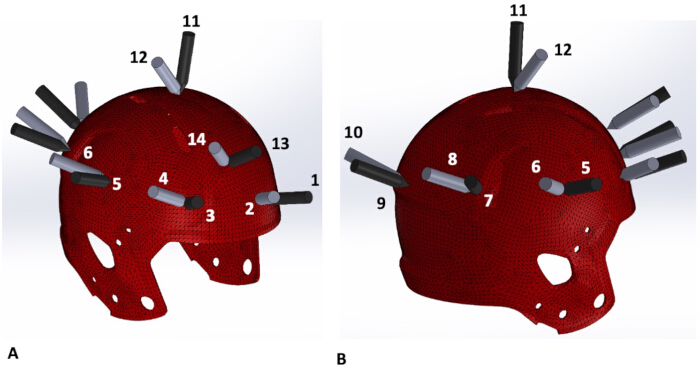
Figure 1: Fourteen different types of impacts were delivered via a modally tuned impulse hammer to a Hybrid III head form. In the front view (A) and the rear view (B), normal impacts are denoted by black arrows while the gray arrows represent oblique impacts, which were delivered at an angle of approximately 45 degrees to the surface normal. The impact locations and types were denoted by (1) Front-Normal, (2) Front-Oblique, (3) Front Boss-Normal, (4) Front Boss-Oblique, (5) Side-Normal, (6) Side-Oblique, (7) Rear Boss-Normal, (8) Rear Boss-Oblique, (9) Rear-Normal, (10) Rear-Oblique, (11) Top-Normal, (12) Top-Oblique, and, at the location of the SpeedFlex Cut Out, both (13) Cut Out-Normal and (14) Cut Out-Oblique. Please click here to view a larger version of this figure.
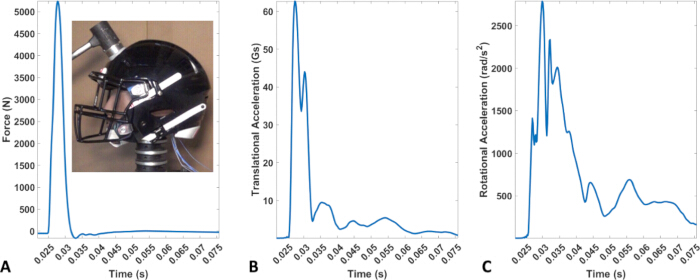
Figure 2: A Front-Normal impact delivered to a common football helmet that demonstrates the peak deformation, the corresponding force (A), translational acceleration (B), and rotational acceleration (C), shown as functions of time. Please click here to view a larger version of this figure.
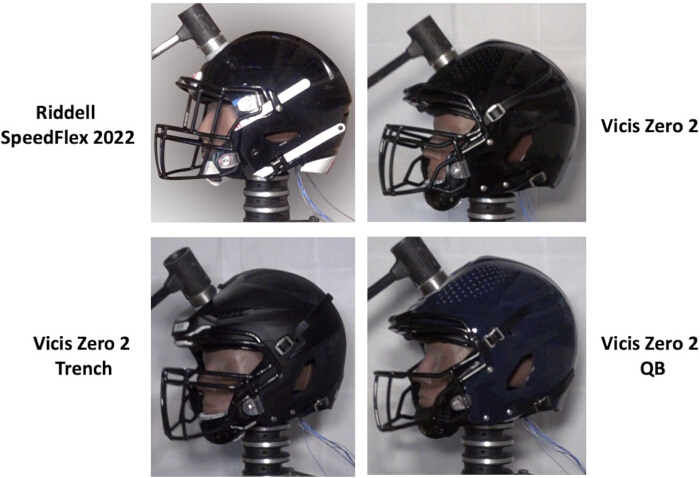
Figure 3: The peak deformation observed during a Front-Normal impact delivered to each of the four helmets studied herein. The images demonstrate the relative stiffness of the H1 helmet shell and the relative compliance of the shells used to fabricate the H2 and H2Q. For the same impact magnitude, the H2T engages less of the helmet shell than does the H2 or the H2Q. Please click here to view a larger version of this figure.
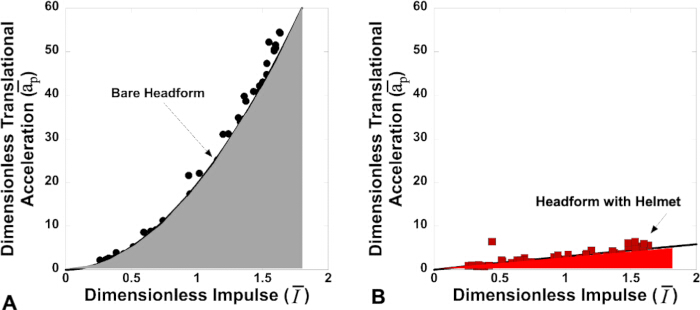
Figure 4: Translational impact mitigation was measured using the peak translational accelerations (A) for the bare head form and the corresponding translational accelerations (B) for the helmeted head form for each helmet type. The presence of the helmet dramatically decreased both the measured accelerations. In order to calculate the impact mitigation, the peak accelerations for the bare and helmeted head forms were measured and used to calculate the dimensionless impulse, , and the dimensionless translational acceleration, . Integrating the areas under the curve for the bare head form, subtracting the corresponding area for the helmeted head form, and normalizing by the area under the bare head form provided a value between zero and one. Rotational impact mitigation was calculated similarly. Please click here to view a larger version of this figure.
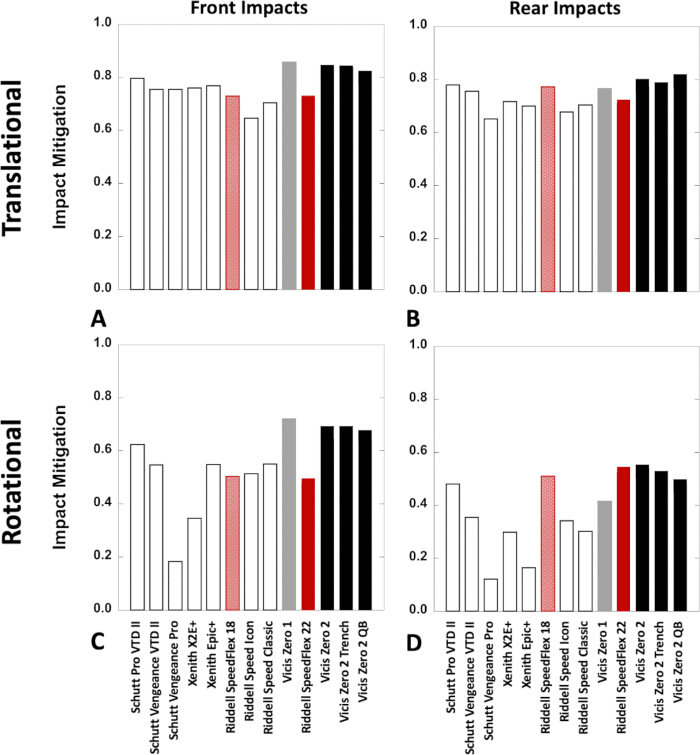
Figure 5: Summary of translational and rotational impact mitigation for two of the 14 different impact types studied herein across all the helmets tested using this method to date. Mitigation of translational accelerations for Front Normal (Type 1) impacts (A) illustrates a subtle improvement in the Riddell SpeedFlex and little change in the Vicis helmets. Mitigation of translational accelerations for Rear Normal (Type 9) impacts (B) exhibited similar changes for the Riddell and subtle improvements for the Vicis helmets. Interestingly, both helmet types regressed slightly when it came to mitigating rotational accelerations for frontal impacts (C). The most dramatic improvements in rotational impact mitigation were observed for rear impacts (D) with both the Riddell SpeedFlex and Vicis Zero 2 exhibiting the highest values to date. Please click here to view a larger version of this figure.
| Helmet Type | Mass (kg) | Shell Material |
| H1 | 2.074 | Polycarbonate |
| H2 | 2.015 | Thermoplastic elastomer |
| H2T | 2.243 | Thermoplastic elastomer |
| H2Q | 1.986 | Thermoplastic elastomer |
Table 1: Mass and shell material for each helmet tested.
| Impact Type | SpeedFlex | H1 | Vicis | H2 | H2T | H2Q | |
| Aspect | 18 | Zero 1 | |||||
| 1 | Frontal | 0.705 | 0.706 | 0.832 | 0.821 | 0.82 | 0.799 |
| 2 | Frontal | 0.744 | 0.733 | 0.817 | 0.803 | 0.804 | 0.791 |
| 3 | Frontal | 0.75 | 0.751 | 0.786 | 0.798 | 0.805 | 0.779 |
| 4 | Frontal | 0.741 | 0.756 | 0.759 | 0.792 | 0.804 | 0.78 |
| 5 | 0.804 | 0.703 | 0.726 | 0.781 | 0.773 | 0.801 | |
| 6 | 0.808 | 0.756 | 0.713 | 0.811 | 0.81 | 0.807 | |
| 7 | Rear | 0.747 | 0.643 | 0.698 | 0.748 | 0.754 | 0.754 |
| 8 | Rear | 0.779 | 0.703 | 0.699 | 0.758 | 0.766 | 0.762 |
| 9 | Rear | 0.747 | 0.699 | 0.741 | 0.777 | 0.764 | 0.795 |
| 10 | Rear | 0.756 | 0.7 | 0.715 | 0.787 | 0.788 | 0.775 |
| 11 | 0.701 | 0.697 | 0.832 | 0.804 | 0.832 | 0.783 | |
| 12 | 0.753 | 0.748 | 0.823 | 0.866 | 0.872 | 0.848 | |
| 13 | Frontal | 0.741 | 0.719 | 0.817 | 0.834 | 0.836 | 0.819 |
| 14 | Frontal | 0.767 | 0.77 | 0.808 | 0.846 | 0.853 | 0.824 |
Table 2: Mitigation of translational accelerations by impact type. Gray shading indicates helmets tested as part of the current study. Bold numbers indicate the best performance to date for a given impact type.
| Impact Type | SpeedFlex | H1 | Vicis | H2 | H2T | H2Q | |
| Aspect | 18 | Zero 1 | |||||
| 1 | Frontal | 0.479 | 0.472 | 0.698 | 0.669 | 0.669 | 0.653 |
| 2 | Frontal | 0.55 | 0.444 | 0.727 | 0.716 | 0.696 | 0.738 |
| 3 | Frontal | 0.684 | 0.676 | 0.769 | 0.842 | 0.832 | 0.814 |
| 4 | Frontal | 0.728 | 0.738 | 0.773 | 0.848 | 0.843 | 0.853 |
| 5 | 0.811 | 0.758 | 0.783 | 0.863 | 0.84 | 0.846 | |
| 6 | 0.811 | 0.775 | 0.801 | 0.871 | 0.853 | 0.858 | |
| 7 | Rear | 0.73 | 0.585 | 0.698 | 0.747 | 0.736 | 0.666 |
| 8 | Rear | 0.578 | 0.613 | 0.479 | 0.622 | 0.594 | 0.595 |
| 9 | Rear | 0.483 | 0.52 | 0.391 | 0.529 | 0.505 | 0.473 |
| 10 | Rear | 0.701 | 0.621 | 0.693 | 0.706 | 0.692 | 0.688 |
| 11 | 0.564 | 0.57 | 0.723 | 0.67 | 0.698 | 0.642 | |
| 12 | 0.619 | 0.75 | 0.769 | 0.846 | 0.853 | 0.762 | |
| 13 | Frontal | 0.53 | 0.477 | 0.755 | 0.811 | 0.789 | 0.795 |
| 14 | Frontal | 0.685 | 0.69 | 0.778 | 0.882 | 0.878 | 0.855 |
Table 3: Mitigation of rotational accelerations by impact type. Gray shading indicates helmets tested as part of the current study. Bold numbers indicate the best performance to date for a given impact type.
Discussion
While the latest generation of helmets was found to mitigate 64%-87% of the translational accelerations, and 44%-88% of the rotational accelerations, the Rear Aspect of modern football helmets continues to exhibit poor impact mitigation in general, especially for impact type 9. Further, while the newer H1 did not, in general, perform better than the SpeedFlex 18 according to this testing protocol, the newer Vicis helmets did exhibit generalized improvement, with the rotational impact mitigation at the back of the helmet surpassing 50% for the first time.
Critically, however, the continued discrepancy in impact mitigation scores between the Frontal Aspect and the Rear Aspect of the helmet should be recognized as obviating the use of a single metric to determine the quality of a given helmet34,35,48,49,50. The H2T, which performed well in mitigating translational accelerations but poorly in mitigating rotational accelerations, provides a clear illustration of the pitfall of using a singular metric for such a complex behavioral profile. Historically, modern football helmets have had success mitigating translational accelerations, but considerably more variable performance when considering rotational accelerations34,35 (Figure 5).
It should also be noted that the design goals of the position-specific helmets do not appear to be met by the current iteration of helmets. For position-specific helmets, it is important to distinguish between translational accelerations, for many years the only test mode required by NOCSAE, and rotational accelerations, often thought to be the most relevant to the development of brain trauma36,37,38,39,40,41. One of the strengths of the methodology used herein is that the translational and rotational accelerations are characterized, normalized, and nondimensionalized separately, making it possible to consider both in the overall evaluation and design of helmet performance. Another strength is the use of the bare head impacts to normalize the data set, effectively eliminating differences in neck stiffness that may be observed due to asymmetries in the Hybrid III neck structure and providing simple resultant translational and rotational mitigations that vary from zero to one at each location. This analysis is feasible because of the simultaneous integration of an impulse hammer to measure the force as a function of time delivered to the head form and an accelerometer array to measure the resulting accelerations.
While there has been considerable effort to characterize head accelerations during practices and games at many different levels of play21,51,52,53,54,55,56,57,58,59,60,61,62, the magnitude of the forces generated during head impacts has not been characterized in situ. In order to provide an estimate of the peak contact forces experienced in football, it was noted that high school football players and women's soccer players exhibit nearly identical distributions of head acceleration events61. A laboratory-based study of head impacts in soccer63 in which the measured peak impact force was approximately 4,600 N. Accounting for the added mass of the helmet, one would expect the peak forces to be roughly 30% higher. The peak contact force generated during this study was 5,307 N, which is within the expected range of 6,000 N.
Linemen typically experience the highest percentage of impacts to the frontal region1,12,59,64,65. The H2T was the best at mitigating Frontal Aspect translational accelerations, but was outperformed by other helmets when rotational accelerations were considered. The extra material added to the front of the helmet increased its mass, likely helping it mitigate the translational accelerations, but appeared to interfere with the ability of the shell to deform, causing higher rotational accelerations. This is a surprising design strategy since it is well-documented that the Vicis helmet's primary energy dissipation mechanism is the flexibility of the shell.
In contrast, quarterbacks, and many receivers, often experience severe impacts to the back of the head. The H2Q performed best for two of the four Rear Aspect impact types when translational accelerations were considered, but none of the Rear Aspect impact types when rotational accelerations were considered. It is not clear why the H2Q did not perform as well in the Rear Aspect as compared to the base H2. There were no obvious differences in the structure of the helmets, but the manufacturer notes a difference in padding material in some, unspecified locations. Future work should examine all of the H2 models in more detail with an emphasis on the mechano-chemical analysis of the shells66 and padding, as well as the development of high-resolution computational models to analyze the dynamic structural characteristics67,68,69,70,71,72,73. The data collected herein would ideally be combined with previous mechanical characterization of the various materials that make up the helmet66 for the generation of finite element analyses because the use of the modally tuned impulse hammer provides a well-defined force input to accompany the resultant acceleration. Ideally, this analysis would be performed within the context of a sensitivity framework74,75,76,77.
The current method is acknowledged to exhibit some variability due to the fact that a human delivers each blow over a pre-defined range. To compensate, it was ensured that each mitigation metric is the result of 60 independent blows distributed over an established range of impulses. Consequently, this can be viewed as a feature of the testing protocol since on-field impacts are delivered with an inherent level of randomness with regard to their magnitude, location, and angle of inclination to the surface of the helmet. Another consideration is the size of the hammer face. For helmet-to-helmet contact, the hammer face acts over a larger area than does the helmet. In contrast, for helmet-to-ground, it generates a smaller contact area than does the turf. Future work should examine the nature of these impacts more precisely. A more general weakness of any helmet testing protocol is the lack of data quantifying the actual impact forces experienced on the field. Future work needs to address this issue experimentally, as it will help refine the range of impulses over which impact mitigation should be calculated for each location on the helmet.
Disclosures
The authors certify that they have no conflict of interest related to this study.
Acknowledgements
Support for this work was supplied in part by the Ohio Bureau of Workers' Compensation, Project # WSIC25-240315-028.
Materials
| Name | Company | Catalog Number | Comments |
|---|---|---|---|
| Accelerometer wire | PCB Piezotronics | Model 030C10 | Six required. |
| Adult football helmet size large | Helmet Types Listed Below | NA | Three of each model used to maintain external validity. |
| Data acquisition module | National Instruments | 9234 | |
| Hybrid III 50th percentile male head assembly | Humanetics | 78051-61X-H | |
| Hybrid III 50th percentile male neck assembly | Humanetics | 78051-90-H | |
| LabView Software | National Instruments | NA | |
| Laptop | Dell | XPS 16 | Other models acceptable. |
| Large sledge soft rubber tip | PCB Piezotronics | Model 084A30. | |
| Low noise hammer cable | PCB Piezotronics | Model 003D20 | |
| Modally tuned impulse hammer | PCB Piezotronics | Model 086D20 | |
| Steel plates | Midwest Steel and Aluminum | 12"x12"x1" | Five plates drilled and bolted to form base for neck. |
| Triaxial accelerometer | PCB Piezotronics | Model 356A03 | |
| Triaxial Accelerometer Cable | PCB Piezotronics | Model 034G05 | |
| Uniaxial accelerometer | PCB Piezotronics | Model 352C22/NC | Six required. |
| Riddell Speedflex | Denoted by "H1" | ||
| Vicis Zero 2 | Denoted by "H2" | ||
| Vicis Zero 2 Trench | Denoted by "H2T" | ||
| Vicis Zero 2 QB | Denoted by "H2Q" |
References
- Breedlove, E. L., et al. Biomechanical correlates of symptomatic and asymptomatic neurophysiological impairment in high school football. J Biomech. 45 (7), 1265-1272 (2012).
- Langlois, J. A., Rutland-Brown, W., Wald, M. M. The epidemiology and impact of traumatic brain injury: A brief overview. J Head Trauma Rehabil. 21 (5), 375-378 (2006).
- Langlois, J. A., Rutland-Brown, W., Thomas, K. E. Traumatic Brain Injury in the United States: Emergency Department Visits, Hospitalizations, and Deaths. , (2006).
- Black, A. M., Sergio, L. E., Macpherson, A. K. The epidemiology of concussions: Number and nature of concussions and time to recovery among female and male Canadian varsity athletes. Clin J Sport Med. 27 (1), 52-56 (2008).
- Baugh, C. M., et al. Frequency of head-impact-related outcomes by position in NCAA Division I collegiate football players. J Neurotrauma. 32 (5), 314-326 (2015).
- McCrea, M., Hammeke, T., Olsen, G., Leo, P., Guskiewicz, K. Unreported concussion in high school football players: Implications for prevention. Clin J Sport Med. 14 (1), 13-17 (2004).
- Baugh, C. M., Kroshus, E., Meehan, W. P. III, McGuire, T. G., Hatfield, L. A. Accuracy of US college football players' estimates of their risk of concussion or injury. JAMA Netw Open. 3 (12), e2031509(2020).
- Baugh, C. M., Kroshus, E., Meehan, W. P., Campbell, E. G. Trust, conflicts of interest, and concussion reporting in college football players. J Law Med Ethics. 48 (2), 307-314 (2020).
- Baugh, C. M. Athlete concussion reporting: It is time to think bigger. J Adolesc Health. 66 (6), 643-644 (2020).
- Logsdon, A. F., et al. Role of microvascular disruption in brain damage from traumatic brain injury. Compr Physiol. 5 (3), 1147-1160 (2015).
- Bailes, J. E., Petraglia, A. L., Omalu, B. I., Nauman, E., Talavage, T. Role of subconcussion in repetitive mild traumatic brain injury. J Neurosurg. 119 (5), 1235-1245 (2013).
- Talavage, T. M., et al. Functionally-detected cognitive impairment in high school football players without clinically-diagnosed concussion. J Neurotrauma. 31 (4), 327-338 (2014).
- Poole, V. N., et al. MR spectroscopic evidence of brain injury in the non-diagnosed collision sport athlete. Dev Neuropsychol. 39 (6), 459-473 (2014).
- Abbas, K., et al. Effects of repetitive sub-concussive brain injury on the functional connectivity of default mode network in high school football athletes. Dev Neuropsychol. 40 (1), 51-56 (2015).
- Abbas, K., et al. Alteration of default mode network in high school football athletes due to repetitive subconcussive mild traumatic brain injury: A resting-state functional magnetic resonance imaging study. Brain Connect. 5 (2), 91-101 (2015).
- Poole, V. N., et al. Sub-concussive hit characteristics predict deviant brain metabolism in football athletes. Dev Neuropsychol. 40 (1), 12-17 (2015).
- Bari, S., et al. Dependence on subconcussive impacts of brain metabolism in collision sport athletes: An MR spectroscopic study. Brain Imaging Behav. 13 (3), 735-749 (2019).
- Svaldi, D. O., et al. Cerebrovascular reactivity changes in asymptomatic female athletes attributable to high school soccer participation. Brain Imaging Behav. 11 (1), 98-112 (2017).
- Chun, I. Y., et al. DTI detection of longitudinal WM abnormalities due to accumulated head impacts. Dev Neuropsychol. 40 (2), 92-97 (2015).
- Diekfuss, J. A., et al. Evaluation of the effectiveness of newer helmet designs with emergent shell and padding technologies versus older helmet models for preserving white matter following a season of high school football. Ann Biomed Eng. 49 (10), 2863-2874 (2021).
- Jang, I., et al. Every hit matters: White matter diffusivity changes in high school football athletes are correlated with repetitive head acceleration event exposure. Neuroimage Clin. 24, 101930(2019).
- Montenigro, P. H., et al. Cumulative head impact exposure predicts later-life depression, apathy, executive dysfunction, and cognitive impairment in former high school and college football players. J Neurotrauma. 34 (2), 228-340 (2016).
- Turner, R. C., et al. Repetitive traumatic brain injury and development of chronic traumatic encephalopathy: A potential role for biomarkers in diagnosis, prognosis, and treatment. Front Neurol. 3, 186(2012).
- McKee, A. C., et al. Chronic traumatic encephalopathy in athletes: Progressive tauopathy after repetitive head injury. J Neuropathol Exp Neurol. 68 (7), 709-735 (2009).
- Omalu, B. I., Hamilton, R. L., Kamboh, M. I., DeKosky, S. T., Bailes, J. Chronic traumatic encephalopathy (CTE) in a National Football League player: Case report and emerging medicolegal practice questions. J Forensic Nurs. 6 (1), 40-46 (2010).
- Stern, R. A., et al. Long-term consequences of repetitive brain trauma: chronic traumatic encephalopathy. PM R. 3 (10 Suppl 2), S460-S467 (2011).
- Levy, M. L., Ozgur, B. M., Berry, C., Aryan, H. E., Apuzzo, M. L. Birth and evolution of the football helmet. Neurosurgery. 55 (3), discussion 661-652 661-652 (2004).
- Bartsch, A., Benzel, E., Miele, V., Prakash, V. Impact test comparisons of 20th and 21st century American football helmets. J Neurosurg. 116 (1), 222-233 (2012).
- Breedlove, K. M., Breedlove, E. L., Bowman, T. G., Arruda, E. M., Nauman, E. A. The effect of football helmet facemasks on impact behavior during linear drop tests. J Biomech. 79, 227-231 (2018).
- Bartsch, A., Benzel, E., Miele, V., Morr, D., Prakash, V. Hybrid III anthropomorphic test device (ATD) response to head impacts and potential implications for athletic headgear testing. Accid Anal Prev. 48, 285-291 (2012).
- Post, A., Dawson, L., Hoshizaki, T. B., Gilchrist, M. D., Cusimano, M. D. Development of a test method for adult ice hockey helmet evaluation. Comput Methods Biomech Biomed Engin. , 1-13 (2020).
- Clark, J. M., Hoshizaki, T. B., Gilchrist, M. D. Protective capacity of an ice hockey goaltender helmet for three events associated with concussion. Comput Methods Biomech Biomed Engin. 20 (12), 1299-1311 (2017).
- Hoshizaki, T. B., Post, A., Oeur, R. A., Brien, S. E. Current and future concepts in helmet and sports injury prevention. Neurosurgery. 75 (Suppl 4), S136-S148 (2014).
- Cummiskey, B., et al. Quantitative evaluation of impact attenuation by football helmets using a modal impulse hammer. Proc IMechE Part P: J Sports Eng Technol. 233 (2), 301-311 (2019).
- McIver, K. G., et al. Design considerations for the attenuation of translational and rotational accelerations in American football helmets. J Biomech Eng. 145 (6), 061008(2023).
- Ommaya, A. K., Hirsch, A. E., Flamm, E. S., Mahone, R. H. Cerebral concussion in the monkey: an experimental model. Science. 153 (3732), 211-212 (1966).
- Ommaya, A. K., Grubb, R. L. Jr, Naumann, R. A. Coup and contre-coup injury: observations on the mechanics of visible brain injuries in the rhesus monkey. J Neurosurg. 35 (5), 503-516 (1971).
- Ommaya, A. K., Boretos, J. W., Beile, E. E. The Lexan calvarium: an improved method for direct observation of the brain. J Neurosurg. 30 (1), 25-29 (1969).
- Ommaya, A. K., Faas, F., Yarnell, P. Whiplash injury and brain damage: An experimental study. JAMA. 204 (4), 285-289 (1968).
- Goldsmith, W., Monson, K. L. The state of head injury biomechanics: past, present, and future Part 2: physical experimentation. Crit Rev Biomed Eng. 33 (2), 105-207 (2005).
- Goldsmith, W. The state of head injury biomechanics: past, present, and future: Part 1. Crit Rev Biomed Eng. 29 (5-6), 441-600 (2001).
- Holbourn, A. Mechanics of head injuries. Lancet. 242 (6267), 438-441 (1943).
- Ommaya, A. K., Hirsch, A. E., Yarnell, P., Harris, E. H. Technical Report 670906: Scaling of experimental data on cerebral concussion in sub-human primates to concussion threshold for man. SAE Tech Paper. , (1967).
- Cummiskey, B., et al. Reliability and accuracy of helmet-mounted and head-mounted devices used to measure head accelerations. Proc IMechE Part P: J Sports Eng Technol. 231 (2), 144-153 (2017).
- Padgaonkar, A. J., Krieger, K. W., King, A. I. Measurement of angular acceleration of a rigid body using linear accelerometers. ASME J Appl Mech. 42 (3), 552-556 (1975).
- Barenblatt, G. I. Scaling, self-similarity, and intermediate asymptotics: Dimensional analysis and intermediate asymptotics. , Cambridge University Press. (1996).
- McIver, K. G., et al. Impact attenuation of male and female lacrosse helmets using a modal impulse hammer. J Biomech. 95, 109313(2019).
- Leiva-Molano, N., et al. Evaluation of impulse attenuation by football helmets in the frequency domain. J Biomech Eng. 142 (6), 061012(2020).
- Rowson, B., Rowson, S., Duma, S. M. Hockey STAR: a methodology for assessing the biomechanical performance of hockey helmets. Ann Biomed Eng. 43 (10), 2429-2443 (2015).
- Rowson, S., Duma, S. M. Development of the STAR evaluation system for football helmets: integrating player head impact exposure and risk of concussion. Ann Biomed Eng. 39 (8), 2130-2140 (2011).
- Linder, A. A new mathematical neck model for a low-velocity rear-end impact dummy: evaluation of components influencing head kinematics. Accid Anal Prev. 32 (2), 261-269 (2000).
- Guskiewicz, K. M., et al. Measurement of head impacts in collegiate football players: relationship between head impact biomechanics and acute clinical outcome after concussion. Neurosurgery. 61 (6), discussion 1252-1243 1244-1252 (2007).
- McCaffrey, M. A., Mihalik, J. P., Crowell, D. H., Shields, E. W., Guskiewicz, K. M. Measurement of head impacts in collegiate football players: clinical measures of concussion after high- and low-magnitude impacts. Neurosurgery. 61 (6), discussion 1243 1236-1243 (2007).
- Greenwald, R. M., Gwin, J. T., Chu, J. J., Crisco, J. J. Head impact severity measures for evaluating mild traumatic brain injury risk exposure. Neurosurgery. 62 (4), 789-798 (2008).
- Duma, S. M., et al. Analysis of real-time head accelerations in collegiate football players. Clin J Sport Med. 15 (1), 3-8 (2005).
- Brolinson, P. G., et al. Analysis of linear head accelerations from collegiate football impacts. Curr Sports Med Rep. 5 (1), 23-28 (2006).
- Siegmund, G. P., Guskiewicz, K. M., Marshall, S. W., DeMarco, A. L., Bonin, S. J. A headform for testing helmet and mouthguard sensors that measure head impact severity in football players. Ann Biomed Eng. 42 (9), 1834-1845 (2014).
- Lee, T. A., et al. Distribution of head acceleration events varies by position and play type in North American football. Clin J Sport Med. , (2020).
- Robinson, M. E., et al. The role of location of subconcussive head impacts in fMRI brain activation change. Dev Neuropsychol. 40 (2), 74-79 (2015).
- Broglio, S. P., et al. Cumulative head impact burden in high school football. J Neurotrauma. 28 (10), 2069-2078 (2011).
- Lee, T., et al. Head acceleration event metrics in youth contact sports more dependent on sport than level of play. Proc Inst Mech Eng H. 235 (2), 208-221 (2021).
- Walter, A. E., et al. Head acceleration event exposure and cognitive and functional outcomes: A comparison of multiple football seasons. Res Sports Med. 32 (1), 122-131 (2024).
- Auger, J., et al. Factors affecting peak impact force during soccer headers and implications for the mitigation of head injuries. PLoS One. 15 (10), e0240162(2020).
- Broglio, S. P., Eckner, J. T., Kutcher, J. S. Field-based measures of head impacts in high school football athletes. Curr Opin Pediatr. 24 (6), 702-708 (2012).
- Broglio, S. P., et al. Head impacts during high school football: A biomechanical assessment. J Athl Train. 44 (4), 342-349 (2009).
- Bower, D., et al. Mechanical characterization of athletic helmet shells. Sports Biomech. 23 (2), 241-252 (2024).
- Giudice, J. S., et al. Finite element model of a deformable American football helmet under impact. Ann Biomed Eng. 48 (5), 1524-1539 (2020).
- Bruneau, D. A., Cronin, D. S. Head and neck response of an active human body model and finite element anthropometric test device during a linear impactor helmet test. J Biomech Eng. 142 (2), (2020).
- Darling, T., Muthuswamy, J., Rajan, S. D. Finite element modeling of human brain response to football helmet impacts. Comput Methods Biomech Biomed Engin. 19 (13), 1432-1442 (2016).
- Sport helmet design and virtual impact test by image-based finite element modeling. Luo, Y., Liang, Z. Annu Int Conf IEEE Eng Med Biol Soc, 2013, 7237-7240 (2013).
- Clark, J. M., Hoshizaki, T. B., Gilchrist, M. D. Assessing women's lacrosse head impacts using finite element modelling. J Mech Behav Biomed Mater. 80, 20-26 (2018).
- Post, A., Oeur, A., Walsh, E., Hoshizaki, B., Gilchrist, M. D. A centric/non-centric impact protocol and finite element model methodology for the evaluation of American football helmets to evaluate risk of concussion. Comput Methods Biomech Biomed Engin. 17 (16), 1785-1800 (2014).
- Post, A., Hoshizaki, B., Gilchrist, M. D. Finite element analysis of the effect of loading curve shape on brain injury predictors. J Biomech. 45 (4), 679-683 (2012).
- Cotter, S. A screening design for factorial experiments with interactions. Biometrika. 66 (2), 317-320 (1979).
- Cook, D., Julias, M., Nauman, E. Biological variability in biomechanical engineering research: significance and meta-analysis of current modeling practices. J Biomech. 47 (6), 1241-1250 (2014).
- Cook, D. D., Nauman, E., Mongeau, L. Ranking vocal fold model parameters by their influence on modal frequencies. J Acoust Soc Am. 126 (4), 2002-2010 (2009).
- Schuff, M. M., Gore, J. P., Nauman, E. A. A mixture theory model of fluid and solute transport in the microvasculature of normal and malignant tissues. II: factor sensitivity analysis, calibration, and validation. J Math Biol. 67 (6-7), 1307-1337 (2013).
Reprints and Permissions
