We describe a procedure used to collect in situ photo-rheology measurements of polymeric materials undergoing photo-responsive liquid-to-solid transitions.
Method Article
In situ Photo-rheology Monitors Viscoelastic Changes in Photo-responsive Polymer Networks
In This Article
Summary
Abstract
In situ photo-rheology is a powerful technique for characterizing the evolution of photo-responsive materials during irradiation. This technique enables time-resolved analysis of the mechanical properties of materials undergoing photo-induced molecular changes, such as during additive manufacturing, photo-polymerization, or photo-stimulation. We present a rheological method to monitor dynamic network formation by photo-responsive star polymers. This article describes procedures to configure a rheometer for simultaneous measurement and irradiation, prepare and load photo-responsive polymer samples, identify appropriate measurement parameters, and analyze time-resolved viscoelasticity. Mechanical and kinetic information provides insight into the dynamics of photo-responsive polymer networks. The goal of this protocol is to provide an example of experimental parameter selection, in situ photo-rheological measurements, and mechanical analysis of photo-responsive materials undergoing irradiation. Additionally, this protocol identifies potential modifications to customize the setup for many possible photo-responsive systems, thereby providing guidelines for future users across the materials science community. In situ photo-rheology improves the understanding of photo-responsive material properties, which is important for engineering materials with predictable processing by additive manufacturing, tunable mechanical performance, and stimuli-responsive functions.
Introduction
Photo-rheology enables the study of a wide range of light-responsive materials, including resins for 3D printing1,2, polymerizable ionic liquids3 as safer electrolytes4,5, and bioadhesives that improve surgery outcomes6. In these applications, it is crucial to understand the mechanical evolution of systems undergoing irradiation7,8. To investigate such systems, photo-rheology combines sample irradiation with simultaneous rheological measurements. This approach provides real-time insights into dynamic moduli, gelation kinetics, and processing conditions during the stimulation of photo-responsive materials9,10,11,12. Photo-rheology enables data collection that informs the design of optimal photo-responsive materials for versatile applications.
During photo-rheology, simultaneous irradiation and measurement require delivering light to a sample while performing a rheological test. In situ irradiation is achieved by replacing at least one rheometer plate with an optically transparent material. This experimental setup introduces many considerations for accurate data collection, including but not limited to plate transparency, light source, irradiation characteristics, and temperature control within the context of the rheometer setup. First, a rheometer plate must be transparent to the system's wavelength of interest. For example, quartz is ideal for ultraviolet irradiation13, whereas glass is preferable for visible wavelengths14. Second, the light source must be readily coupled to the rheometer. Small LEDs are often easy to mount, sustain long lifespans, and provide tunable power to drive photoreactions. Other possible light sources include lamps and lasers. Third, specific light characteristics such as collimation, polarization, and spectral range may be controlled using lenses, waveguides, and filters. Fourth, sample irradiation may lead to temperature gradients15, which are typically mitigated using Peltier temperature control. If the sample has a volatile component, evaporation may be prevented using solvent traps, sample hoods, humidification, or immiscible sealants16,17,18. Finally, the sample, light source, and the user may need physical separation to protect the sample from ambient light or protect the user from the light source, depending on its wavelength and intensity. These considerations are unique to each system and will affect the selection of photo-rheometer components.
An exemplary photo-responsive material is multi-arm star poly(ethylene glycol) appended with anthracene (PEG-anthracene)19,20,21,22,23,24. Anthracene is a photo-responsive molecule that can form dimers upon exposure to UVA light (315-400 nm), which dissociate upon subsequent exposure to UVC light (200-280 nm)25,26. When appended to multi-arm star polymers, anthracene acts as a photo-responsive cross-linker, enabling networks to form and degrade in response to UVA or UVC light, respectively27. Using photo-rheology, we measure photo-driven transitions between liquid solutions and solid networks. These data enable detailed quantification of network formation kinetics and dynamic mechanical properties of PEG-anthracene during irradiation, allowing for optimization of material formulation, processing, and use in specific applications.
In this article, we describe a photo-rheology setup to study light-responsive materials, such as PEG-anthracene, during network formation and degradation upon irradiation with UV light. This article describes the procedure used to collect in situ photo-rheology data, with the goal of demonstrating how a photo-rheology setup can be designed. To guide future users from broad research backgrounds, we note where different choices can customize the setup for other photo-responsive systems. Representative results demonstrate dynamic moduli evolution during sample irradiation and reveal insights into improved material designs and processing techniques. Photo-rheology enables the measurement of light-induced changes to mechanical properties, making it a powerful tool to probe photo-responsive systems.
Protocol
1. Setting up the rheometer
- Install the upper Peltier plate or other temperature control mechanism onto the rheometer. To install the upper Peltier plate, use the manufacturer-provided hex wrench (Figure 1Ai) to evenly secure the plate onto the rheometer head. Then, connect the plate to the rheometer input port and connect the coolant tubes to the coolant ports.
NOTE: Temperature control mechanisms are particularly important in photo-rheology because input irradiation may lead to heating of the sample. It is important to avoid thermal fluctuations due to either sample irradiation or changes to the ambient environment since viscoelastic properties are temperature-dependent28. In a photo-rheology setup, there is often a large working space under the lower optics plate to accommodate the light source. This added height can make it difficult to install the upper plate and geometry after installing the lower plate. Therefore, install the upper Peltier plate first. - Install the spindle through the rheometer and Peltier plate. Perform an inertia calibration on the bare spindle to determine the moment of inertia of the instrument29.
- Install the geometry onto the rheometer spindle. The geometry determines the shear flow profile.
- To install the geometry, slide the geometry up through the Peltier temperature control unit onto the rheometer spindle (Figure 1Aii-iii). Use the heat spreader wrench to hold the geometry while gently turning the spindle to screw the geometry into place. Once secure, gently rotate the spindle and observe the geometry to verify a smooth and balanced spin. Ensure the geometry is clean and dry before proceeding.
NOTE: A parallel plate geometry enables uniform irradiation of the sample, which is not possible with cone-and-plate or cup-and-bob geometries. A parallel plate also enables an adjustable sample gap, which sets the material thickness. Smaller gaps may be required to maintain uniform light penetration through an entire sample volume. - Choose the plate diameter based on sensitivity to the sample at its greatest stiffness. In this procedure, a 25 mm diameter was used.
- Choose the surface finish of the plate to prevent slip between the sample and the plate, if necessary. This procedure used a smooth plate. Slip-prone samples may benefit from sandblasted or crosshatched plates, or chemical treatment to maintain plate transparency.
- If the sample of interest is adhesive, use a disposable geometry. This procedure uses a disposable plate, but the plate is not replaced after each sample.
- To install the geometry, slide the geometry up through the Peltier temperature control unit onto the rheometer spindle (Figure 1Aii-iii). Use the heat spreader wrench to hold the geometry while gently turning the spindle to screw the geometry into place. Once secure, gently rotate the spindle and observe the geometry to verify a smooth and balanced spin. Ensure the geometry is clean and dry before proceeding.
- Install the lower optics plate (Figure 1B-D).
- To perform photo-rheology, ensure uniform irradiation of samples during measurement. Samples are typically irradiated through a transparent lower plate, which sits above a light source.
NOTE: This procedure uses the TA Instruments Optics Plate Accessory (OPA). The OPA is outfitted with a custom quartz disc (76.2 mm diameter, 1.57 mm thick), which is transparent to UV light. It is important to ensure that disc transparency matches the wavelengths of interest.
- To perform photo-rheology, ensure uniform irradiation of samples during measurement. Samples are typically irradiated through a transparent lower plate, which sits above a light source.
- Install a light source below the lower optics plate (Figure 1E-G).
- Ensure the lower optics plate is clean and dry. Center the light source under the transparent plate and secure the light source with posts, holders, and/or other supports.
NOTE: To ensure uniform irradiation, incident light should be passed through a collimating lens prior to interacting with the sample. - After installing a new light source, set a photodiode power sensor connected to an optical power meter on top of the transparent plate—where a sample would be located in an experiment—with the sensor facing the light source (Figure 2A). Turn on the light and use the power meter to measure the light intensity at the sample location.
- If needed, adjust the light intensity using a light source driver (Figure 2B-C). Mark the location of the light source support structures to ensure reproducible placement for different experiments (Figure 2D). If the light source is prone to aging, repeat the light intensity measurement as needed.
NOTE: This procedure uses a 365 nm UVA LED with a collimating lens to irradiate samples. An LED driver is used to set the irradiation intensity at the sample location.
- If needed, adjust the light intensity using a light source driver (Figure 2B-C). Mark the location of the light source support structures to ensure reproducible placement for different experiments (Figure 2D). If the light source is prone to aging, repeat the light intensity measurement as needed.
- Ensure the lower optics plate is clean and dry. Center the light source under the transparent plate and secure the light source with posts, holders, and/or other supports.
2. Calibrating the rheometer
- Ensure that the optics plate and geometry are clean and dry. Perform the following calibrations29 on the geometry: Inertia calibration, Friction calibration, Zero gap, and Rotational mapping.
3. Loading a sample onto the rheometer
- Place the sample on the center of the optics plate, either by pipetting, using a spatula, or setting a cast gel in place (Figure 3A-B). This procedure focuses on pipetting a low-viscosity liquid sample (100 mg/mL PEG-anthracene in water).
NOTE: To estimate the minimum sample volume needed, consider the volume of a cylinder πr2h, where r is the radius of the parallel plate and h is the intended sample gap. To fill the geometry correctly, slightly more than this minimum volume is required to account for pipetting losses and prevent under-filling. If adding too much sample results in over-filling, the excess sample can be trimmed in step 3.330. In this procedure, an appropriate volume of liquid (75 µL for a 25 mm diameter plate and a gap height of 100 µm) was pipetted to fill the geometry correctly and prevent the need for trimming during step 3.3. - Lower the rheometer head until the geometry contacts the sample, then pause to avoid creating bubbles. Bubbles may impact the sample volume and light transmission.
- Check for bubble formation by viewing the sample through the optics plate (Figure 3C). If bubbles form, remove them by raising the geometry to break the connection between the sample and the upper plate. Then, gently rotate the geometry and lower the rheometer head to restore contact with the sample.
- Continue to lower the rheometer head incrementally until the experimental gap height is reached (Figure 3D). Lowering the head gradually reduces the risk of bubble formation. Continue to monitor the sample for bubble formation. This procedure uses a gap height of 100 µm to minimize inhomogeneous, thickness-dependent cross-linking of PEG-anthracene samples during UV irradiation31.
- To minimize thickness-dependent behavior, determine an appropriate gap height that allows uniform irradiation through the sample. If the concentration and absorption coefficient of the sample at the wavelength of interest is known, use the Beer-Lambert law to estimate the maximum path length before the absorbance is reduced beyond acceptable limits for the system. If these values are not known, measure the behavior of the sample during irradiation at multiple gap heights and identify the range of heights that result in similar behavior.
- For liquid samples, gently rotate the geometry to homogenize the sample.
- If needed, take precautions to minimize or prevent water evaporation.
- One method to prevent evaporation is to soak an absorbent material (e.g., lint-free wipes) with water and place it as close to the sample as possible without disrupting measurements (Figure 3E). This strategy creates a humidified environment that will reduce evaporation over shorter times.
- Another method is to separate the sample from the ambient environment by placing a layer of immiscible material around the sample. For aqueous samples, seal with mineral oil (Figure 3F), for example. This method is the best option if samples are measured for longer times.
- Protect the sample from ambient light and temperature fluctuations by closing the jacket of the upper Peltier plate (Figure 3G). Implement other light-blocking mechanisms (e.g., curtains) depending on the sensitivity of the material.
- If needed, install radiation protection mechanisms around the rheometer to block stray light rays that may be harmful due to intensity and/or wavelength. For example, a UV-blocking barrier can be made by placing sheets of acrylic around the rheometer.
4. Determining parameters to use in photo-rheology experiments
- Specify the appropriate temperature in the experiment procedure. This procedure uses ambient room temperature (22 °C) in all experimental steps.
- If the sample is a liquid, preshear the sample to eliminate loading hysteresis. Perform the preshear at the start of the procedure as a conditioning step that includes a sub-step for preshear. This procedure uses a preshear at 10 rad/s for 10 s, followed by equilibration for 60 s.
- Perform a preliminary frequency sweep on the sample. The goal of the frequency sweep is to establish the frequency-dependent viscoelasticity of the material. For this procedure, measure frequencies from 100 rad/s to 0.1 rad/s with 10% strain amplitude prior to and after network formation by UVA irradiation. For PEG-anthracene solutions, 10 rad/s enables fast data collection rates and distinguishes liquid-like and solid-like behavior during dynamic photo-rheology.
- Perform a preliminary strain amplitude sweep on the sample. The goal of the amplitude sweep is to determine a linear viscoelastic region of the material, which is the region where measured properties are independent of strain amplitude. For this procedure, measure strain amplitudes from 1% to 1000% with 10 rad/s frequency prior to and after network formation by UVA irradiation. A 10% strain is in the linear viscoelastic region and provides sufficient signal before and after irradiation.
5. Conducting a photo-rheology experiment
- Set the sample temperature. This procedure uses a sample temperature of 22 °C. Preshear for 10 s, then equilibrate for 60 s.
- Perform a frequency sweep before irradiation. For this procedure, perform a frequency sweep from 100 rad/s to 0.1 rad/s. Initial frequency sweep data confirm that the sample is in the expected state (liquid or solid).
- Perform an oscillation time sweep spanning the irradiation time, with buffer time before and after irradiation. Measurements prior to irradiation provide a baseline for the initial sample behavior. Measurements after irradiation quantify the final sample behavior.
- For this procedure, take measurements for 60 s before irradiation, 1 h during irradiation, and 10 s after irradiation. Perform oscillation time sweeps using the parameters determined in steps 4.3 and 4.4. For this procedure, perform oscillation time sweeps at 10 rad/s and 10% strain amplitude.
- Confirm that the Peltier temperature control is sufficient to counteract energy input due to irradiation during the oscillation time sweep. Monitor the sample temperature reported by the instrument to determine whether deviations from the set temperature are within reasonable experimental bounds for the system. For this procedure, the temperature was maintained between 21.99 °C and 22.04 °C during 1 hr of 365 nm irradiation.
- Perform a frequency sweep after irradiation. For this procedure, repeat the frequency sweep after the oscillation time sweep to compare the viscoelastic properties of the sample before and after irradiation.
6. Implementing multiple light sources in the photo-rheology experiment (Optional)
- If a procedure requires multiple light sources, wait until the first experiment has stopped, then remove the first light source from below the lower optics plate. Install the second light source below the lower optics plate. For the second light source, measure the intensity at the sample and tune prior to use, as described in step 1.5.2.
- Repeat step 5 with the new light source but omit the preshear step (step 5.1). The sample should only undergo one preshear step at the very beginning of the experiment. A preshear step performed later in the experiment could destroy structures that have formed within the sample during irradiation.
- Repeat steps 6.1 and 6.2 as needed to either alternate between light sources or add additional light sources.
7. End and cleanup of the experiment
- Monitor the normal force reported by the rheometer, as the sample may push or pull on the geometry during this procedure. Avoid normal forces that exceed ± 10 N.
- If the normal force is negative, swell the material to restore it within reasonable bounds prior to sample removal. To do this, carefully add solvent around the sample and wait for the solvent to be absorbed.
- Raise the geometry slowly—a few micrometers at a time—while gently twisting the spindle. Repeat until the twisting breaks the sample's connection between the upper and lower plates and the geometry can spin freely. Then, raise the geometry to a comfortable height to enable cleaning.
- Clean the plates gently using solvent(s), lens paper, and/or wipes compatible with the sample and the plates. Remove the sample and dispose in an appropriate waste stream.

Figure 1: Equipment needed to outfit a conventional rheometer for in situ photo-rheology. (A) (i) Hex wrench used to attach the upper Peltier plate, (ii) heat spreader wrench used to stabilize the geometry during installation, (iii) parallel plate geometry. (B) Transparent disc for optics plate accessory (OPA). (C) OPA, side view. (D) OPA, top view. (E) A 365 nm LED side view. (F) A 365 nm LED, top view. (G) Rheometer outfitted with upper Peltier plate, OPA, and LED. Please click here to view a larger version of this figure.

Figure 2: Using an optical power meter to determine light intensity through the optics plate. (A) Secure a photodiode power sensor to the center of the optics plate to measure light intensity that passes through the transparent window. (B) Top view of LED driver, showing LED cable (green), power cable (black), operation mode switch, and current selector knob. (C) Front view of LED driver, showing adjustable output current limit. (D) Mark the post of the optics plate accessory to ensure reproducible placement of LED support structures. Please click here to view a larger version of this figure.
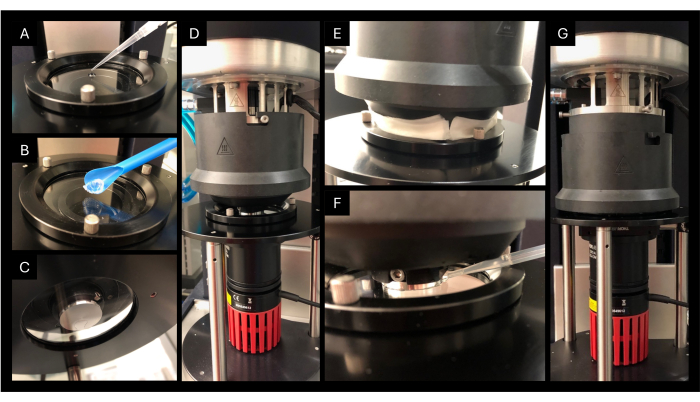
Figure 3: Loading a sample and preparing for a photo-rheology experiment. (A) Loading sample using a pipette. (B) Loading sample using a spatula. (C) View while lowering the geometry towards the optics plate in increments to avoid bubble formation. Observe the sample by looking through the optics plate. If the sample appears to form a bubble, stop lowering the head and take preventative measures. (D) The photo-rheometer with the geometry lowered to the experimental gap height. (E) Mitigate evaporation by creating a humidified environment using folded wipes soaked with water placed around the perimeter of the optics plate. (F) Mitigate evaporation by placing mineral oil around the sample perimeter, ensuring the mineral oil fully coats the exposed area of the sample. (G) The photo-rheometer with a closed Peltier jacket for thermal control and reduced light exposure. Additional user protection measures (such as a shield or curtain) may be necessary depending on the radiation wavelength and intensity. Please click here to view a larger version of this figure.
Results
Representative photo-rheology data show UV-driven cross-linking of PEG-anthracene (Figure 4). Specifically, a PEG-anthracene solution (40 kg/mol, 8 arms, 100 mg/mL in water) was subjected to oscillatory shear (10 rad/s, 10% strain) during UVA irradiation (365 nm LED, 2.7 mW/cm2). To obtain a baseline of mechanical properties prior to irradiation, the solution was probed for 60 s before the light was turned on, shown as the shaded area prior to 0 min. During this period, the viscous modulus exceeded the elastic modulus, and both remained relatively constant. The baseline confirmed that the sample was a stable liquid solution prior to irradiation. Then, the light was turned on, leading to an increase in the viscous and elastic moduli. Within 5 min, the elastic modulus surpassed the viscous modulus, indicating a transformation from a liquid polymer solution into a solid polymer network. Later, the elastic and viscous moduli reached steady plateau values. To investigate the response to turning off the light, measurements continued for 10 s after stopping irradiation. These data revealed stable PEG-anthracene networks in the absence of irradiation.
Representative frequency sweeps from 100 rad/s to 0.1 rad/s at 10% strain were performed before and after 60 min of irradiation (Figure 5). Prior to cross-linking, the sample showed a slight dependence on frequency, exhibiting behavior consistent with a viscoelastic liquid. After cross-linking, the sample showed minimal frequency-dependent behavior. This data led to the selection of 10 rad/s as an appropriate frequency for photo-rheology experimentation on this material since this frequency captured the expected material properties before and after irradiation.
Representative amplitude sweeps from 1% to 1000% at 10 rad/s were performed before and after 60 min of irradiation (Figure 6). Prior to cross-linking, the entire range of the amplitude sweep exhibited strain-independent behavior, indicating a robust linear viscoelastic region. After cross-linking, the sample exhibited a strain-independent linear viscoelastic region up to 100%, followed by a yielding event at high strain. When choosing the strain amplitude, it is important to ensure that measurements probe the linear viscoelastic region throughout the duration of the photo-rheology experiment. These data led to the selection of 10% as an appropriate strain amplitude for this experiment since this amplitude comfortably probes the linear viscoelastic region before and after irradiation.
In situ photo-rheology enables systematic studies of photo-responsive materials, such as quantifying the effect of polymer concentration on photo-cross-linking kinetics and mechanical properties (Figure 7). PEG-anthracene solutions (40 kg/mol, 8 arms, 20 mg/mL to 100 mg/mL in water) were cross-linked with 365 nm light for 60 min under oscillatory shear at 10 rad/s and 10% strain. As polymer concentration increased, cross-linking occurred more rapidly and led to stiffer networks. Cross-linking dynamics are quantified by the time required to reach the gel point, which occurs when the tangent of the loss angle tan(δ) is independent of frequency32. Here, gel time is estimated as the crossover time between the viscous and elastic moduli. Network stiffness is quantified as the steady plateau value of the elastic modulus after cross-linking. At longer times, viscous modulus measurements may appear noisy, particularly in samples with higher concentrations (100 mg/mL). These fluctuations are attributed to phase shift errors33 and considered negligible for materials that have reached a steady state. These representative results demonstrate how photo-rheology enables quantification of the effect of polymer concentration on the dynamic formation of PEG-anthracene networks.
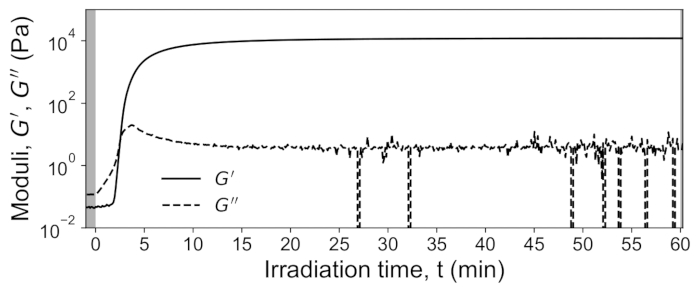
Figure 4: Photo-rheology of PEG-anthracene. The shaded region prior to 0 min indicates the sample baseline measurement prior to irradiation. The next 60 min show cross-linking in response to irradiation by a 365 nm LED. In the final 10 s, the light was turned off while measurements continued. Please click here to view a larger version of this figure.
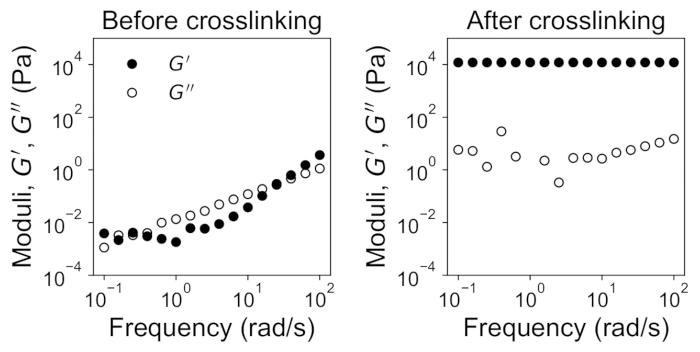
Figure 5: Oscillation frequency sweeps before and after 365 nm irradiation. Before irradiation (left), the sample exhibits frequency-dependent behavior, characteristic of a polymer solution. After 60 min of irradiation (right), the sample shows minimal frequency-dependent behavior, characteristic of an elastic polymer network. These data were measured at 10% strain. Please click here to view a larger version of this figure.
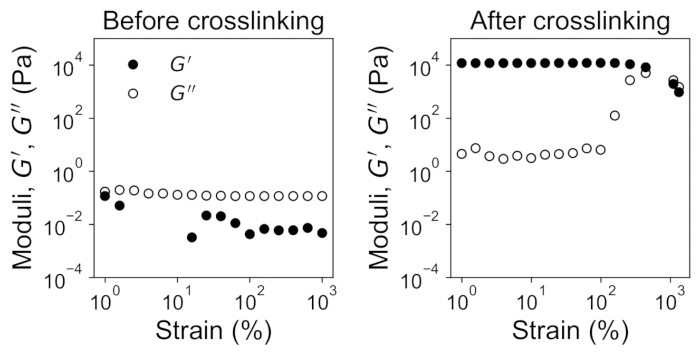
Figure 6: Strain amplitude sweeps before and after 365 nm irradiation. Before irradiation (left), the sample demonstrates strain-independent behavior. After 60 min of irradiation (right), the sample exhibits a linear viscoelastic region up to 100% strain and yielding behavior at higher strains. Strain amplitudes within the strain-independent, linear viscoelastic ranges of both plots are appropriate to use during photo-rheology experiments. These data were measured at 10 rad/s. Please click here to view a larger version of this figure.
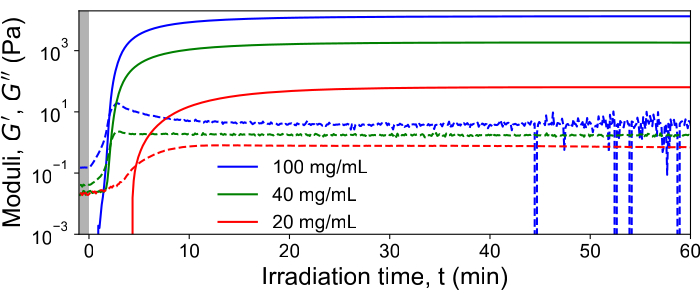
Figure 7: PEG-anthracene cross-links faster into stiffer networks at higher concentrations. PEG-anthracene at 20, 40, and 100 mg/mL in water was cross-linked with 365 nm irradiation for 60 min. The most concentrated sample formed a percolated network more rapidly than the other samples, with the least concentrated sample taking the longest to reach the gel point. Higher polymer concentrations also led to increased network stiffness after cross-linking. Please click here to view a larger version of this figure.
Discussion
Photo-rheology is a powerful tool that measures dynamic mechanical properties of systems undergoing irradiation. This article presents a protocol for performing in situ photo-rheology and describes its application to a PEG-anthracene star polymer system. Details are provided for calibration, sample loading, measurement parameter selection, and experimentation. Representative results reveal the mechanical evolution of PEG-anthracene network formation during UV irradiation. Future studies using photo-rheology will enable the design of photo-responsive materials for versatile applications.
Several key aspects of this procedure require special attention, including optical components, sample loading, sample thickness, oscillation frequency, and strain amplitude. First, light sources and optics plate materials must ensure delivery of the correct wavelength(s) to the sample. Second, sample loading must be performed carefully to prevent bubble formation. Third, sample thickness must be chosen to enable uniform light penetration. Fourth, the rheometer frequency and strain amplitude must be determined before and after irradiation to ensure valid mechanical measurements throughout the experiment.
This setup and protocol were leveraged to quantify the photo-responsive mechanical properties of PEG-anthracene systems. During photo-cross-linking, in situ photo-rheology revealed non-monotonic trends in gel time across a broader range of polymer concentrations21. The fastest gel time was identified near the polymer overlap concentration, and gelation was slower when polymers were either more crowded or more isolated. In a composite of PEG-anthracene and silica nanocapsules, faster gelation and stiffer networks were measured compared to systems without nanocapsules21. Recently, in situ photo-rheology with two light sources enabled investigations of PEG-anthracene recyclability. Reversible network formation and degradation are driven by 365 nm and 265 nm irradiation, respectively. Photo-rheology measurements indicated optimal polymer architectures and formulations for recyclability27.
Though photo-rheology provides significant insight into many photo-responsive systems, some limitations prevent the technique from being universally practical. First, intrinsic mechanical limitations of the rheometer pose challenges to studying materials with very dominant solid or liquid characteristics. For such materials, other approaches, including dynamic mechanical analysis or viscometry, may be more appropriate34,35. Second, the typical data collection rates of in situ photo-rheology may not achieve sufficient temporal resolution to capture dynamic material properties, especially for systems undergoing rapid photo-induced phenomena36,37. Conversely, if a material does not exhibit significant changes in mechanical properties during irradiation, data collected from photo-rheology may not be very impactful. Finally, these measurements may be limited by the optical properties of materials of interest. Materials with strong absorption at the wavelength(s) of interest may require narrow gap heights to achieve uniform irradiation through the sample, which could enhance wall-slip effects and produce inaccurate measurements38,39. Despite these challenges, photo-rheology remains an effective technique to provide insight into the emergent mechanical properties of many photo-responsive systems during irradiation.
Looking forward, we anticipate photo-responsive materials will become more common, mirroring the growth of additive manufacturing and photo-curable materials. To support future materials development, it is important to implement in situ methods for materials characterization and quality control. Photo-rheology represents one such approach to obtain precise, dynamic measurements that play a critical role in engineering the photo-responsive materials of the future.
Disclosures
The authors declare no conflicts of interest.
Acknowledgements
This material is based upon work supported by the National Science Foundation under Award No. 2400010, the donors of the ACS Petroleum Research Fund under Doctoral New Investigator Grant 66560-DNI7, and the Precourt Institute at Stanford University. M.C.B. acknowledges postdoctoral fellowship support from the Arnold and Mabel Beckman Foundation. We thank the Congreve lab for the use of the optical power meter and helpful discussions. We thank Brendan Wirtz for the PEG-anthracene samples and all members of the Mai lab for useful discussions and feedback.
Materials
| Name | Company | Catalog Number | Comments |
|---|---|---|---|
| 25 mm diameter aluminum parallel plate geometry | TA Instruments | 523250.937 | Disposable |
| 3 mm hex wrench | TA Instruments | 578910.001 | Used to install Upper Peltier Plate |
| 365 nm LED | ThorLabs | M365LP1-C2 | With collimating lens |
| Acrylic sheets | McMaster-Carr | 8589K923 | Protect user from UV irradiation |
| Anthracene-terminated star poly(ethylene glycol) (40 kg/mol, 8 arms) | Made in-house | BMWR12 and BMWR14 | Synthesis described in Burroughs et al. 2022 |
| Heat spreader wrench | TA Instruments | 534522.001 | Used to install geometry |
| LED Driver | ThorLabs | LEDD1B | Control the current on the LED |
| Mineral oil | Fisher chemical | O121-1 | Evaporation control |
| Optical Post Assemblies | ThorLabs | Various | SPT2/M (for holding 365 nm), TR6 (6" long 1/2" diameter post), and RA90 (right angle clamp) |
| Optical Power and Energy Meter | ThorLabs | PM100D | Measure light intensity |
| Optics Plate Accessory | TA Instruments | 546800.901 | Enables simultaneous irradiation and measurement |
| Photodiode Power Sensor, UV-Extended | ThorLabs | S120VC | Measures 200-1100 nm |
| Quartz disc (76.2 mm diameter, 1.57 mm thick) | Technical Glass Products, Inc. | 3X0.062 | Used in Optics Plate Accessory; allows UV light to pass through |
| Rheometer | TA Instruments | DHR 30 | Performs rheological measurements |
| Upper Peltier Disposable Geometry Adapter | TA Instruments | 534525.941 | Holds disposable parallel plate geometry |
| Upper Peltier Draft Cover | TA Instruments | 534506.001 | Jacket for thermal control and light protection |
| Upper Peltier Plate | TA Instruments | 534509.902 | Temperature control. Comes with hex wrench and heat spreader wrench for installation |
References
- Schmidt, L. E., Leterrier, Y., Vesin, J. M., Wilhelm, M., Månson, J. A. E. Photorheology of Fast UV-Curing Multifunctional Acrylates. Macromol Mater Eng. 290 (11), 1115-1124 (2005).
- Sun, G., Wu, X., Liu, R. A Comprehensive Investigation of Acrylates Photopolymerization Shrinkage Stress from Micro and Macro Perspectives by Real Time MIR-Photo-Rheology. Prog Org Coat. 155, 106229(2021).
- Corder, R. D., Dudick, S. C., Bara, J. E., Khan, S. A. Photorheology and Gelation during Polymerization of Coordinated Ionic Liquids. ACS Appl Polym Mater. 2 (6), 2397-2405 (2020).
- Miller, T. F. I., Wang, Z. G., Coates, G. W., Balsara, N. P. Designing Polymer Electrolytes for Safe and High Capacity Rechargeable Lithium Batteries. Acc Chem Res. 50 (3), 590-593 (2017).
- Paren, B. A., et al. Superionic Li-Ion Transport in a Single-Ion Conducting Polymer Blend Electrolyte. Macromolecules. 55 (11), 4692-4702 (2022).
- Wicaksono, G., Djordjevic, I., Shah, A. H., Steele, T. W. J. Photorheology of Bioadhesive Dendrimer Polycaprolactone Composites. Polym Test. 80, 106099(2019).
- Khan, S. A., Plitz, I. M., Frantz, R. A. In Situ Technique for Monitoring the Gelation of UV Curable Polymers. Rheol Acta. 31 (2), 151-160 (1992).
- Gorsche, C., et al. Real Time-NIR/MIR-Photorheology: A Versatile Tool for the in Situ Characterization of Photopolymerization Reactions. Anal Chem. 89 (9), 4958-4968 (2017).
- Piguet-Ruinet, F., Love, B. J. Dynamic Photorheological Analysis of Photopolymerizable Urethane Dimethacrylate Resins with Varying Diluent Content and Light Fluence. J Appl Polym Sci. 107 (3), 1523-1529 (2008).
- Švajdlenková, H., Šauša, O., Peer, G., Gorsche, C. In Situ Investigation of the Kinetics and Microstructure during Photopolymerization by Positron Annihilation Technique and NIR-Photorheology. RSC Adv. 8 (65), 37085-37091 (2018).
- Thijssen, Q., Ortega, A. J., Vieira, R. P., Van Vlierberghe, S. Radical Inhibition in Tomographic Volumetric 3D Printing for Thiol-Ene Photoresists: From Photorheology to Printability. React. Funct Polym. 205, 106096(2024).
- Fiedler-Higgins, C. I., Cox, L. M., DelRio, F. W., Killgore, J. P. Monitoring Fast, Voxel-Scale Cure Kinetics via Sample-Coupled-Resonance Photorheology. Small Methods. 3 (2), 1800275(2019).
- Coblentz, W. W. Absorption, Reflection, and Dispersion Constants of Quartz. , U.S. Department of Commerce, Bureau of Standards. (1915).
- Ikushima, A. J., Fujiwara, T., Saito, K. Silica Glass: A Material for Photonics. J Appl Phys. 88 (3), 1201-1213 (2000).
- Banerjee, A., Ogale, A. A., Das, C., Mitra, K., Subramanian, C. Temperature Distribution in Different Materials Due to Short Pulse Laser Irradiation. Heat Transf Eng. 26 (8), 41-49 (2005).
- Mouzaoui, M., Baudez, J. C., Sauceau, M., Arlabosse, P. How to Avoid Evaporation during Rheological Measurements of Dewatered Pasty Sludge at High Temperature. Water Sci Technol. 79 (8), 1503-1510 (2019).
- Chen, T. Rheological Analysis under Pressure. , https://www.tainstruments.com/pdf/literature/RH092.pdf (2025).
- Leading in Thermal Analysis, Rheology and Fire Testing. Overcoming Solvent Evaporation/Drying During Rheological Testing on a Rotational Rheometer. , NETZSCH - Analyzing and Testing. https://analyzing-testing.netzsch.com/en-US/application-literature/overcoming-solvent-evaporation-drying-during-rheological-testing-on-a-rotational-rheometer (2025).
- Saruwatari, A., Tamate, R., Kokubo, H., Watanabe, M. Photohealable Ion Gels Based on the Reversible Dimerisation of Anthracene. Chem Commun. 54 (95), 13371-13374 (2018).
- Günay, K., et al. PEG-Anthracene HydrogelsasanOn-De Mand Stiffening Matrix To Study Mechanobiology. Angew Chem Int Ed Engl. 58 (29), 9912-9916 (2019).
- Burroughs, M. C., Schloemer, T. H., Congreve, D. N., Mai, D. J. Gelation Dynamics during Photo-Cross-Linking of Polymer Nanocomposite Hydrogels. ACS Polym Au. 3 (2), 217-227 (2023).
- Zheng, Y., et al. PEG-Based Hydrogel Synthesis via the Photodimerization of Anthracene Groups. Macromolecules. 35 (13), 5228-5234 (2002).
- Wells, L., Brook, M., Sheardown, H. Generic, Anthracene-Based Hydrogel Crosslinkers for Photo-Controllable Drug Delivery. Macromol Biosci. 11 (7), 988-998 (2011).
- Truong, V. X., Li, F., Forsythe, J. S. Versatile Bioorthogonal Hydrogel Platform by Catalyst-Free Visible Light Initiated Photodimerization of Anthracene. ACS Macro Lett. 6 (7), 657-662 (2017).
- Kislyak, A., et al. A Holistic Approach for Anthracene Photochemistry Kinetics. Chem Eng J. 402, 126259(2020).
- Wei, K. S., Livingston, R. Reversible Photodimerization of Anthracene and Tetracene. Photochem Photobiol. 6 (3), 229-232 (1967).
- Burroughs, M. C., et al. Light-Responsive Star Polymer Networks for Photochemical Recycling and Circular Manufacturing. Matter. , (2025).
- Rubinstein, M., Colby, R. Polymer Physics. , Oxford University Press. (2003).
- Intro-Guide-to-DHR. , https://people.clarkson.edu/~skrishna/Intro-Guide-to-DHR.pdf (2025).
- Proper Sample Loading with the Brand New Discovery Hybrid Rheometer. , https://www.youtube.com/watch?v=yHsGSGo5qos (2020).
- Tibbitt, M. W., Kloxin, A. M., Anseth, K. S. Modeling Controlled Photodegradation in Optically Thick Hydrogels. J Polym Sci Part Polym Chem. 51 (9), 1899-1911 (2013).
- Chambon, F., Winter, H. H. Linear Viscoelasticity at the Gel Point of a Crosslinking PDMS with Imbalanced Stoichiometry. J Rheol. 31 (8), 683-697 (1987).
- Velankar, S. S., Giles, D. How Do I Know If My Phase Angles Are Correct. Rheol Bull. 76 (2), 8-20 (2007).
- Basics of viscometry | Anton Paar Wiki. , Anton Paar. https://wiki.anton-paar.com/en/basic-of-viscometry/ (2025).
- Introduction to Dynamic Mechanical Analysis and its Application to Testing of Polymer Solids - TA Instruments. , https://www.tainstruments.com/applications-notes/introduction-to-dynamic-mechanical-analysis-and-its-application-to-testing-of-polymer-solids/ (2025).
- Franck, A., Grehlinger, M. Benefit of Fast Data Sampling during Rheological Testing. Proc XIVth Int Congr on Rheology. , RE29-1-RE29-4 (2004).
- Grehlinger, M. A Technique for Rapid Acquisition of Rheological Data, and Its Application to Fast Curing Systems. , https://www.tainstruments.com/pdf/literature/RH084_FDA_and_UV_curing.pdf (2025).
- Walls, H. J., Caines, S. B., Sanchez, A. M., Khan, S. A. Yield Stress and Wall Slip Phenomena in Colloidal Silica Gels. J Rheol. 47 (4), 847-868 (2003).
- Barnes, H. A. A Review of the Slip (Wall Depletion) of Polymer Solutions, Emulsions and Particle Suspensions in Viscometers: Its Cause, Character, and Cure. J Non-Newton Fluid Mech. 56 (3), 221-251 (1995).
Reprints and Permissions
