This protocol measures cyclic guanosine monophosphate (cGMP) concentrations in solid tissues using competitive enzyme-linked immunosorbent assay (ELISA). The protocol describes how to process solid tissue, perform competitive ELISA, convert absorbances to cGMP concentrations in picomoles per milliliter, and calculate the final concentrations as nanomoles of cGMP per gram of tissue.
Method Article
Measurement of Cyclic Guanosine Monophosphate (cGMP) in Solid Tissues using Competitive Enzyme-Linked Immunosorbent Assay (ELISA)
In This Article
Summary
Abstract
A major pathway that produces cyclic guanosine monophosphate (cGMP) is the nitric oxide (NO)-cGMP pathway. In this pathway, NO stimulates the catalytic activity of soluble guanylyl cyclase (sGC), which converts guanosine triphosphate to cGMP. NO is of interest because, in mammals, it acts as the main vasodilator, an inhibitor of platelet aggregation, a mediator of immune function, a neurotransmitter, and to improve endurance during physical activity, among other physiological roles. Measuring NO's abundance in different tissues could help elucidate its functions. However, NO cannot be measured directly due to its less than seconds-long half-life. Typically, NO's metabolites, nitrate and nitrite, are measured to estimate NO's abundance. This is because these molecules can be interconverted in vivo through redox reactions. A less common method of estimating NO's abundance requires measuring the concentration of cGMP, a signaling molecule downstream of NO. Yet, measuring cGMP in tissues is seldom done, despite creating the possibility to better understand NO's functions in organs. Therefore, a need exists for a protocol to measure cGMP concentrations in solid organs and tissues. In this protocol, collected pig tissues were homogenized, competitive ELISA was performed on processed samples, and absorbances were converted into nanomoles of cGMP per gram of original tissue. In short, this protocol delineates a simplistic method to measure cGMP concentrations in solid tissues using the cyclic GMP ELISA kit.
Introduction
Cyclic guanosine monophosphate (cGMP) is a signaling molecule capable of inducing physiological changes through the nitric oxide (NO)-cGMP pathway. In the NO-cGMP pathway, NO binds to soluble guanylyl cyclase, a cytosolic enzyme that converts guanosine triphosphate to cGMP, increasing its catalytic activity1,2. The subsequent increase in cGMP concentrations activates signaling pathways that promote vasodilation3, leading to a decrease in blood pressure4,5, the main physiological response characteristic of NO's presence in vivo. In addition, NO is known to influence immune function6, improve endurance during physical activity4, and prevent blood coagulation by inhibiting platelet aggregation7.
Measuring NO directly is made difficult by its less than seconds-long half-life in vivo8 in most biological tissues. Consequently, elucidating the physiological effects of NO requires a method to measure its abundance ex vivo. Therefore, usable quantitative methods avoid the direct measurement of NO. A common method to estimate NO concentrations in tissues is to measure NO's more stable metabolites: nitrite and nitrate4,5,9,10,11. The main complication of using nitrite and nitrate concentrations as measures of NO's abundance is that both metabolites also serve as a NO precursor and storage molecule, respectively. NO's metabolites, especially nitrate, are abundant in certain foods. Therefore, changes in cGMP concentrations, cGMP being downstream of NO, are useful for estimating the amounts of active NO, and NO's abundance can be determined without the interference of previously present nitrite and nitrate.
Previous research has relied on measuring cGMP concentrations in plasma12 and platelets13, but less commonly seen is the measurement of cGMP concentrations in solid tissues. The ability to measure cGMP concentrations in solid tissues would allow for the characterization of NO's activity in specific organs. The aim was to identify a simplistic method for measuring cGMP in solid tissues using competitive ELISA. One advantage of using competitive ELISA is that it requires equipment commonly found in most laboratories interested in NO, such as a microplate reader often used for other purposes. In comparison, some other measurement methods require equipment infrequently used during experiments focused on NO, such as microscopes14,15, a scintillation counter16, or a laser17. In addition to its accessibility, measuring cGMP with competitive ELISA is sensitive; cGMP concentrations can be detected down to 0.1 picomole (pmol) of cGMP/mL18. With minor modifications to the cGMP ELISA kit (Table of Materials) protocol18, a method for measuring cGMP in solid tissues using competitive ELISA was established.
Protocol
All animal procedures were performed in accordance with the Molecular Medicine Branch Animal Study protocol approved by the NIDDK Animal Care and Use Committee (ASP K049-MMB-23). Tissue collection followed the guidelines set by the Institutional Animal Care and Use Committee of MedStar Health Research Institute (protocol number: 2006001373 2020-017). Young adult Yorkshire cross pigs (two males and two females), 3 months old and weighing between 30-35 kg, were used in the study. Figure 1 illustrates a schematic showing the steps of the cGMP ELISA kit protocol. The reagents and equipment used in the study are listed in the Table of Materials.
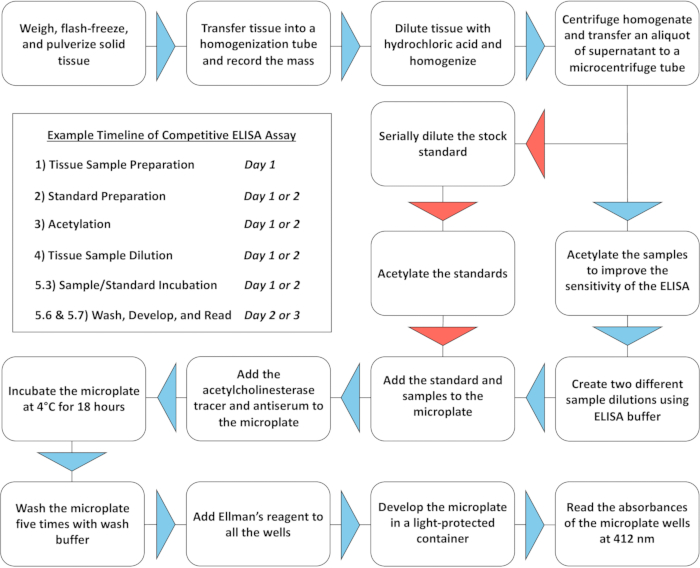
Figure 1: Protocol schematic. A schematic illustrating the steps of the cGMP ELISA kit protocol. Please click here to view a larger version of this figure.
1. Tissue sample preparation
NOTE: Tissues were perfused with a heparin sodium solution before collection and then stored at -80 °C prior to use. Refer to Park et al.19 for details on the collection of the tissue samples.
- Tissue sample processing
- Chill a tissue pulverizer, tweezers, and spoon on dry ice for 10 min before beginning the procedure.
- Weigh out an excess of tissue, as some may be lost during pulverization (yield around 90%).
NOTE: Previously, an excess of 170 mg yielded successful results. The mass can be increased or decreased, if desired. Ensure that the tissue mass results in a sufficient sample volume for the tissue sample acetylation and tissue sample dilution steps. - Add the tissue to the pulverizer on dry ice.
- Flash-freeze the tissue with liquid nitrogen and allow the liquid nitrogen to vaporize completely.
- Replace the pulverizer lid and hit it with a mallet 15 times.
NOTE: If the pulverizer set up is not available or can't be used, the sample has to be cut into pieces as small as possible using scissors or a scalpel while kept frozen or at least refrigerated on ice. This step assures good homogenization and is crucial, especially for harder tissues. - Tare a bead homogenizer tube and transfer the pulverized tissue to the tube using the chilled spoon and tweezers.
- Record the mass of the tissue added to the bead homogenizer tube to convert concentrations from molarity to moles per mass later. Keep the sample on ice.
- To the homogenization tube, add a volume in microliters of 0.1 N hydrochloric acid equal to a multiple of the tissue mass in milligrams.
NOTE: Appropriate dilutions cause samples measured to fall on the standard curve. These dilutions are found for different tissue types through trial and error. In previous experiments, a 1:10 dilution ratio for skeletal muscle tissue and a 1:5 dilution ratio for liver tissue yielded successful results. For reference, if diluting 100 mg of tissue, a 1:10 dilution ratio would require 1,000 µL of 0.1 N hydrochloric acid, and a 1:5 dilution ratio would require 500 µL. - Homogenize the tissue samples using a bead mill homogenizer or a comparable technique.
NOTE: Occasionally chill the sample during homogenization using ice. If a bead mill homogenizer is not available, other methods of homogenization that effectively disrupt cells and create tissue homogenate can be substituted, including the use of a rotary homogenizer or an ultrasonic homogenizer. - Centrifuge homogenates for 30 min at a speed of 17,000 x g while maintaining a sample temperature of 4 °C.
NOTE: Insufficiently diluted skeletal muscle tissue homogenates become overly viscous and gel-like. This can be seen best after centrifugation. - Transfer the supernatant to a microcentrifuge tube and centrifuge the supernatant for 10 min at 17,000 x g while maintaining a temperature of 4 °C.
- Transfer an aliquot of supernatant to a microcentrifuge tube and keep the sample on ice.
NOTE: Acetylation of 250 μL of supernatant yielded successful results. To pause the protocol, freeze these samples at -80 °C and store for up to 48 h. It is recommended that the volume of supernatant for the acetylation process be measured on the day of acetylation.
2. Standard preparation
NOTE: Prepare standards on the day of ELISA microplate preparation.
- ELISA buffer preparation
- Add thawed 10x ELISA buffer concentrate to a glass bottle containing 90 mL of ultrapure water.
NOTE: Take care to rinse residual 10x ELISA buffer concentrate with the prepared ELISA buffer and return the buffer to the glass bottle. Store at 4 °C for up to 2 months.
- Add thawed 10x ELISA buffer concentrate to a glass bottle containing 90 mL of ultrapure water.
- Standard stock preparation
- Add 1 mL of ELISA buffer to the standard vial and shake to dissolve.
NOTE: Store at 4 °C for up to 6 weeks.
- Add 1 mL of ELISA buffer to the standard vial and shake to dissolve.
- Standard serial dilution
- Label a tube standard B and nine tubes standard 0 through standard 8.
- Add 9.9 mL of ELISA buffer to the tube labeled standard B.
- Transfer 100 µL of the standard stock (300 pmol/mL of cGMP) into the standard B tube and thoroughly vortex.
- Transfer 1,000 µL of the solution in the standard B tube to the standard 1 tube.
- Add 500 μL of ELISA buffer to the tube labeled standard 0 and the tubes labeled standard 2 to standard 8.
- Vortex standard 1 and then transfer 500 µL of solution from standard 1 into standard 2.
- Vortex standard 2 and then transfer 500 µL of solution from standard 2 into standard 3.
- Continue to transfer 500 μL from standard n-1 into standard n, making sure to vortex the standards thoroughly after each addition.
- Discard 500 µL of solution from standard 8.
NOTE: Be sure to vortex standards where specified for an optimal standard curve. Standards 0 to 8 are at a volume of 500 μL. Store the standards at 4 °C until use. Use standards on the day of their dilution.
3. Acetylation
NOTE: During the acetylation reaction, an acetyl group is added to the 2' hydroxyl group of the cGMP molecule, which modifies cGMP's structure and leads to an increase in the binding affinity of the antibodies, enhancing assay sensitivity ~10-fold. In samples containing over 1.0 pmol/mL of cGMP, measurements can be taken without acetylation, and this step can be omitted. The need for acetylation is to be determined experimentally, on a case-by-case basis.
- Potassium hydroxide preparation
- Add 10 mL of ultrapure water to the potassium hydroxide bottle to create a 4 M solution.
NOTE: Do not cap the bottle as the potassium hydroxide dissolves. Store for months at room temperature.
- Add 10 mL of ultrapure water to the potassium hydroxide bottle to create a 4 M solution.
- Tissue sample acetylation
- To a 250 μL aliquot of the sample, add 50 μL (5:1) of 4 M potassium hydroxide and rapidly follow the addition with 12.5 μL (20:1) of acetic anhydride.
- Vortex for 15 s.
- Add 12.5 μL of 4 M potassium hydroxide to the sample and vortex briefly.
- Optional: If skeletal muscle samples solidify following the acetylation steps, centrifuge the samples at 17,000 x g for 10 min.
- Acetylation of standards
- To the tube labeled standard 0, add 100 μL of 4 M potassium hydroxide, immediately followed by 25 μL of acetic anhydride.
- Vortex the standard for 15 s.
- Add 25 μL of 4 M potassium hydroxide to the standard and vortex briefly.
- Repeat these steps for the remaining numbered standards.
NOTE: Vortex all samples and standards for the same duration to ensure consistent results.
4. Tissue sample dilution
- Add pre-determined ratios of ELISA buffer and an aliquot of acetylated sample to a microcentrifuge tube.
NOTE: Two different dilutions are required for each sample. Dilution ratios that cause the cGMP concentrations measured to fall on the standard curve are found through trial and error. Dilutions must be determined experimentally for each type of tissue in order for the percent to fall between 20% and 80%. In previous experiments measuring liver tissues, dilution ratios of 1:2 and 1:3 yielded successful results with the appropriate percent values. These ratios have also yielded successful results for skeletal muscle. However, variations in the skeletal muscle tissue may require more dilute samples.
 - Optional: If a precipitate forms when the tissue sample is added to ELISA buffer, centrifuge the sample for 10 min at 17,000 x g.
5. ELISA microplate preparation
- Acetylcholinesterase (AChE) tracer preparation
- Add 6 mL of ELISA buffer to the AChE tracer vial and gently shake to dissolve.
NOTE: Store the sample at 4 °C for up to 2 weeks. Do not vortex.
- Add 6 mL of ELISA buffer to the AChE tracer vial and gently shake to dissolve.
- Antiserum preparation
- Add 6 mL of ELISA buffer to the Antiserum vial and gently shake to dissolve.
NOTE: Store at 4 °C for at least 4 weeks. Do not vortex.
- Add 6 mL of ELISA buffer to the Antiserum vial and gently shake to dissolve.
- Sample and standard incubation
- Vortex standard 0.
- To the ELISA microplate, add 50 µL aliquots of standard 0 to 5 wells (NSB and B0; Figure 2).
- To two of the wells (NSB; Figure 2) containing standard 0, add 50 μL of ELISA buffer.
- Use one pipette tip to add 50 µL aliquots of standards 1 to 8 to the ELISA microplate in duplicate. Start with the most dilute standard (standard 8) and then proceed to the next most dilute until all the standards are added.
NOTE: Aspirate and dispense each standard several times before adding it into a well. Vortex standards before adding them to wells. - Vortex each sample before adding 50 µL aliquots into the wells in duplicate or triplicate.
- Add 50 μL of AChE tracer to each NSB, B0, standard, and sample well (Figure 2).
- Add 50 μL of antiserum to each B0, standard, and sample well (Figure 2).
- Cover the ELISA microplate and incubate at 4 °C for 18 h.
NOTE: Be sure to vortex whenever instructed to produce consistent results.
- Wash buffer preparation
- To a glass bottle, add 200 mL of ultrapure water and 500 µL of 400x wash buffer concentrate.
- Using a syringe, add 100 µL of polysorbate 20 to the glass bottle.
- Gently shake the bottle to mix.
NOTE: Store the wash buffer at 4 °C for up to 2 months. Double the volumes of ultrapure water, 400x wash buffer concentrate, and polysorbate 20 for a full 96-well microplate of samples. - Transfer the wash buffer to a wash bottle before use.
- Ellman's reagent preparation
NOTE: Prepare the day of ELISA microplate development.- To a light-protected container, add 20 mL of ultrapure water.
- Use an aliquot of the ultrapure water to dissolve the Ellman's reagent.
- Transfer the Ellman's reagent to the light-protected container.
- Use the Ellman's reagent to rinse the bottle in which it came.
- Transfer all the solution back into the light-protected container using a pipette.
- ELISA microplate wash
- Dispose of the contents of the ELISA microplate by inverting it. Ensure that the wells are emptied by tapping the inverted ELISA microplate on a paper towel.
- Fill the wells with wash buffer using the wash bottle.
- Gently agitate the ELISA microplate for 5 s and then dump the wash buffer and tap out the remaining fluid on a paper towel.
- Fill the ELISA microplate with wash buffer, gently agitate the ELISA microplate for 30 s, and dump its contents. Repeat this four times, tapping the ELISA microplate on a paper towel after each dump to remove the remaining fluid.
NOTE: Prevent inaccurate absorbance readings by thoroughly washing the ELISA microplate.
- ELISA microplate development and reading
- Transfer Ellman's reagent to a reservoir.
- Working quickly, use a multichannel pipette to aliquot 200 µL of Ellman's reagent to the blank, NSB, B0, TA, standard, and sample wells.
- Add 5 μL of AChE tracer to the TA well.
- Cover the ELISA microplate with parafilm, place it in a light-protected container, and incubate at room temperature for 60-90 min with agitation.
NOTE: Use the B0 wells as indicators for the appropriate incubation time. Ideal B0 wells appear visibly yellow but not dark. - Remove the paraffin film and read the ELISA microplate at an optical density of 412 nm.
NOTE: B0 wells with an absorbance between 0.3 AU and 1.0 AU, with the blanks subtracted, indicate that the ELISA microplate is adequately developed. - Optional: If the ELISA microplate is underdeveloped, replace the paraffin film and allow it to incubate in a light-protected container for an additional period. If the ELISA microplate is overdeveloped, dump the Ellman's reagent, rinse once with wash buffer, and re-develop the ELISA microplate with Ellman's reagent.
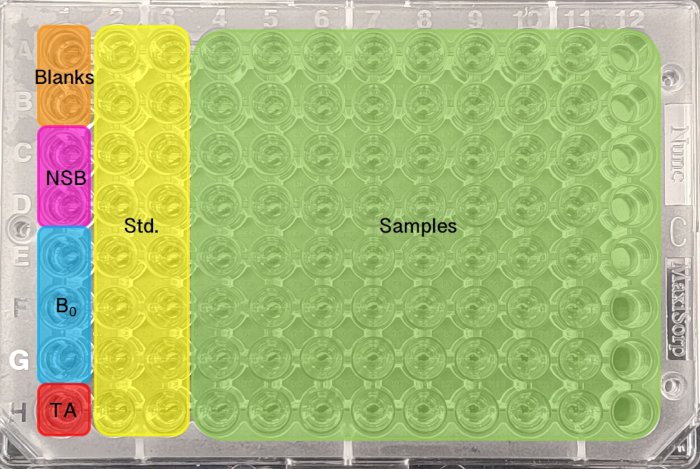
Figure 2: Microplate layout. An example of a microplate layout for the competitive ELISA. NSB indicates a non-specific binding well. B0 indicates a maximum binding well. TA indicates a total activity well. Std. indicates a standard well with its corresponding number. Please click here to view a larger version of this figure.
6. Conversion to concentration
- Bound AChE tracer calculations
- Average the absorbances of the two blanks and subtract the average from the absorbances of every well.
NOTE: Use the blank-subtracted absorbances for the remainder of the calculations. - Calculate the average absorbances of the NSB, B0, and blank wells.
- Use the following equation to calculate the corrected B0 absorbance:

NOTE: Corr. stands for corrected, Abs. stands for absorbance, and Avg. stands for average. If the average absorbance of the blank wells (with the blank average subtracted) is a negative number, use zero for the calculation. - Calculate the ratio for each standard and sample using the following equation:

- Multiply the ratio of each sample by 100 to calculate the percent .
NOTE: Samples between 20% and 80% fall on the standard curve.
- Average the absorbances of the two blanks and subtract the average from the absorbances of every well.
- Standard curve calculations
- Average the ratio of each standard's duplicate wells (1 to 8).
- Calculate the logit of each standard's averaged ratio using the following equation:
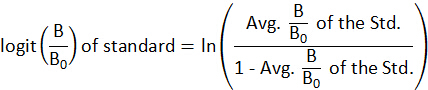
- Using the known concentrations of each standard (Table 1) as the X-values and the logit
 of each standard as the Y-values, calculate the slope and Y-intercept.
 - Calculate the coefficient of determination by using the log10 of the known cGMP standard concentrations as the X-values and the logit of each standard as the Y-values.
NOTE: Verify that the coefficient of determination is close to 1.
- Average the
- cGMP concentration calculations in pmol/mL
- Calculate the logit of each sample using the following equation:
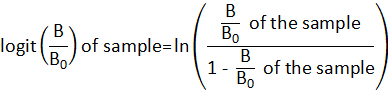
- To calculate the concentration of cGMP in each sample (in picomoles of cGMP per milliliter of sample), use the following equation:

NOTE: D.R. stands for dilution ratio. The homogenate D.R. sum for liver samples diluted with a 1:5 dilution ratio of hydrochloric acid equals 6. The buffer D.R. sum for liver samples diluted with a 1:2 dilution ratio of ELISA buffer equals 3. Therefore, the terms grouped by brackets are multiplied by 18.
- Calculate the logit
- cGMP concentration calculations in nmol/g
- Calculate the nanomoles of cGMP per well with the following equation:

- Calculate the grams of tissue in each acetylated sample with the following equation:

NOTE: "mg of tissue" is the mass of tissue added to the homogenization tube in milligrams. "volume of HCl used" is the volume of 0.1 N hydrochloric acid used to dilute the samples for homogenization. - Calculate the grams of tissue in each sample diluted with ELISA buffer using the following equation:

NOTE: "volume of sample diluted" is the volume of sample diluted by ELISA buffer. "250 μL" is the volume of the sample acetylated. The "reagents" mentioned are the acetylation reagents 4 M KOH and acetic anhydride. - Calculate the grams of tissue per well with the following equation:

NOTE: "volume of buffer" is the volume of ELISA buffer used to dilute the tissue samples before adding the samples to the wells. - Divide the nanomoles of cGMP per well by the grams of tissue per well to calculate the concentration of cGMP in nmol/g.
- Calculate the nanomoles of cGMP per well with the following equation:
| Standard Number | Concentrations of cGMP (pmol/mL) |
| Standard 1 | 3.0 |
| Standard 2 | 1.5 |
| Standard 3 | 0.75 |
| Standard 4 | 0.375 |
| Standard 5 | 0.1875 |
| Standard 6 | 0.09375 |
| Standard 7 | 0.046875 |
| Standard 8 | 0.0234375 |
Table 1: Standard concentrations. The known concentrations of standards 1 to 8.
Results
Yorkshire domestic pigs treated with dietary sodium chloride (0.15 mmol/kg) or 15N-labeled nitrate (0.15 mmol/kg) administered once per day for five consecutive days as a bolus in chow were perfused with a heparin sodium (0.9% sodium chloride) solution preceding tissue collection; all details of collection were previously published19. cGMP concentrations in the gluteus muscles and livers of four Yorkshire domestic pigs were measured in accordance with the described ELISA protocol. Liver tissues were diluted in a 1:5 dilution ratio, and gluteus muscles in a 1:10 dilution ratio, with 0.1 N hydrochloric acid (HCl) to precipitate proteins. The HCl-diluted homogenates were acetylated and then diluted with ELISA buffer in a 1:2 and 1:3 dilution ratio for both liver and gluteus muscle samples. cGMP concentrations were measured as described above. The absorbances were converted to picomoles of cGMP per milliliter of prepared sample and then to nanomoles of cGMP per gram of tissue (nmol/g of tissue) as stated in the above protocol.
cGMP concentrations measured in liver tissues produced optimal experimental results under the above conditions. The cGMP concentrations in the control and in the nitrate-treated group in porcine liver are 0.0202 nmol/g ± 0.003 nmol/g of tissue and 0.0364 nmol/g ± 0.011 nmol/g of tissue, respectively (Figure 3). Several values confirm the reliability of the results. The absorbances of the B0 wells with the blanks subtracted, which range from 0.466 to 0.475, fall within the 0.3 AU to 1.0 AU range, verifying sufficient microplate development with Ellman's reagent. The standard curve's high quality is exhibited by both incremental increases in absorbances from standard 1 to standard 8 and the linearity of the standard curve, verified by a coefficient of determination of 0.99. The percent for every measured well (31.5%-71.2%) is between 20% and 80%, validating that all samples fall on the standard curve. Samples that possess the stated characteristics are fit for interpretation.
cGMP concentrations measured in the gluteus muscle tissues produced suboptimal experimental results. The suboptimal label is assigned to the gluteus muscle results because most of the percent values of the gluteus muscle wells (3.69%-27.3%) fell below 20%, indicating that more dilute samples were needed for the absorbances to fall on the standard curve. The cGMP concentrations in the control and in the nitrate-treated group in porcine gluteus muscle are 1.22 nmol/g ± 0.49 nmol/g of tissue and 0.732 nmol/g ± 0.18 nmol/g of tissue, respectively (graph not shown). The gluteus muscle samples share the absorbances of the liver samples' B0 wells and standards. Using these suboptimal samples may lead to incorrect conclusions; therefore, preparation of more dilute samples and re-measurement of the cGMP concentrations are needed.
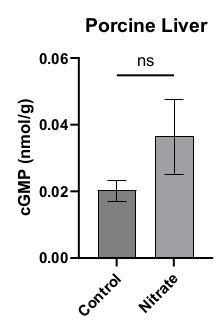
Figure 3: cGMP concentration in liver tissue. The average cGMP concentration of porcine liver treated with sodium chloride (0.15 mmol/kg) or 15N-labeled nitrate (0.15 mmol/kg) in nmol/g of tissue. n = 4; the error bars indicate standard deviation; data were analyzed by Welch's t-test; ns stands for no significance. Please click here to view a larger version of this figure.
Discussion
The protocol provides instructions on the steps required to measure cGMP concentrations in solid tissues using competitive ELISA. Variations in cGMP concentrations can indicate differences in NO's abundance in tissues. By investigating these differences in solid tissues, information about NO in various organs can be elucidated.
In the protocol, tissue samples were first homogenized in preparation for the ELISA. This began by flash-freezing a mass of solid tissue and then pulverizing it. Breaking up tissues prior to the homogenization step is meant to help the bead homogenizer lyse the cells. Tissues were homogenized in 0.1 N hydrochloric acid to precipitate proteins, a technique used in other methods20,21. Finally, the solids and precipitate were separated from the soluble components via centrifugation. To make the standard curve, a stock of cGMP (300 pmol of cGMP/mL) was serially diluted to make eight different standards. Standards and samples were acetylated to improve the assay's sensitivity by detecting concentrations down to 0.1 pmol of cGMP/mL. This increase in sensitivity is accomplished when the acetyl group forms a bond with cGMP, improving each antibody's (present in the antiserum) ability to bind to the acetylated cGMP18. Acetylating both the standards and samples ensures uniformity in cGMP binding between the wells. The acetylation step may be omitted for both standards and samples if the cGMP concentration in the microplate wells is expected to exceed 1.0 pmol/mL18.
In preparation for the addition of samples to the wells, the samples were further diluted with ELISA buffer. The additional dilution allowed the samples to fall on the standard curve and more closely resemble the contents of the NSB, B0, and standard wells, creating uniformity. Along with the samples and standards, several other solutions are mixed in the wells. In the NSB wells, ELISA buffer (with and without the acetylation reagents) is added while antiserum is withheld. This is to determine the amount of AChE tracer (acetylcholinesterase bound to cGMP) that binds to the mouse IgG adhered to the well in the absence of the specific antibody that comprises the antiserum. B0 wells contained ELISA buffer (with the acetylation reagents), AChE tracer, and antiserum; therefore, the B0 wells exhibit the binding ability of the AChE tracer without the competition of cGMP. After all the wells are filled appropriately, the microplate is incubated and then washed. Ellman's reagent was added to the wells. Lastly, an AChE tracer was added to the TA well after Ellman's reagent was added. This well represents the catalytic activity of the AChE tracer regardless of how much tracer was bound to the microplate by the antibodies. The microplate was developed at room temperature, allowing the AChE tracer to catalyze a colorimetric reaction.
Several steps in the protocol may alter the results of the assay; extra care needs to be taken when performing the steps that follow for optimal results. The identification of appropriate dilutions for each tissue type for the homogenization step and after acetylation is needed to guarantee that the samples fall on the standard curve. When preparing the standards, solutions should be thoroughly vortexed or mixed prior to the removal of an aliquot or following the addition of an aliquot. This step is important to reach the expected cGMP concentrations of each standard. During the acetylation steps, each standard and sample should be vortexed for the same duration to achieve consistent absorbance readings. Standards and samples should also be vortexed immediately before the addition of an aliquot to the appropriate well. This practice results in more accurate cGMP concentrations. Thorough washing of the microplate also improves the accuracy of the absorbance values, as it removes all unbound AChE tracer from the well. After the addition of Ellman's reagent, adequate time should be allowed for the microplate to develop, with attention given to the color and, most importantly, the absorbances of the B0 wells. It is important to recognize that the cGMP concentration between duplicates or triplicates may vary more in samples with lower cGMP levels compared to those with higher concentrations. Measuring a more concentrated sample may help address this issue. Additionally, to account for any variability between microplates, samples of the same tissue type should be measured on the same plate, whenever possible. Following these guidelines is expected to improve the quality of the assay's resulting data.
The above protocol can be extrapolated to other soft, solid tissues. Further development of the tissue preparation subsection of the above protocol may result in a method suitable for processing hard tissues, including bone, which may be of interest due to its vascularity. Continued development of this technique may result in a method suited to measure cGMP concentrations in a wide variety of solid tissues, resulting in a useful method to gather additional information about NO's abundance in virtually any tissue. While the competitive ELISA protocol stated above is a useful technique for measuring cGMP and estimating NO's abundance, it has two notable limitations: (1) This assay does not distinguish between cGMP synthesized by soluble guanylyl cyclase and cGMP synthesized by particulate guanylyl cyclase (pGC). Natriuretic peptides stimulate pGC activity22 and, thus, changes to cGMP through this pathway do not indicate changes to NO's abundance; (2) Additionally, phosphodiesterase (PDE) enzymes influence the results of the ELISA assay. Several PDEs hydrolyze cGMP, reducing its concentration following the stimulation of sGC by NO23. Therefore, the catalytic activity of PDEs may obscure the connection between cGMP concentrations and NO's abundance. The addition of a PDE5 inhibitor, such as sildenafil, to prevent cGMP loss is advisable for experiments primarily focused on obtaining exact cGMP concentrations, as opposed to obtaining measurements to observe trends in cGMP concentrations. PDE5 inhibitors can be administered as sildenafil to animals about 1 h before sample collection (effects last up to 4 h24) or, if such administration is not doable, sildenafil can be added to collected samples. When inhibiting PDEs after tissue collection, add sildenafil to the 0.1 N hydrochloric acid so that tissues are homogenized in the presence of sildenafil. Measurements with and without sildenafil need to be taken to ensure that there is no cross-talk between the animal treatment and sildenafil.
Even with its limitations, the assay is used as an informative insight into the downstream transmission of the NO signal. In conclusion, coupling the measurement of cGMP concentrations in solid tissues with other methods of NO measurement allows for a better understanding of NO's effects in organs.
Disclosures
The authors declare they have no conflicts of interest.
Acknowledgements
This work was supported by grant 1ZIADK025104-18 awarded to Alan N. Schechter by intramural NIDDK/NIH.
Materials
| Name | Company | Catalog Number | Comments |
|---|---|---|---|
| 1 mL BD Clear Oral Syringe | Becton Dickinson | 50382903052177 | |
| 14 mL Round Bottom Test Tube | Falcon | 352059 | |
| 2.0 ml Microtubes, Assorted | Olympus Plastics | 24-283A | |
| 30-300 µL multichannel pipette | Eppendorf | 3125000052 | |
| Acetic Anhydride (in cGMP kit) | Cayman Chemical Company | 400031 | 98% pure Hazard: Flammable, Corrosive: severely burns skin, eye damage, Acute toxcitity Safe Handling: Keep away from ignition sources, work in a ventilated area, wear gloves |
| cGMP Acetylcholinesterase Tracer (in cGMP kit) | Cayman Chemical Company | 481020 | potassium phosphate dibasic, sodium chloride, potassium phosphate monobasic, bovine albumin, sodium azide, EDTA, cGMP AChE tracer Hazard: Health hazard: organ toxicity from repeated exposure, Corrosive: eye damage, Skin and respiratory irritant Safe Handling: Work in ventilated a area, wear gloves |
| cGMP ELISA Antiserum (in cGMP kit) | Cayman Chemical Company | 481022 | potassium phosphate dibasic, sodium chloride, potassium phosphate monobasic, bovine albumin, sodium azide, EDTA, rabbit anti-cGMP polyclonal Antiserum Hazard: Health hazard: organ toxicity from repeated exposure, Corrosive: eye damage, Skin and respiratory irritant, Acute toxicity Safe Handling: Work in ventilated a area, wear gloves |
| cGMP ELISA Standard (in cGMP kit) | Cayman Chemical Company | 481024 | potassium phosphate dibasic, sodium chloride, potassium phosphate monobasic, bovine albumin, sodium azide, EDTA, cGMP standard Hazard: Health hazard: organ toxicity from repeated exposure, Corrosive: eye damage, Skin and respiratory irritant Safe Handling: Work in ventilated a area, wear gloves |
| Cyclic GMP ELISA Kit | Cayman Chemical Company | 581021 | |
| ELISA Buffer Concentrate 10X (in cGMP kit) | Cayman Chemical Company | 400060 | 1 M phosphate, 1% BSA, 4 M sodium chloride, 10 mM EDTA, 0.1% sodium azide Hazard: Health hazard: organ toxicity from repeated exposure, Corrosive: eye damage, Skin and respiratory irritant Safe Handling: Work in a ventilated area, store in a container with a closable lid, wear gloves |
| ELISA Reagent Reservoir | Pierce (Now Thermo Fisher Scientific) | 15075 | |
| Ellman's Reagent (in cGMP kit) | Cayman Chemical Company | 400050 | potassium phosphate dibasic, sodium chloride, potassium phosphate monobasic, acetylthiocholine (iodide), 5,5'-dithiobis-(2-nitrobenzoic acid) Hazard: Acute toxicity, Health Hazard: organ toxicity, Corrosive: Eye damage, Skin irritant, repiratory irritant Safe Handling: Work in a ventilated area, wear gloves |
| Hydrochloric Acid | Sigma-Aldrich | 320331 | Hazard: Corrosive: corrodes metal, severely burns skin, Eye damage, Respiratory irritant Safe Handling: Work in a ventilated area, wear gloves |
| Liquid Nitrogen | Robert's Oxygen | Nitrogen Hazard: Compressed Gas: Risk of cryogenic burns, frosbite, suffocation Safe Handling: Work in a ventilated area, wear gloves | |
| Mouse Anti-Rabbit IgG Coated Plate (in cGMP kit) | Cayman Chemical Company | 400006 | Hazard: None |
| New Classic MF Balance | Mettler Toledo | ||
| Orbital Shaker | Stovall Life Science Inc. (Now IBI Scientific) | 15-453-211 (Varies) | |
| Parafilm | Bemis Company, Inc. | 3023-4526 (Varies) | |
| Polysorbate 20 (in cGMP kit) | Cayman Chemical Company | 400035 | Hazard: None |
| Potassium Hydroxide (in cGMP kit) | Cayman Chemical Company | 400029 | 85% pure Hazard: Corrosive: corrodes metals and skin, Eye damage, Acute toxicity Safe Handling: Work in a ventilated area, wear gloves |
| Precellys Evolution Homogenizer | Bertin Technologies | PE000062-PEVO0-A | |
| Precellys Lysing Kit Hard Tissue Homogenizing | Bertin Technologies | P000911-LYSK0-A | |
| Sense Microplate Reader | HIDEX | 425-301 | |
| Sorvall Legend Micro 17R Centrifuge | Thermo Fisher Scientific | 75002441 | |
| Tissue Pulverizer | Cellcrusher | Cellcrusher kit | |
| Vortex Genie 2 | Scientific Industries | SI-0246 | |
| Wash Bottle | Sigma-Aldrich | Z423092 | |
| Wash Buffer Concentrate 400X (in cGMP kit) | Cayman Chemical Company | 400062 | potassium phosphate dibasic, potassium phosphate monobasic, water Hazard: Corrosive: Eye damage, Acute toxicity,Skin irritant, Organ toxicity Safe Handling: Work in a ventilated area, wear gloves |
References
- Dierks, E. A., Burstyn, J. N. Nitric oxide (NO), the only nitrogen monoxide redox form capable of activating soluble guanylyl cyclase. Biochem Pharmacol. 51 (12), 1593-1600 (1996).
- Koglin, M., Behrends, S. A functional domain of the alpha1 subunit of soluble guanylyl cyclase is necessary for activation of the enzyme by nitric oxide and YC-1 but is not involved in heme binding. J Biol Chem. 278 (14), 12590-12597 (2003).
- Olson, L. J., Knych, E. T., Herzig, T. C., Drewett, J. G. Selective guanylyl cyclase inhibitor reverses nitric oxide-induced vasorelaxation. Hypertension. 29 (1), 254-261 (1997).
- Bailey, S. J., et al. Dietary nitrate supplementation reduces the O2 cost of low-intensity exercise and enhances tolerance to high-intensity exercise in humans. J Appl Physiol (1985). 107 (4), 1144-1155 (2009).
- Vanhatalo, A., et al. Acute and chronic effects of dietary nitrate supplementation on blood pressure and the physiological responses to moderate-intensity and incremental exercise. Am J Physiol Regul Integr Comp Physiol. 299 (4), R1121-R1131 (2010).
- Qin, X., et al. Balancing role of nitric oxide in complement-mediated activation of platelets from mcd59a and mcd59b double-knockout mice. Am J Hematol. 84 (4), 221-227 (2009).
- Radomski, M. W., Palmer, R. M., Moncada, S. An l-arginine/nitric oxide pathway present in human platelets regulates aggregation. PNAS. 87 (13), 5193-5197 (1990).
- Thomas, D. D., Liu, X., Kantrow, S. P., Lancaster, J. R. The biological lifetime of nitric oxide: Implications for the perivascular dynamics of NO and O2. PNAS. 98 (1), 355-360 (2001).
- Park, J. W., et al. Preparation of rat skeletal muscle homogenates for nitrate and nitrite measurements. J Vis Exp. (173), e62427(2021).
- Park, J. W., et al. Potential roles of nitrate and nitrite in nitric oxide metabolism in the eye. Sci Rep. 10 (1), 13166(2020).
- Srihirun, S., et al. Nitrate uptake and metabolism in human skeletal muscle cell cultures. Nitric Oxide. 94, 1-8 (2020).
- Montoliu, C., et al. Correlation of nitric oxide and atrial natriuretic peptide changes with altered cGMP homeostasis in liver cirrhosis. Liver Int. 25, 787-795 (2005).
- Origlia, C., et al. Platelet cGMP inversely correlates with age in healthy subjects. J Endocrinol Invest. 27 (2), RC1-RC4 (2004).
- Calamera, G., et al. Fret-based cyclic GMP biosensors measure low cGMP concentrations in cardiomyocytes and neurons. Commun Biol. 2, 394(2019).
- Rutkowski, N., et al. Real-time imaging of cGMP signaling shows pronounced differences between glomerular endothelial cells and podocytes. Sci Rep. 14, 26099(2024).
- Straub, A. C., Beuve, A. A primer for measuring cGMP signaling and cGMP-mediated vascular relaxation. Nitric Oxide. 117, 40-45 (2021).
- Huang, K. T., Lin, T. J., Hsu, M. H. Determination of cyclic GMP concentration using a gold nanoparticle-modified optical fiber. Biosens Bioelectron. 26 (1), 11-15 (2010).
- Cyclic gmp elisa kit. , https://cdn.caymanchem.com/cdn/seawolf/insert/581021.pdf (2024).
- Park, J. W., et al. Dietary nitrate metabolism in porcine ocular tissues determined using 15N-labeled sodium nitrate supplementation. Nutrients. 16 (8), 1154(2024).
- Cgmp enzyme immunoassay kit, direct technical bulletin. , https://www.sigmaaldrich.com/deepweb/assets/sigmaaldrich/product/documents/289/571/cg200bul.pdf?srsltid=AfmBOoqWnOVurQ549ESXk_E7DJoqNs7v268ktTabHHYc6I_6NZkc-j_V (2025).
- Cyclic gmp competitive elisa lysate and homogenate samples. , https://assets.thermofisher.com/TFS Assets/LSG/certificate/Certificates%20of%20Analysis/RA229061_EMSCGMPL.pdf (2025).
- Hamad, A. M., Range, S., Holland, E., Knox, A. J. Regulation of cGMP by soluble and particulate guanylyl cyclases in cultured human airway smooth muscle. Am J Physiol. 273 (4), L807-L813 (1997).
- Mo, E., Amin, H., Bianco, I. H., Garthwaite, J. Kinetics of a cellular nitric oxide/cGMP/phosphodiesterase-5 pathway. J Biol Chem. 279 (25), 26149-26158 (2004).
- Corbin, J. D., et al. [3h]sildenafil binding to phosphodiesterase-5 is specific, kinetically heterogeneous, and stimulated by cGMP. Mol Pharmacol. 63 (6), 1364-1372 (2003).
Reprints and Permissions
