This protocol provides detailed instructions and examples for sample preparation, data acquisition, and data analysis to characterize synthetic polymers with varying dispersity and end-groups using matrix-assisted laser desorption/ionization time-of-flight mass spectrometry.
Method Article
MALDI-ToF MS Method for the Characterization of Synthetic Polymers with Varying Dispersity and End Groups
In This Article
Summary
Abstract
Matrix-assisted laser desorption/ionization time-of-flight mass spectrometry (MALDI-ToF MS) is an effective analytical tool for characterizing synthetic polymers, offering precise molecular weight determination and structural insights such as repeat unit masses and end-group identification. This protocol details the steps for polymer analysis, including sample preparation with appropriate matrix and cation selection, data acquisition, and a calibration method to ensure accurate mass measurements. It highlights the versatility of MALDI-ToF MS in analyzing polymers, from monodisperse to highly disperse materials, while observing limitations in resolving highly disperse samples. By comparing theoretical and observed masses, including isotopic patterns, the method enables confident confirmation of repeat units and end groups. The protocol supports new users by presenting representative data on matrix selection, spectral interpretation across dispersity ranges, and characterization of polymers with unique isotopic features or metastable ion formations. Troubleshooting strategies include addressing issues such as matrix interference and samples that ionize without an added cation during sample preparation. Overall, this guide serves as a foundation for using MALDI-ToF MS as a rapid and reliable technique for polymer analysis.
Introduction
Matrix-assisted laser desorption/ionization time-of-flight mass spectrometry (MALDI-ToF MS) is a highly effective analytical technique for characterizing synthetic polymers1,2,3,4. Many polymers can be characterized by nuclear magnetic resonance (NMR) to confirm the repeat unit structure. However, most of the end groups are a fraction of the repeat unit peaks, even for low molecular weight polymers, and as the molecular weight of a polymer increases, the end-group signals seem difficult to quantify in the NMR5. However, the MALDI-ToF MS data confirms that these are the end groups, even at higher molecular weights. This mass spectrometry technique is known for its soft ionization capability and mostly generates singly charged polymer ions with very minimal fragmentation2. This enables precise molecular weight determination and detailed structural analysis that delivers rapid and accurate results, providing valuable information such as repeat unit masses, end-group identifications, and, for low-dispersity polymers, the determination of number-average molecular weight (Mn), weight-average molecular weight (Mw), and dispersity (Đ)6.
MALDI-ToF MS can analyze polymers with varying dispersity, but has limitations at higher dispersity. For monodisperse polymers such as dendrimers, this method is ideal for confirming their mass and identifying end-groups7. For polymers with low dispersity (1.01-1.09) and some moderate dispersity polymers (Đ = 1.1-1.3), MALDI-ToF MS can also be used to determine the polymer repeat unit mass, end group mass, Đ, Mn, and Mw8. However, for highly dispersed polymers (Đ = 1.3-10), this becomes challenging. For broadly disperse polymers, the lower fractions exhibit a much higher intensity than their higher molecular weight counterparts, leading to an artificially lower dispersity than other characterization techniques such as size exclusion chromatography (SEC). This is described as a "low mass bias". The average repeat unit mass and end groups can be confirmed from the lower molecular weight results, but it is impossible to determine the true Mn, Mw, and Đ for high-dispersity polymers from MALDI-ToF MS9. Therefore, SEC must be added as a characterization technique for broadly dispersed polymers to determine the true Mn, Mw, and Đ.
Optimizing sample preparation is essential for high-quality peak resolution on a MALDI-ToF mass spectrum2,10. The first step involves selecting an appropriate matrix based on polymer polarity. For non-polar polymers, matrices such as trans-2-[3-tert-butylphenyl)-2-methyl-2-propenylidene] (DCTB), galvinoxyl free radical (GFR), and 9-nitroanthracene (9-NA) are commonly used11. Polar polymers are better suited to matrices like α-cyano-4-hydroxycinnamic acid (CHCA), dithranol, 2-(4-hydroxyphenylazo)benzoic acid (HABA), and 2,5-dihydroxybenzoic acid (DHB)12,13,14. For this protocol, DCTB was selected as the primary matrix due to its effectiveness with non-polar polymers, and CHCA was used for polar polymers. Cation selection also plays an important role, as alkali metals like sodium and potassium ionize oxygen-containing polymers effectively, while transition metals like silver are better suited for unsaturated hydrocarbons10,14.
Once the matrix and analyte are selected, the optimal cation:analyte:matrix ratios for the sample solution mixtures are determined. This sample solution mixture will be added to the target plate in a quantity of 1 µL. Not having one or more of the correct ratios of the cation:analyte:matrix selections can affect the sensitivity of the MALDI-ToF MS data acquisition. For the representative data below, the sample preparation has been optimized for the best resolution2,15.
After preparing the sample solution and adding it to the MALDI-ToF MS target plate, this sample is inserted into the MALDI-ToF MS instrument to begin data acquisition. For this study, data were collected exclusively in positive ion mode, and a newer MALDI-ToF mass spectrometer was utilized, building on previous work by Payne et al.16. Important MALDI-ToF MS parameters, such as laser power, laser beam diameter, detector gain, and pulsed extraction delay time, can be adjusted to enhance resolution during acquisition. Two modes are available for MALDI-ToF MS data acquisition: linear and reflectron17. Reflectron mode is preferred for achieving higher signal resolution compared to linear mode18,19. In linear mode, accelerated ions travel directly through the flight tube to the detector. In contrast, reflectron mode involves going through the flight tube once, and then reflecting the ions back through the flight tube a second time before reaching the second detector, which approximately doubles their flight path. This approach enables the differentiation of ions with similar masses but varying velocities20,21. Laser power can also be a factor in increasing the signal-to-noise ratio or decreasing the fragmentation of a polymer22. The lowest laser power possible to ablate a sample will improve the signal-to-noise ratio and will also reduce the possibility of fragmentation22. After optimizing signal resolution and maximizing the signal-to-noise ratio, the acquisition can provide high-quality data for the selected polymer analyte.
Calibration is essential for accurate mass measurement in MALDI-ToF MS. Two main methods are used: internal and external calibration, both relying on calibrants with known masses that cover the analyte's expected range6. For the polymers analyzed in the representative data, monodisperse dendrimer calibrants were selected for calibrating across broad mass ranges23. Internal calibration, where the calibrant is mixed with the cation, analyte, and matrix, improves mass accuracy because both the calibrant and analyte experience the same conditions, and any calibration mass shift affects them equally. However, this method can lead to peak overlap with the resultant polymer signals, complicating the analysis24. In contrast, external calibration, employed in this protocol, avoids peak overlap by preparing and spotting the cation:calibrant:matrix separately from the cation:analyte:matrix on the target plate. However, minor mass inaccuracies may arise due to slight differences in sample placement and local instrument response, such as variations in laser intensity or ionization efficiency across the target, so that the calibrant and the analyte should be within proximity to each other24. In the representative data, the observed mass difference using the external calibration method was less than 0.100 Da from the theoretical value.
Finally, for all polymers, the MALDI-ToF MS data can be analyzed to determine the repeat unit mass and perform end-group analysis of the polymers. Repeat unit mass can be confirmed by comparing the theoretical repeat unit mass using software tools to the observed repeat unit mass in the MALDI-ToF mass spectra. If they match, the polymer is likely to have the expected repeat unit structure (or an isomer). MALDI-ToF MS end-group analysis for polymers begins by calculating the theoretical mass of the analyte. This includes the combined mass of the repeat unit, end-groups, and the selected cation from sample preparation. In the case of monodisperse macromolecules, the calculation includes the total mass of one analyte along with the mass of the selected cation. Software tools for drawing chemical structures can assist in these calculations. The theoretical mass from the software is then compared to the observed mass from the MALDI-ToF mass spectra to verify if the polymer matches the expected molecular structure. However, if the observed repeat unit mass approximately matches the theoretical value, but the total mass of a specified n-mer, including end-groups and the cation, does not, the discrepancy may suggest the presence of unexpected end-groups. To identify unknown end-groups, the reaction conditions are reviewed to determine alternative molecules or reagents that could have reacted to form the observed end-groups. This step is crucial for accurately characterizing all of the polymer's structure.
This protocol provides a step-by-step method for MALDI-ToF MS analysis of synthetic polymers, designed to assist users, particularly beginners, with sample preparation, instrument method optimization, data acquisition, and data analysis. Representative data illustrate the matrix selection for a given polymer; spectra and analysis of polymers with varying dispersity, including monodisperse, moderately disperse, and highly disperse samples; the end group analysis of polymers, which includes those with distinct isotopic resolution patterns (e.g., halogenated), and those prone to metastable ion formation (e.g., azide-terminated); the data analysis of polymers using MALDI-ToF MS, which includes a comparison of observed and theoretical masses to confirm repeat unit mass and total polymer mass, including end groups and cation adducts; and an example of troubleshooting for matrix interference of low mass polymers and self-ionizing polymers.
This protocol not only provides a foundation for MALDI-ToF MS polymer characterization but also offers guidance on sample preparation, step-by-step instrument method optimization (Figure 1), and the interpretation of spectra for both newly synthesized and commercial synthetic polymers.
Protocol
CAUTION: Review the Safety Data Sheets (SDS) for all chemicals prior to use. Perform all sample preparations and MALDI-ToF MS plate preparations in a fume hood, and wear appropriate personal protective equipment (PPE), including safety glasses, a lab coat, and gloves.
1. Sample preparation
- Preparation of matrix, cation, calibrant, and analyte stock solution
- Prepare the alkali cation stock solution by dissolving 2 mg of the desired cation in 1 mL of a solvent selected for its compatibility with the analyte and cation. For sample 1, 2 mg of sodium trifluoroacetate was dissolved in 1 mL of THF.
- Prepare the matrix stock solution by dissolving 20 mg of the desired matrix in 1 mL of a compatible solvent based on the analyte's solubility. Example: For the representative data (Sample 1), dissolve 20 mg of DCTB in 1 mL of tetrahydrofuran (THF).
- Prepare the calibrant stock solution by following the supplier instructions.
- Prepare the analyte solution by dissolving 10 mg of the analyte in 1 mL of a suitable solvent. For sample 1, 10 mg of the analyte is dissolved in 1 mL of THF.
- Preparation of MALDI-ToF MS target plate
- Clean the MALDI-ToF MS target plate.
- Prepare the analyte acquisition sample and calibration sample solution. Add the cation, analyte, and matrix stock solutions in a 1:5:20 µL ratio into tube A and vortex. For external calibration: Add the cation, calibrant, and matrix stock solutions in a 1:5:20 µL ratio into tube B and vortex.
- Add the analyte and calibrant sample solution mixture to the MALDI-ToF MS target plate. Pipette 0.5 µL of the cation:analyte:matrix sample solution mixture (tube A) onto the MALDI-ToF MS target plate using the dried droplet method. Pipette 0.5 µL of the cation:calibrant:matrix mixture (tube B) onto a spot adjacent to the analyte on the MALDI-ToF MS target plate using the dried droplet method. Record the exact location of each spot (row letter and column number) to easily locate the sample and calibrant during data acquisition.
2. Data acquisition
- Insert the MALDI-ToF MS target plate and select an acquisition method
- Insert the MALDI-ToF MS target plate into the instrument. Place the target plate onto the holder with correct orientation, and do not push the MALDI-ToF MS target plate too far in.
- Dock the MALDI-ToF MS target plate on the instrument using the instrument control software.
- Select and open a Method file on the instrument control software. Choose a Reflector positive (RP) or a linear positive (LP) method within the analyte's mass range.
- Monitor the instrument control software to confirm that the target plate has been inserted and the method setup is complete.
NOTE: These representative polymers have oxygens; therefore, positive mode is selected (most compounds have acquisition completed in positive mode). For the representative data, an RP method was selected for the reflector mode on all samples.
- Initial data acquisition
- On the instrument control software, locate the camera displaying the MALDI-ToF MS target plate and a diagram of the wells with the column letters and row numbers displayed. Click on the MALDI-ToF MS well containing the cation:analyte:matrix mixture to select for data acquisition.
- Adjust the mass detection range on the instrument control software to a broad range of 500-20000 Da to ensure that the analyte's expected mass is fully captured. Use the cursor to adjust the range approximately 2x below and above the expected mass of the analyte after an initial acquisition.
- Data acquisition
- Press the Start button on the instrument control software to begin the MALDI-ToF MS data acquisition.
- Press Stop or allow the MALDI-ToF MS acquisition to complete automatically.
- Click Add to add the MALDI-ToF MS single spectrum the sum spectrum buffer.
NOTE: The MALDI-ToF MS single spectrum buffer stores an individual MALDI-ToF mass spectrum, and the sum spectrum buffer accumulates data from multiple acquisitions, increasing the signal intensity. - Reposition the MALDI-ToF MS laser by viewing the camera feed and click Anywhere within the same selected well to move the laser to a new position.
- Repeat the MALDI-ToF MS acquisitions to add MALDI-ToF MS single spectra to the sum buffer. Repeat steps 2.2.3.1 through 2.2.3.4 until the MALDI-ToF MS results are satisfactory.
- Evaluate the MALDI-ToF mass spectrum for resolution and baseline noise. If the MALDI-ToF MS spectrum exhibits high resolution and minimal baseline noise, proceed to the calibration step. If not, consider optimizing the data acquisition method (e.g., adjusting laser power, detector gain, or pulsed ion extraction settings).
- Data acquisition optimization (see Figure 1)
- Adjust the MALDI-ToF MS laser power, detector gain, and pulsed ion extraction one at a time to improve resolution and/or decrease the background noise
- To duplicate the MALDI-ToF MS method, copy and paste the MALDI-ToF MS LP or RP method under a new name. Open the pasted MALDI-ToF MS method file that was created and rename the file.
- Acquire an initial MALDI-ToF mass spectrum by following all steps in section 2.2 for the initial data acquisition, in the data acquisition section. Zoom into a set of peaks of the MALDI-ToF MS with the highest intensity to evaluate resolution and baseline noise on the instrument control software.
- Acquisition optimization
- Adjust the MALDI-ToF MS laser power
- Start at a low MALDI-ToF MS laser power of ~ 4% and follow steps 2.2.3.1 and 2.2.3.2 for the initial data acquisition to start and stop the data acquisition.
- Observe and compare the resolution and baseline noise of the MALDI-ToF MS single buffer and the initial spectrum in the sum buffer.
- Increase the MALDI-ToF MS laser power in 2%-10% increments to enhance ionization. Follow steps 2.2.3.1 and 2.2.3.2 for the initial data acquisition to start and stop the data acquisition after each increment.
- Select the lowest laser power that will provide high-intensity peaks with minimal noise.
NOTE: When the MALDI-ToF MS laser power is 50% and above there is an increased possibility of sample fragmentation.
- Optimize the MALDI-ToF MS laser diameter
- In the detector tab, adjust the MALDI-ToF MS laser diameter to test medium, large, and ultra settings. Follow steps 2.2.3.1 and 2.2.3.2 for the initial data acquisition to start and stop the data acquisition.
- Observe and compare the resolution and baseline noise of the MALDI-ToF MS single buffer and the initial spectrum in the sum buffer.
- Select the MALDI-ToF MS laser diameter that provides optimal resolution with minimal baseline noise.
NOTE: The MALDI-ToF MS laser diameter controls the laser beam diameter.
- Adjust the MALDI-ToF MS detector gain
- By small increments, increase or decrease the MALDI-ToF MS detector gain. Follow steps 2.2.3.1 and 2.2.3.2 for the Initial data acquisition to start and stop the data acquisition for each increase or decrease in the MALDI-ToF MS detector gain.
- Observe the MALDI-ToF mass spectra signal intensity and resolution on the instrument control software with each adjustment of the MALDI-ToF MS single buffer and the initial spectrum in the sum buffer.
- Keep the MALDI-ToF MS detector gain that provides the best intensity and good signal resolution.
- Modify the MALDI-ToF MS pulsed ion extraction
- Adjust the MALDI-ToF MS pulsed ion extraction in 10 ns increments. Follow steps 2.2.3.1 and 2.2.3.2 for the Initial data acquisition to start and stop the data acquisition, for each increase or decrease in detector gain.
- Evaluate how the pulsed ion extraction changes improve the MALDI-ToF MS signal resolution.
NOTE: The MALDI-ToF MS pulsed ion extraction is defined as a time delay between laser ionization. By increasing or decreasing pulse ion extraction, ions of different energies will either stay in the electric field for shorter or longer times. The longer time may allow analytes of the same mass and positively charged ions that ablate at slightly different times to fully accelerate to the same speed as analyte ions of the same mass when the voltage is applied. This can be used to increase the resolution and decrease the background noise of the signal25.
- Adjust the MALDI-ToF MS laser power
- Once the optimal resolution and highest signal-to-noise ratio are achieved, save the optimized MALDI-ToF MS method file for both current and future use.
- MALDI-ToF MS calibration
- Acquire the calibration MALDI-ToF mass spectrum by selecting the Calibration sample on the target plate and following all steps in section 2.2 for the initial data acquisition
- Access the calibration reference points. Navigate to the calibration tab in the instrument control software. Open the appropriate mass control list corresponding to the calibrant used.
- Match the MALDI-ToF mass spectrum calibration peaks with the reference masses in the mass control list.
- In the mass control list, select the Mass corresponding to the first calibration peak in the MALDI-ToF mass spectrum. The MALDI-ToF mass spectrum will automatically zoom in on the selected calibrant peak.
- Set the reference peak by clicking to the Left of the calibrant signal. The peak will be selected.
- Select Apply to set the calibrant signal as the reference mass in the mass control list.
- Repeat this process for all additional calibration peaks. Select the Next mass of interest from the mass control list, align the corresponding calibrant peak, and apply the reference setting.
- Acquire the calibration MALDI-ToF mass spectrum by selecting the Calibration sample on the target plate and following all steps in section 2.2 for the initial data acquisition
- Calibrated polymer analyte sample acquisition
- Locate and select the well containing the cation:analyte:matrix mixture well on the instrument control software.
- Perform data acquisition by following all steps in section 2.2 with the optimized and calibrated method open.
- Add an appropriate file name and save the calibrated analyte MALDI-ToF mass spectrum for further analysis.
- Remove the MALDI-ToF MS target plate with the instrument control software. Clean the MALDI-ToF MS target plate
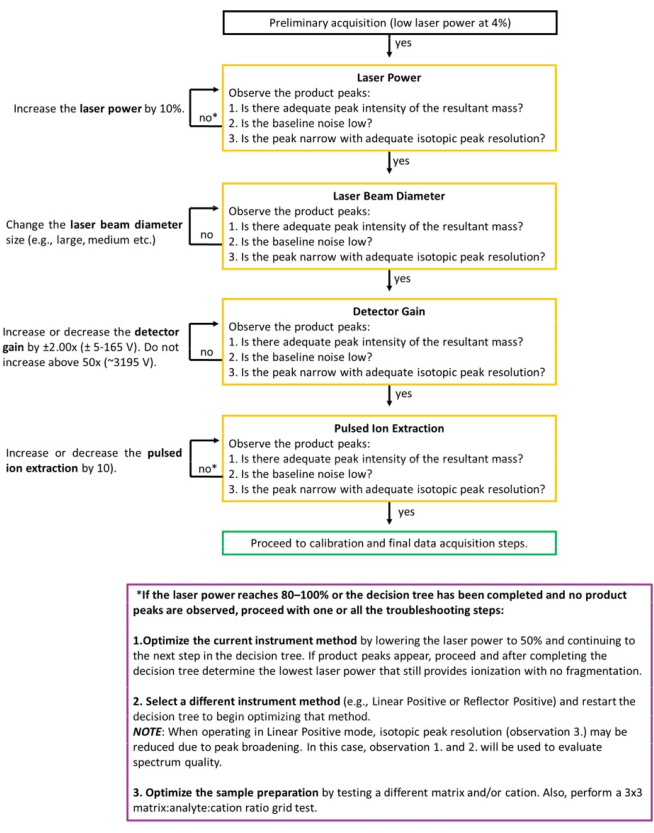
Figure 1: Decision tree for the instrument method optimization. This guide is designed to assist beginner users in systematically optimizing instrument method parameters. Begin with default or initial settings and adjust one parameter at a time by either increasing or decreasing based on observed improvements. Next, continue in the direction that enhances (1) peak intensity, (2) baseline quality (low noise), and (3) provides narrow peak and isotopic resolution. This approach helps identify optimal conditions for reliable and high-quality spectra. If the polymer sample does not ionize or produce a usable spectrum in reflector mode, switch to linear mode and use this same decision tree to optimize parameters. Note that linear mode often results in broader peaks and limited or no isotopic resolution, but it can be effective for higher mass polymers or polymers that may lose ionization in reflector mode. Please click here to view a larger version of this figure.
3. Data analysis and interpretation
- Open the MALDI-ToF MS data analysis software and load the MALDI-ToF MS analyte sample spectrum.
- Select the correct MALDI-ToF MS processing method for the analyte samples. Here, all samples had isotopic resolution, and the first peak was selected for all peaks with the MALDI-ToF MS processing method selected.
NOTE: MALDI-ToF MS processing parameters can be tailored for synthetic polymer samples. For example, a MALDI-ToF MS processing method for polymers was developed during a technical training session by MALDI-ToF MS instrument technician. A MALDI-ToF MS average mass processing method was created by Payne et al. for specific applications16. Contact the MALDI-ToF MS manufacturer's polymer technical team for information and advice on editing the MALDI-ToF MS processing method. - Find peaks using the MALDI-ToF MS analysis software.
- Compare the theoretical and experimental polymer mass
- Record the theoretical polymer mass. Draw the expected macromolecule structure, including the cation, in a chemical drawing software. Open the analysis window in the chemical drawing software and record the theoretical mass.
- Monodisperse Macromolecules: Record the exact mass and molecular weight of the macromolecule by selecting the structure and cation together.
- Low, Moderate, and Highly Disperse Polymers: For repeat unit mass, select the polymer backbone only to record the repeat unit mass. For total mass of a specified n-mer, set the repeat unit number to a mass within the MALDI-ToF MS spectrum range displayed in the MALDI-ToF MS analysis software. Select the entire polymer structure, including the cation and end groups, to record the mass of a specified n-mer.
- Compare the recorded theoretical mass with the observed mass from the MALDI-ToF MS spectrum
- For total mass calculation of monodisperse macromolecules, follow the steps described below.
- Zoom in on the peak with the highest intensity on the MALDI-ToF MS spectrum, ensuring the view includes a mass range of at least 2x below and above the theoretical mass.
- Compare the theoretical mass with the observed mass in the MALDI-ToF mass spectrum. If the difference is less than 0.100 Da, the expected monodisperse macromolecule mass is likely accurate.
- Examine the MALDI-ToF MS spectrum for additional peaks that could indicate the presence of unexpected structures.
- If discrepancies are detected, evaluate potential structural variations. Review the reaction scheme and calculate the masses of alternative structures for comparison.
- For repeat unit mass calculation of Low, Moderate and Highly Disperse Polymers, follow the steps described below.
- Select and zoom into two peaks separated by the repeat unit mass in the MALDI-ToF MS spectrum that exhibit the highest intensity.
- For each pair of adjacent peaks, subtract the observed mass of the higher mass peak from the lower mass peak to calculate the repeat unit mass. Repeat this process for the next set of peaks to confirm the consistency of the repeat unit mass.
- Compare the calculated repeat unit mass with the theoretical repeat unit mass. If the observed and theoretical values match and exhibit consistent mass differences, the polymer repeat unit mass is likely correct.
- For the total mass of a specified n-mer of Low, Moderate, and Highly Disperse Polymers, follow the steps described below.
- Zoom in on the peak on the MALDI-ToF mass spectrum corresponding to the theoretical total mass, as well as peaks one repeat unit above and below.
- Compare the theoretical mass with the observed mass in the MALDI-ToF mass spectrum. If the difference is less than 0.100 Da, the expected end groups are likely accurate.
- Inspect the MALDI-ToF mass spectrum for additional peaks that could suggest unexpected structures.
- If discrepancies are identified, evaluate alternative end groups or structural variations. Review the reaction scheme and calculate the masses for potential alternative end groups or cyclic structures.
- For total mass calculation of monodisperse macromolecules, follow the steps described below.
- Record the theoretical polymer mass. Draw the expected macromolecule structure, including the cation, in a chemical drawing software. Open the analysis window in the chemical drawing software and record the theoretical mass.
Results
Sample 1: Monodisperse Tris[G1](OH)6
Generation 1 of a monodisperse dendrimer consisting of a 1,1,1-tris(hydroxymethyl)propane core with three benzylidene protected bis(hydroxymethyl)propionic acid on the periphery (Tris[G1]Bnz3) was reacted with Pd/C and H2 gas in 1:1 methanol:chloroform to remove the benzylidene groups and resulted in a dendrimer with 6 hydroxyl groups to form Tris[G1](OH)6 (Figure 2A).
Tris[G1](OH)6 was analyzed using NaTFA as the cation agent with CHCA as the matrix. CHCA was used because it is highly effective with polar compounds and interacts with hydroxyl groups of Tris[G1](OH)6 to provide a homogenous layer on the target plate. The MALDI-ToF MS sample preparation was started by making stock solutions of NaTFA (1 mg/mL in THF), the analyte (5 mg/mL in THF), and CHCA (5 mg/mL in THF). Once these solutions were made, 1 µL of the Na+ cation solution, 5 µL of the analyte solution, and 20 µL of the matrix solution were combined in a microcentrifuge tube and vortexed (ratio of 1:25:100 cation:analyte:matrix for a total of 26 mL). Next, 1 µL of this mixture was removed from the microcentrifuge tube and dried on the MALDI-ToF MS target plate. This sample was analyzed in reflector mode, and the peak was confirmed in the MALDI-ToF MS spectrum by comparing the theoretical and observed values (Figure 2B, red).
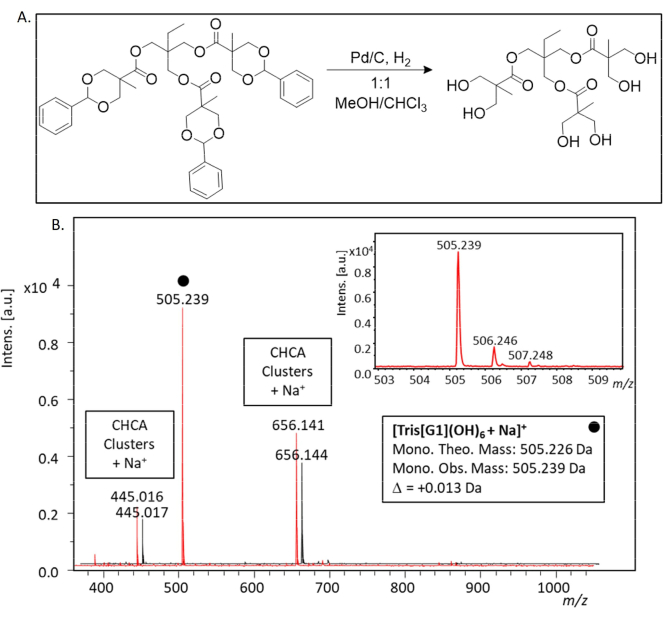
Figure 2: (A) Reaction scheme for sample 1 modification to Tris[G1](OH)6. The benzylidene groups were removed with a Pd/C and H2 reaction to form Tris[G1](OH)6. MALDI-ToF MS was used to determine the completion of the reaction. (B) MALDI-ToF mass spectra of sample 1, Tris[G1](OH)6 and a blank matrix spectrum overlaid, which included the matrix and salt ([CHCA + Na]+). The full MALDI-ToF MS spectrum and zoom-in of Tris[G1](OH)6 shows an observed mass value for [Tris[G1](OH)6 + Na+]+ is 505.239 Da and has a difference of +0.013 Da from the theoretical mass of 505.226 Da. By comparing the blank MALDI-ToF MS matrix spectrum (black) with the Tris[G1](OH)6 MALDI-ToF MS spectrum (red), all peaks other than 505.26 Da can be disregarded. Please click here to view a larger version of this figure.
The Na+ adduct for Tris[G1](OH)6 was observed. The theoretical mass value of [Tris[G1](OH)6 + Na]+ is comprised of the mass of the monoisotopic peak of Tris[G1](OH)6 (482.2362 Da) plus the mass of the sodium cation (22.9892 Da) which yields a total mass of 505.226 Da. The observed mass value for [Tris[G1](OH)6 + Na]+ is 505.239 Da, which matched the theoretical value with a difference of +0.013 Da.
To ensure complete removal of all three benzylidene groups, the MALDI-ToF MS spectrum was further analyzed between 505-769 Da. This mass range allows for the detection of any peripheral groups that were not detected. There would be presence of a peak, [Tris[G1]Bnz2(OH)2 + Na]+, that would indicate that one benzylidene removed at 681.289 Da ([Tris[G1]Bnz3 + Na]+ 769.3194 Da - 88.0313 Da), and at 593.257 Da peak ([Tris[G1]Bnz3 + Na]+ 769.3194 Da -176.0626 Da) for [Tris[G1]Bnz1(OH)4 + Na]+ that would indicate two benzylidene groups were removed from Tris[G1]Bnz3 (Figure 3). These peaks and Tris[G1]Bnz3 are not present; therefore, the reaction went to completion, and Tris[G1](OH)6 was synthesized.
![Chemical structure diagrams, monoisotopic mass, [Tris(G1)Bn+Na]+, theoretical mass notation.](/files/ftp_upload/68455/68455fig3.jpg "figure-results-2")
Figure 3: Structures and theoretical masses of Tris[G1]Bnz3, the intermediates of Tris[G1]Bnz2(OH)2, Tris[G1]Bnz1(OH)4, and sample 1 Tris[G1](OH)6. The black dot indicates the product. Structures and theoretical masses of one and two benzylidene groups removed and the fully hydroxylated Tris[G1](OH)6 Please click here to view a larger version of this figure.
In the low molecular weight region below 900, multiple peaks that do not align with the Tris[G1](OH)6 monodisperse mass are present. Most matrices have minor noise issues below 1000, so a blank MALDI-ToF MS spectrum is included to confirm that Tris[G1](OH)6 is pure. The matrix blank sample included the matrix (CHCA) and cation (Na+) stock solutions. The same cation: matrix concentration ratio amounts from the Tris[G1]OH6 (1:100 mg/mL) were used for the analysis sample mixture. Next, 1 µL of the mixture was added to the sample plate and dried for analysis.
The preliminary data acquisition, calibration acquisition, and data acquisition were completed to acquire a blank MALDI-ToF MS matrix spectrum. In Figure 2B (black), the MALDI-ToF MS blank matrix (black) and sample Tris[G1](OH)6 spectrum (red) were overlaid in flex analysis to compare and confirm which peaks are not associated with the product. Any peaks identified in the blank MALDI-ToF MS matrix spectrum and the Tris[G1](OH)6 can be ignored, and therefore, the only peak is 505.226 Da, which corresponds to sample 2. For example, 445.016 Da and 656.141 Da peaks in the Tris[G1](OH)6 MALDI-ToF MS spectrum (Figure 2B red) are also located in the blank MALDI-ToF MS matrix spectrum (Figure 2B black) at 445.017 Da and 656.144 Da and have a difference of +0.001 Da and +0.003 Da, respectively. These peaks will not be included in the analysis since they match and have similar differences from the blank matrix and Tris[G1](OH)6 MALDI-ToF MS spectrum. Therefore, the mass of Tris[G1](OH)6 is confirmed through MALDI-ToF MS but other analysis such as SEC and NMR will be necessary to confirm the purity of the sample.
Sample 2: Poly(2,2-dimethylpropanoate) with a chloride and a proton end group
3-Chloro-2,2-dimethylpropanoic acid was polymerized using potassium carbonate as a base (Figure 4A). A sample of poly(2,2-dimethylpropanoate) (PDMP) with chloride on one end and a proton on the other end (Mn = 980 Da) was ionized with MALDI-ToF MS to determine the polymeric architectures formed during the reaction and to analyze the different end groups. The MALDI-ToF MS sample preparation was started by making stock solutions of NaTFA (2 mg/mL in THF), the analyte (5-7 mg/mL in THF), and DCTB (20 mg/mL in THF). Once these solutions were made, 5 µL of the Na+ cation solution, 5 µL of the analyte solution, and 10 µL of the matrix solution were combined in a microcentrifuge tube and vortexed (ratio of 10:25:200 cation:analyte:matrix for a total of 20 mL). Next, 1 µL of this mixture was removed from the microcentrifuge tube and dried on the MALDI-ToF MS target plate. For the matrix, DCTB was selected as it works with many other polyesters, however, other matrices such as CHCA, HABA, GFR, and DHB have been tried. CHCA, HABA, and GFR ionized the sample well, however, DHB proved to be unsuccessful. NaTFA ion worked better compared to potassium trifluoroacetate (KTFA), cesium trifluoroacetate (CsTFA), lithium trifluoroacetate (LiTFA), and silver trifluoroacetate (AgTFA) because it interacts better with the oxygens of the ester groups.
The MALDI-ToF MS spectrum (Figure 4B) confirmed the molecular weight distribution of PDMP with a chloride end group for sample 3 to be in the range from 600 Da to 1600 Da. This means the sample had low dispersity, which led to the Mn, Mw, and Đ values being 980 Da, 1070 Da, and 1.09, respectively, using MALDI-Tof MS analysis software. The monoisotopic peak was sufficiently resolved in the reflectron mode, which enabled the use of exact mass identification.

Figure 4: Reaction scheme and MALDI-ToF MS mass spectrum of sample 2. (A). Reaction scheme for the synthesis of PDMP using 3-chloro-2,2-dimethylpropanoic acid. (B) MALDI-ToF MS mass spectrum of sample 2. This full MALDI-ToF MS spectrum shows the overall distribution of the sample of PDMP with a chloride end group (Mn = 980 Da) ionized with Na+. Please click here to view a larger version of this figure.
To confirm the polymer repeat unit mass, the mass difference between two adjacent peaks was calculated. The repeat unit of the polymer has an observed average molecular weight of 100.056 Da and this was confirmed by taking the average mass of eight peaks (main distribution) in the range of 600 Da to 1300 Da, which is only +0.004 Da below the theoretical repeating unit of PDMP (100.052 Da) and, in addition, has an end group mass that corresponds to one hydrogen (on the front end) and one chloride (on the back end).
The MALDI-ToF MS spectrum revealed three distinct distributions, each corresponding to the resultant polymer with different end groups. These end groups were identified and confirmed by calculating their theoretical masses and comparing them to the observed masses in the MALDI-ToF MS spectrum. To further identify the end groups, an individual n-mer was selected for the analysis (Figure 5).
The major distribution of PDMP showed the polymer having one hydrogen (on the front end) and one chloride (on the back end; blue). The theoretical mass value of the 8-mer of PDMP (Figure 5) is comprised of the mass of the repeat units (100.0524 Da x 8) plus the mass of the Cl end group (+ 34.9689 Da) and the mass of hydrogen end group (+ 1.0078 Da) plus the mass of the sodium cation (+ 22.9892 Da) which yields a total 8-mer mass of 859.385 Da. The observed mass value for 8-mer [H-PDMP8-Cl + Na]+ is 859.426 Da, which is only +0.041 Da different from the theoretical value.
The next distribution (orange) showed the polymer replacing the proton on the front end with a sodium and a chloride on the back end. The theoretical mass value of the 8-mer of the deprotonated PDMP is comprised of the mass of the repeat units (100.0524 Da x 8) plus the mass of the Cl end group (+ 34.9689 Da) and the mass of two sodium groups (+ (22.9892 Da x 2)) which yields a total 8-mer mass of 881.367 Da. The observed mass value for 8-mer [Na-PDMP8-Cl + Na]+ is 881.413 Da, which is only +0.046 Da different from the theoretical value.
Lastly, the third distribution (green) of PDMP confirmed the presence of cyclic oligomeric species. The theoretical mass value of the 8-mer of cyclic PDMP is comprised of the mass of the repeat units (100.0524 Da × 8) plus the mass of one sodium group (+ 22.9892 Da), yielding a total 8-mer mass of 823.409 Da. The observed mass value for the cyclic 8-mer [PDMP8 + Na]+ is 823.448 Da, which is only +0.039 Da different from the theoretical value.
The presence of halogens on the polymer can be identified by MALDI-ToF MS. The end group on the linear polymer has one Cl, which is indicated by the approximately 3:1 ratio of [M+] and [M+2]+ peaks. The difference between the observed and theoretical [M+] and [M+2]+ peaks have been shown in Table 1. The theoretical and observed percentage abundance for the second peak at 761.3 Da [M+2]+ are 42.3 % and 42.2 %, respectively (with the first peak being 100 %), which confirms the presence of one Cl group on the polymeric end group. The cyclic species was found to be 36 Da below the linear sodiated compound, and 58 Da below the disodiated compound. In addition, this cyclic compound did not have the 3:1 ratio that a monochlorinated species has. This chloride could have been removed via an SN2 attack with the carboxylate on the opposite end, leading to the ring closure.

Figure 5: MALDI-ToF MS mass spectrum of an individual repeat of sample 2. This MALDI-ToF MS spectrum shows the major peak as PDMP with hydrogen and chloride end groups (Mn = 980 Da) ionized with Na+. Please click here to view a larger version of this figure.
Table 1: Comparison between the observed and theoretical peak percentage abundance and peak isotopic intensity of [M+] and [M+2]+ peaks (with [M+] = 100 %) of the linear PDMP with hydrogen and chloride end group (Mn = 980 Da) from MALDI-ToF MS. The end group on the linear polymer has one Cl which is indicative by the approximately 3:1 ratio of [M+] and [M+2]+ peaks. Please click here to download this Table.
Sample 3: Poly(2,2-dimethylpropanoate) with a quaternary ammonium and proton end groups.
3-Bromo-2,2-dimethylpropanoic acid was polymerized using triethylamine (TEA) as a base, however, it was determined that TEA was replacing Br on the end group (Figure 6A). A sample of PDMP with a quaternary ammonium on one side and a proton on the other end (Mn = 1410 Da) was used to compare the isotopic distribution with those having a Cl end group. The MALDI-ToF MS sample preparation was started by making stock solutions of KTFA (2 mg/mL in THF), the analyte (5-7 mg/mL in THF), and DCTB (20 mg/mL in THF). Once these solutions were made, 5 µL of the K+ cation solution, 5 µL of the analyte solution, and 10 µL of the matrix solution were combined in a microcentrifuge tube and vortexed (ratio of 10:25:200 cation:analyte:matrix for a total of 20 mL). Next, 1 µL of this mixture was removed from the microcentrifuge tube and dried on the MALDI-ToF MS target plate. For the matrix, DCTB was selected as it works with many other polyesters. The potassium cation was added to confirm whether the sample was self-ionizing.
The polymer contains quaternary nitrogen (positively charged) on the end group, which can self-ionize. This was confirmed by MALDI-ToF MS spectra since the mass-to-charge ratio (m/z) did not change regardless of whether K+ or Na+ was used in the sample preparation. Additionally, the MALDI-ToF MS spectra confirmed the presence of positively charged quaternary ammonium on the end group, as Br is a good leaving group.
The MALDI-ToF MS spectra confirmed the molecular weight distribution of PDMP with a quaternary ammonium end group to be within the range from 600 Da to 2200 Da (Figure 6B). This means the sample had low dispersity, which led to the Mn, Mw, and Đ values being 1410 Da, 1540 Da, and 1.08, respectively using the MALDI-Tof MS analysis software.
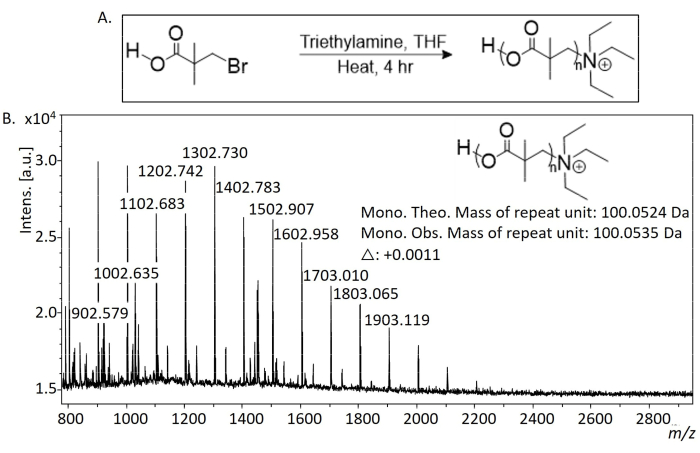
Figure 6: Reaction scheme and MALDI-ToF MS mass spectrum of sample 3. (A) Reaction scheme for sample 3. Reaction scheme for the synthesis of PDMP using 3-bromo 2,2-dimethylpropanoic acid with triethylamine as a base. (B) This full MALDI-ToF MS spectrum shows the overall distribution of the linear PDMP with a quaternary ammonium end group (Mn = 1410 Da). Please click here to view a larger version of this figure.
To confirm if the polymer had the same repeat unit (monomer), the difference between two adjacent peaks was calculated. The repeat unit of the polymer has an observed average molecular weight of 100.0535 Da. This was confirmed by looking at the average of twelve peaks (main distribution), ranging from 900 Da to 2300 Da, which is only +0.0011 Da above the theoretical repeat unit (100.0524 Da).
The MALDI-ToF MS spectrum displayed two different distributions. One of the distributions showed the polymer has a carboxylic acid and a positively charged quaternary ammonium as the end groups (black), while the other distribution (purple) showed the loss of proton from the carboxylic acid and an addition of potassium ion. To further identify the end groups, an individual n-mer was selected for the analysis (Figure 7).
The theoretical mass value of the 12-mer of PDMP with quaternary ammonium end group is comprised of the mass of the repeat units (100.0524 x 12) plus the mass of the quaternary ammonium end group (+ 101.1199) and the mass of hydrogen end group (+ 1.0078) which yields a total 12-mer mass of 1302.757 Da. The observed mass value for 12-mer [H-PDMP12-TEA]+ is 1302.730 Da, which is only -0.027 Da below the theoretical value.
The theoretical mass value of the 12-mer of PDMP with quaternary ammonium end group on one side and the replacement of proton with another potassium ion is comprised of the mass of the repeat units (100.0524 × 12) plus the mass of the quaternary ammonium end group (+ 101.1199) and the mass of potassium end group (+ 38.9637) which yields a total 12-mer mass of 1340.713 Da. The observed mass value for 12-mer [K-PDMP12-TEA]+ is 1340.700 Da, which is only -0.013 Da below the theoretical value.

Figure 7: MALDI-ToF MS mass spectrum of an individual repeat of sample 3. This MALDI-ToF MS spectrum shows the primary distribution of the linear PDMP with a quaternary ammonium end group (Mn = 1410 Da). Please click here to view a larger version of this figure.
Sample 4: Linear poly(ethylene brassylate)
The next polymer sample characterized by MALDI-ToF MS is linear poly(ethylene brassylate) (l-PEB). This was synthesized from the macrocyclic monomer ethylene brassylate, which has a seventeen-member ring containing two ester groups (Figure 8A). To understand the functional group and architectural change within the polymeric structure, four different characterization techniques were explored: MALDI-ToF MS, 1H-NMR, SEC, and Fourier-transform infrared spectroscopy (FTIR). 1H-NMR, SEC, and FTIR confirm the removal of the cyclic diester and formation of α-propargyl-ω-hydroxy-PEB. However, these techniques did not detect any type of byproduct formation. On the other hand, the MALDI-ToF MS spectrum (Figure 8B) of l-PEB exhibits three different mass distributions that indicate the formation of three different PEBs: α-hydroxy-ω-hydroxy-PEB (1), α-propargyl-ω-propargyl-PEB (2), and α-propargyl-ω-hydroxy-PEB (3), respectively (Figure 8B).
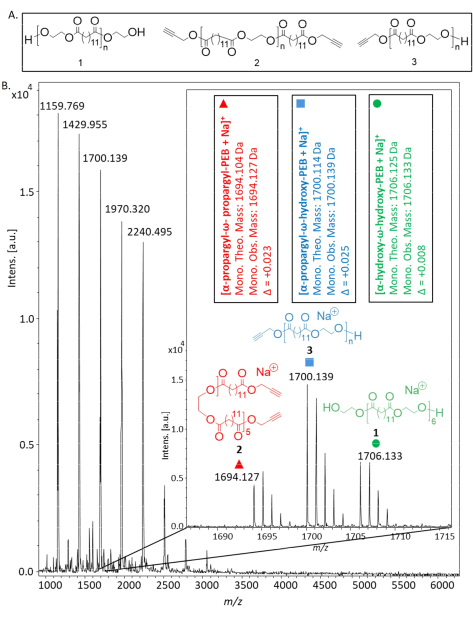
Figure 8: MALDI-TOF spectrum of l-PEBs with Na+. (A) Linear poly(ethylene brassylate) structures. (1) α-hydroxy-ω-hydroxy-PEB (2) α-propargyl-ω-propargyl-PEB (3) α-propargyl-ω-hydroxy-PEB. (B) Three distributions, including α-hydroxy-ω-hydroxy-PEB (1), α-propargyl-ω-propargyl-PEB (2), and α-propargyl-ω-hydroxy-PEB (3), were identified. Please click here to view a larger version of this figure.
The l-PEB sample was analyzed on the MALDI-ToF MS by using DCTB as the matrix for non-polar polymers. The MALDI-ToF MS sample preparation was started by making stock solutions of NaTFA (1 mg/mL in THF), the analyte (5 mg/mL in THF), and DCTB (20 mg/mL in THF). Once these solutions were made, 1 µL of the Na+ cation solution, 5 µL of the analyte solution, and 20 µL of (4) the matrix solution were combined in a microcentrifuge tube and vortexed (ratio of 1:25:400 cation:analyte:matrix for a total of 26 mL). Next, 1 µL of this mixture was removed from the microcentrifuge tube and dried on the MALDI-ToF MS target plate. The observed MWs for each distribution were within a deviation of 0.03 Da from the exact molecular weights of the [M + Na]+ ions.
The theoretical mass value for the 6-mer of α-hydroxy-ω-hydroxy-PEB (1) is comprised of the mass of the repeat units (270.1831 Da x 6), plus the mass of the 2-hydroxyethoxy end group (+ 61.0290 Da), plus the mass of the hydrogen end group (+ 1.008 Da), plus sodium cation (+ 22.9892 Da) which yields a total 1706.124 Da. The observed mass value for the 6-mer of α-hydroxy-ω-hydroxy-PEB (1) is 1706.133 Da, which was only +0.009 Da above the theoretical value.
The theoretical mass value for the 5-mer of α-propargyl-ω-propargyl-PEB (2) is comprised of the mass of the repeat units (270.1831 Da x 5), plus the mass of the ethylene brassylate minus OCH2CH2O (+ 210.1620 Da), plus the mass of two propargyl ether end groups (+ 55.0184 Da x 2), plus sodium cation (+ 22.9892 Da) which yields a total 1694.103 Da. The observed mass value for the 5-mer of α-propargyl-ω-propargyl-PEB (2) is 1694.127 Da, which was only +0.024 Da above the theoretical value.
The theoretical mass value for the 6-mer of α-propargyl-ω-hydroxy-PEB (3) is comprised of the mass of the repeat units (270.1831 Da x 6), plus the mass of the propargyl ether end group (+ 55.0184 Da), plus the mass of the hydrogen end group (+ 1.008 Da), plus sodium cation (+ 22.9892 Da) which yields a total 1700.113 Da. The observed mass value for 6-mer of α-propargyl-ω-hydroxy-PEB (3) is 1700.139 Da, which was only +0.026 above the theoretical value.
Sample 5: Azidified linear poly(ethylene brassylate)
Furthermore, I-PEB (sample 6) was functionalized with 6-azidohexanoic acid by means of esterification of its alcohol end groups (Figure 9), yielding azidified l-PEB (sample 7). The obtained product was also analyzed on the MALDI-ToF MS (Figure 10) by using the sample preparation techniques as the parent polymer (sample 6). The observed MWs for each distribution were within a deviation of 0.04 Da from the exact molecular weights of the [M + Na]+ ions. After the esterification, the [M + Na]+ ions of l-PEBs with two hydroxy end groups (1) show a shift in mass because of their conversion from (1) to α-azido-ω-azido-PEB (4). In addition, l-PEBs with one hydroxy end group and one propargyl end group (3) were converted to an α-propargyl-ω-azido-PEB (5). However, (2) remains unreacted due to both of its alkyne end groups.

Figure 9: Esterification of linear poly(ethylene brassylate) with alcohol end group via 6-azidohexanoic acid reaction scheme. α-hydroxy-ω-hydroxy-PEB (1) converts to α-azido-ω-azido-PEB (4) and α-propargyl-ω-hydroxy-PEB converts(3) to α-propargyl-ω-azido-PEB (5). α-propargyl-ω-propargyl-PEB (2) remains unreacted due to the alkyne end groups which do not undergo an esterification reaction. Please click here to view a larger version of this figure.
The theoretical mass value for the 6-mer of α-propargyl-ω-azido-PEB (5) is comprised of the mass of the repeat units (270.1831 Da × 6), plus the mass of the propargyl ether end group (+ 55.0184 Da), plus the mass of the azidohexanoate end group (+ 140.0824 Da), plus sodium cation (+ 22.9892 Da) which yields a total 1839.188 Da. The observed mass value for 6-mer of α-propargyl-ω-azido-PEB (5) is 1839.184 Da, which is only -0.004 Da below the theoretical value. Moreover, the presence of metastable ion (5-N2) peaks for (5) is another indication of azide functionalization, as metastable ions will only form if there is an azide present in the molecule.
The theoretical mass value for the 6-mer of the metastable peak (5-N2 + Na+) is 1815.126 Da, which was determined by using the equation from the plot of mass difference of metastable peak and α-azido-ω-hydroxy-PEG peaks (Figure 11). The observed mass value for 6-mer of the metastable peak is 1815.089 Da, which is only -0.031 Da below the theoretical value. The plot indicates that, within the mass range of 1000 to 2000 Da, the theoretical mass value of the metastable peak is 24 to 24.1 Da lower than that of (5).
The theoretical mass value for the 6-mer of α-azido-ω-azido-PEB (4) is comprised of the mass of the repeat units (270.1831 Da × 6), plus the mass of the 6-azidohexanoate end group (+ 140.0824 Da), plus the mass of the 2-oxyethyl-6-azidohexanoate end group (+ 200.1035 Da), plus sodium cation (+ 22.9892 Da) which yields a total 1994.273 Da. The observed mass value for the 6-mer of α-azido-ω-azido-PEB (4) is 1994.296 Da, which is +0.023 Da above the theoretical value.
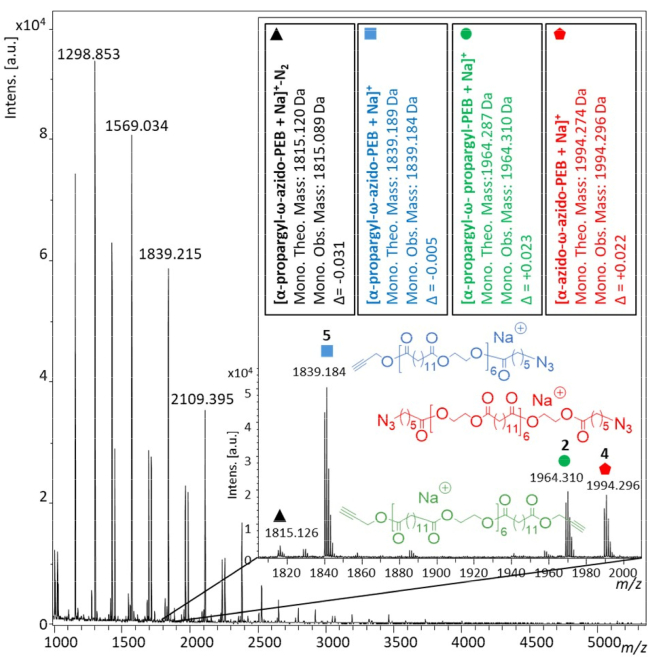
Figure 10: MALDI-ToF spectrum of azidified l-PEBs with Na+. These include three distributions of α-propargyl-ω-propargyl-PEB (2), α-azido-ω-azido-PEB (4), and α-propargyl-ω-azido-PEB (5). Please click here to view a larger version of this figure.
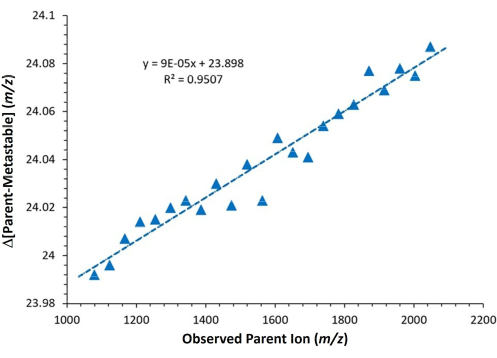
Figure 11: Graphical illustration of the mass difference between α-azido-ω-hydroxy-PEG and its metastable compound relative to the mass of α-azido-ω-hydroxy-PEG (average mass 1700 Da). This graph is derived from the MALDI-ToF spectrum of α-azido-ω-hydroxy-PEG. Please click here to view a larger version of this figure.
Sample 6: A Broadly Dispersed Comb Polymer
The final reaction scheme is a comb polymer that has thioether repeating units with poly(ethylene glycol) side chains9. The comb polymer sample made from 400 Mn methyl ether-PEG-propargyl and 1,6-hexanedithiol (CP MeO-PEG-400 HDT; Figure 12A) was analyzed using NaTFA. Sodium was chosen as the counter ion because ethers and thioethers more readily ionize with sodium, lithium, and potassium rather than higher alkali earth metals such as cesium. These samples were run with a non-polar matrix, DCTB, though additional matrices (CHCA and DT) were also tested with poor results. The MALDI-ToF MS sample preparation was started by making stock solutions of NaTFA (1 mg/mL in THF), the analyte (5 mg/mL in THF), and DCTB (20 mg/mL in THF). Once these solutions were made, 1 mL of the cation solution, 5 mL of the analyte solution, and 20 mL of the matrix solution were combined in a microcentrifuge tube and vortexed (ratio of 1:25:400 cation:analyte:matrix for a total of 26 mL). Next, 1 mL of this mixture was removed from the microcentrifuge tube and dried on the MALDI-ToF MS target plate. Because NaTFA was added to the sample as a counter ion, the MALDI-ToF MS mass spectrum exhibited the expected Na+ adducts of the known sample. Additionally, increases of roughly 16 Da, 32 Da, and 48 Da above these peaks were also observed and will be discussed later in this paper.

Figure 12: Reaction scheme for sample 6 and MALDI-ToF mass spectrum of sample 6 (A) Chemical structure and reaction conditions of a dithiol−yne-based comb polymer with several HDT spacers and 400 Mn PEG side chains. (B) MALDI-ToF mass spectrum of sample 6, CP MeO-PEG-400 HDT. Major repeat unit = 550.30 Da, Minor repeat unit = 44.02 Da Please click here to view a larger version of this figure.
MALDI-ToF MS confirmed the wide distribution (dispersity by SEC = 2.88; Figure 12B) of CP MeO-PEG-400 HDT. The monoisotopic peak (comprising exclusively the most abundant elemental isotopes, namely 12C, 1H, 16O, and 32S) was sufficiently resolved, which enabled the use of exact mass identification. All theoretical mass calculations were determined using monoisotopic masses for each element. Due to the wide dispersity of the sample (2.88 by SEC), the MALDI-ToF mass spectrum could not be used to calculate the Mn, Mw, or Đ. MALDI-ToF MS excels with characterization of narrowly dispersed polymers (Đ < 1.3) but can struggle with full characterization of broadly dispersed polymers. When describing polymers with broad dispersities, only the lower molecular weight end of the mass spectrum will be well resolved and visible with MALDI-ToF MS, excluding any higher molecular weight species. This phenomenon is referred to as a low mass bias. Due to this occurrence, full characterization of the comb polymers through MALDI-ToF MS alone is unachievable. For this reason, SEC was used in tandem with MALDI-ToF MS to get accurate Mn, Mw, and Đ values.
To confirm the presence of the comb polymer, a similar approach for a standard linear or cyclic polymer was taken. Each repeat unit of the comb polymer contains a narrow distribution of Mn = 400 PEG side chains, so the comb polymer repeat units were explored to determine the presence of the intended product in each. Additionally, there was a small amount of starting material from the polymerization left in the reaction solution (300-700 Da) that was also characterized.
In the full MALDI-ToF MS spectrum, the lower and higher MW for 6 to 15-mers of the MeO-PEG-OH can be seen. Originally, in the MALDI-ToF MS spectrum of the MeO-PEG-propargyl starting material, these MeO-PEG-OH were not visible (Figure 13; top spectrum). The appearance of these peaks is due to the relative concentration of the MeO-PEG-propargyl to the MeO-PEG-OH. As the comb polymer reaction proceeds, the MeO-PEG-propargyl is incorporated into the product. Because of this, the ratio of the alkyne starting material compared to the MeO-PEG-OH starts to decrease, which shows unfunctionalized MeO-PEG-OH in the MALDI-ToF MS spectrum (Figure 13; bottom spectrum).
As for the product mass distribution, exact mass values were used for all subsequent calculations. The theoretical mass value of one repeat unit of the starting material [MeO-(PEG10)-CH2CCH + Na]+ is 44.0262 Da. This repeat unit mass times the number of repeat units, which will be 10 for each side chain, (44.0262 Da x 10) plus the mass of the α-methoxy end group (+ 31.0183 Da) and the mass of the ω-propargyl end group (+ 39.0235 Da) plus the mass of the sodium cation (+ 22.9892 Da) yields a total 10-mer mass of 533.2932 Da. The observed mass value for the 10-mer PEG + Na+ is 533.239 Da, which is -0.054 Da below the theoretical value (Figure 13). In the full MALDI-ToF MS spectra, there is the 6 to 9-mer below and the 11 to 15-mer above for this series. The sequence of smaller, offset peaks in the low molecular weight spectrum corresponds to unfunctionalized MeO-PEG-OH starting material where the theoretical mass value of the 11-mer is comprised of the mass of the repeat units (44.0262 Da x 11) plus the mass of the α-methoxy end group (+ 31.0184 Da) and the mass of the ω-hydrogen end group (+ 1.008 Da) and the mass of the sodium cation (+ 22.9892 Da) which yields a total 11-mer mass of 539.304. The observed mass value for the 11-mer + Na+ is 539.252 Da, which is only -0.052 Da below the theoretical value.

Figure 13: MALDI-ToF mass spectra (zoomed in from 530-615 Da) of starting material (top) and low molecular weight species of sample 8 (bottom), CP MeO-PEG-400 HDT. The ratio of the alkyne starting material compared to the MeO-PEG-OH (top spectrum and red) starts to decrease which shows unfunctionalized MeO-PEG-OH (bottom spectrum and blue) in the CP MeO-PEG-400 HDT MALDI-ToF mass spectrum (bottom spectrum). Please click here to view a larger version of this figure.
As for the cyclic comb polymers, their masses with varying degrees of polymerization can be multiplied by the individual parts of the desired n-mer. The theoretical mass value of the 2-mer [CP-MeO-PEG16 HDT + Na]+ is comprised of the mass of the repeat units of each PEG chain, of which there are roughly 8 per chain, (44.0262 Da x 16) plus the mass of the terminal methyl end groups of each PEG chain (+ 15.0235 Da x 2) plus the mass of the carbons that were once the propargyl group and have now reacted with the thiols (+ 41.0391 Da x 2) plus the mass of the HDT that has reacted with the alkynes (+ 148.0380 Da x 2) and the mass of the sodium cation (+ 22.9892 Da) which yields a total 2-mer mass of 1167.599 Da. The observed mass value for the 2-mer [CP-MeO-PEG16 HDT + Na]+ is 1167.626 Da, which is +0.027 Da above the theoretical value (Figure 14). Although the lower molecular weight cyclic structures were observed, the linear compounds with either thiols on both ends or double bonds on both ends could not be observed.
These thioether-containing polymers can also undergo oxidation, converting the thioethers to sulfoxides9. This accounts for the addition of multiple oxygens (+ 15.9949 Da x n) depending on the degree of oxidation; this differs from the K+ adduct, which is a difference of +15.9739 Da from the Na+ adduct. For the single oxidation of the 2-mer [CP-MeO-PEG16 HDT + Na]+, the theoretical mass value is 1183.594 Da, while the observed mass value was 1183.620 Da with only an increase of +0.026 Da from the theoretical value. For the double oxidation of the 2-mer [CP-MeO-PEG16 HDT + Na]+, the theoretical mass value is 1199.590 Da, while the observed mass value was 1199.613 Da with an increase of only +0.023 Da from the theoretical value. Finally, for the triple oxidation of the 2-mer [CP-MeO-PEG16 HDT + Na]+, the theoretical mass value is 1215.585 Da, while the observed mass value was 1215.617 Da with an increase of only +0.032 Da from the theoretical value.

Figure 14: MALDI-ToF mass spectrum of sample 8, CP MeO-PEG-400 HDT. Zoom in from 1165-1254 Da shows cyclic 2-mer comb polymer products with different amounts of PEG repeat units attached and varying degrees of thioether oxidation. Please click here to view a larger version of this figure.
Oxidation can be confirmed further by performing a counter-ion study. This entails using a different ionizing cation, such as K+, and comparing the shift of the peaks in the MALDI-ToF MS spectra. A sample of CP MeO-PEG-400 HDT was run on the MALDI-ToF MS using KTFA rather than NaTFA (Figure 15). This shifts all the masses of the peaks up by +15.9739 Da due to the mass difference between Na+ and K+. For the analysis with the K+ adduct, no unoxidized polymer (1183.574 DaTheo) was present in the MALDI-ToF MS spectra. For the single oxidation of the 2-mer [CP-MeO-PEG16 HDT + K]+ the theoretical mass value is 1199.569 Da while the observed mass value was 1199.567 Da (only -0.002 Da), for the double oxidation of the 2-mer [CP-MeO-PEG16 HDT + K]+ the theoretical mass value is 1215.564 Da while the observed mass value was 1215.572 Da spanning a difference (only +0.008 Da), for the triple oxidation of the 2-mer [CP-MeO-PEG16 HDT + K]+ the theoretical mass value is 1231.558 Da while the observed mass value was 1231.563 Da (only +0.005 Da), and for the newly formed quadruple oxidation of the 2-mer [CP-MeO-PEG16 HDT + K]+ the theoretical mass value is 1247.553 Da while the observed mass value was 1247.551 Da (only -0.002 Da). It should be noted that the polymers oxidized further between running the Na+ and K+ adducts, resulting in the loss of the unoxidized product and the formation of the quadruple oxidation of the CP MeO-PEG-400 HDT. It can also be noted that while the polymer does indeed fly with both Na+ and K+ adducts, the signal-to-noise is significantly higher for the Na+ adducts accentuating the option to use Na+ for the primary characterization.
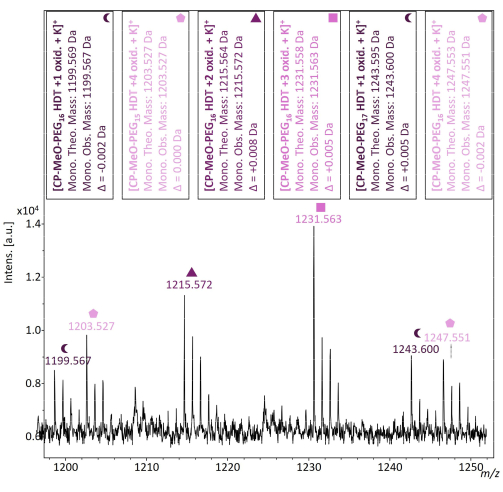
Figure 15: MALDI-ToF mass spectrum of sample 8, CP MeO-PEG-400 HDT. Zoom-in from 1195-1254 Da shows cyclic 2-mer comb polymer products with different amounts of PEG repeat units attached and varying degrees of thioether oxidation. Please click here to view a larger version of this figure.
Discussion
MALDI-ToF MS is a highly effective technique for the characterization of synthetic polymers, offering precise measurements with minimal fragmentation due to its soft ionization mechanism. In this method, the matrix absorbs energy from a laser and transfers it to the analyte26. This energy causes the polymer to vaporize, ionize through interaction with a cationization agent, and desorb into a vacuum. The ionized analytes travel through the flight tube, where they are detected based on their mass-to-charge ratio (m/z)26,27. This method is suitable for determining the mass of monodisperse molecules and is equally effective for moderately disperse (Đ = 1.1-1.3) and highly disperse polymers, where repeat unit mass and end-groups can be determined. For moderately disperse polymers, MALDI-ToF MS also provides dispersity (Ð), number-average molecular weight (Mn), and weight-average molecular weight (Mw).
However, several limitations of the technique should be noted. MALDI-ToF MS exhibits a low-mass bias when analyzing polymers with high dispersity (Đ > 1.3), meaning that lower mass polymers in the distribution dominate the spectrum while higher-mass species are low intensity peaks or absent28,29. Additionally, resolution decreases significantly for polymers above 10,000 Da, and polymers exceeding 15,000 Da could be better analyzed in linear mode. However, linear mode sacrifices isotopic peak resolution compared to the reflector mode. Furthermore, MALDI-ToF MS relies on the ability of the polymer to ionize effectively. Polymers with conjugated systems or heteroatoms ionize more readily than saturated hydrocarbons like polyethylene or polypropylene, which often require chemical modifications to ionize30,31.
Sample preparation is a crucial step for achieving successful results. One of the most important aspects is selecting the appropriate matrix for the polymer analyte11,32. For example, matrices like DCTB and GFR work well for non-polar polymers, while DHB and CHCA can be compared for polar polymers to identify which matrix provides the most resolved peaks. Additionally, choosing an appropriate solvent for dissolving both the matrix and the analyte ensures proper co-crystallization, which enhances laser ablation and improves resolution in the resulting MALDI-ToF MS spectra33,34,35. Similarly, choosing the appropriate cationization agent is essential for maximizing ionization efficiency and producing clear, distinguishable peaks.
Once the matrix and cationization agent have been selected, the matrix:analyte:cation ratio can be optimized. Begin by preparing stock solutions of the selected cation (1 mg/mL in THF), analyte (5 mg/mL in THF), and matrix (20 mg/mL in THF). A starting volume ratio of 1:5:20 µL (cation:analyte:matrix) is recommended, corresponding to concentration ratios of approximately 1:25:400 mg/mL in a total volume of 26 µL. If this initial mixture does not yield well-resolved spectra, a systematic optimization can be performed using a grid-based approach (Table 2)10,16. In this setup, the analyte volume is fixed, while the matrix volume is incrementally multiplied by 4 across the columns, and the cation volume is multiplied by 4 up the rows. This grid allows users to identify the optimal ratio for ionization and resolution. If one of the outer grid conditions provides improved performance, a new grid can be generated centered on that ratio, continuing the multiple of 4 adjustments for further refinement. A good starting point is to assess whether the spectrum contains high-intensity peaks, low baseline noise, and well-resolved isotopic resolution. This process can be time-consuming, particularly for novel or complex polymers that may require testing several matrices and cations in a 3 x 3 preparation grid.
Table 2: Systematic grid of experimental ratios can be created and tested. A 1:5:20 µL ratio of cation, analyte, and matrix, respectively, will be used to start (1:25:400 mg/mL) cation:analyte:matrix for a total of 26 mL. The analyte volume is fixed at 5 µL (25 mg/mL). The matrix and cation ratio are incrementally multiplied by 4 across the columns and up the rows, respectively. Please click here to download this Table.
Following sample application to the MALDI-ToF MS target plate, using the dried droplet method, the MALDI-ToF MS plate is then loaded into the MALDI-ToF MS instrument. MALDI-ToF MS data acquisition parameters, such as laser power, laser beam diameter, detector gain, and pulse ion extraction, can be fine-tuned to achieve higher resolution and clearer peak separation. These can be changed systematically to determine the peak intensity, lower the baseline noise, and improve the peak resolution (Figure 1).
Optimization of instrumental parameters and sample preparation ratios does not follow a strictly linear workflow. Operators may begin with a preferred sample preparation method and screen in linear mode to assess whether the polymer ionizes, or they may first fine-tune the instrument method (e.g., laser power, pulse extraction) before modifying the sample mixture ratios using the 3 x 3 preparation grid. Flexibility in workflow is often necessary, especially when analyzing new, unknown, or poorly characterized materials.
Once optimization is complete, a sample preparation protocol can be reused, though slight inter-operator or inter-day variability may still occur. Performing a calibration for each acquisition run minimizes variation, and differences in peak mass typically remain below 0.1 Da when consistent protocols are followed. Therefore, reproducibility across users and days is achievable if both the instrument method and sample preparation remain the same. If issues continue to persist, a table with common problems a user may experience, and solutions is provided in Table 3.
Table 3: Common problems and troubleshooting strategies based on practical experience. The table assists with issues encountered during sample preparation, data acquisition, and data analysis. For instrument-specific troubleshooting, consult the MALDI-ToF MS manufacturer's manual or a qualified technician. Please click here to download this Table.
Calibration is a critical step to ensure the accuracy of mass measurements. Both external and internal calibrations can be employed, but it is vital that the calibrants used fall within the mass range of the polymer analyte. Proper calibration ensures that the mass of the analyte is correctly determined.
Data analysis is performed where the MALDI-ToF MS mass spectrum is opened, and peak picking can be selected for further analysis. The mass of monodisperse macromolecules, as well as low, moderate, and highly disperse polymers of a specified n-mer, can be confirmed by comparing the observed mass with theoretical values calculated using chemical drawing software. These comparisons help verify the total mass of a monodisperse macromolecule or, in the case of low, moderate, and highly disperse polymers of a specified n-mer, the end-groups are identified and the repeat unit mass is confirmed.
In summary, optimizing the matrix, cationization conditions, and experimental ratios is critical to achieving high-resolution MALDI-ToF MS data. Calibration ensures accurate mass measurements. Data analysis using peak picking and theoretical mass comparison allows for thorough characterization of the polymer, including the identification of end-groups and the repeat unit mass. This technique can be used for monodisperse macromolecules, plus lowly disperse, moderately disperse, and highly disperse synthetic polymers. Future directions include expanding the characterization of complex polymer architectures such as polymer thin film blends, cyclic polymers, and hyperbranched polymers through solvent-free sample preparation methods and tandem mass spectrometry (MS/MS)36,37,38. Instrument combinations, such as using size exclusion chromatography (SEC) to fractionate a sample, followed by MALDI-ToF MS for structural analysis, can be used to identify low-mass structures, determine fractional dispersity, and characterize end groups in highly disperse polymer samples39,40,41. Additionally, new data analysis approaches, including manual input or software-assisted generation of Kendrick mass defect plots, allow conversion of mass spectra into two-dimensional maps, facilitating the identification of multiple end groups within a sample2,42.
Disclosures
The authors have financial interests in the dendritic calibrants used in this study.
Acknowledgements
We thankfully acknowledge the support of the ACS-Petroleum Research Fund 66398-ND7, the Boyer Professorship, and Tulane University. We have additionally received a newer MALDI-ToF MS through NSF MRI 2319960.
Materials
| Name | Company | Catalog Number | Comments |
|---|---|---|---|
| 1-(3-Dimethylaminopropyl)-3-ethylcarbodiimide Hydrochloride | TCI chemicals | D1601 | https://www.tcichemicals.com/US/en/p/D1601 |
| 1,1,1-Tris(hydroxymethyl)propane | Millipore Sigma | 148083 | https://www.sigmaaldrich.com/US/en/product/aldrich/148083?srsltid=AfmBOoqaMzcy1xravp1h2QE 0myfY5gjuEBfOIv2o882Wb _xcB4Ol4CMW |
| 1,5,7-Triazabicyclo[4.4.0]dec-5-ene | Millipore Sigma | 345571 | https://www.sigmaaldrich.com/US/en/product/aldrich/345571?srsltid=AfmBOooLQXIhWaMnO63nE xu-Y5MJoJID6RJiby0NXyu DHOxXYjle_kMT |
| 1,6-Hexanedithiol 98% (HDT) | TCI | H0334 | https://www.tcichemicals.com/US/en/p/H0334 |
| 2-(4-hydroxyphenylazo)benzoic acid) (HABA) | Millipore Sigma | H5126 | https://www.sigmaaldrich.com/US/en/product/aldrich/h5126 |
| 2,2-Bis(hydroxymethyl)propionic acid | Millipore Sigma | 106615 | https://www.sigmaaldrich.com/US/en/product/aldrich/106615?srsltid=AfmBOopCRoa1N_UiDK 56NKhDKdlAN8feUrMxVYhul Muz2en6NYEGIh4b |
| 2,2-Dimethoxy-2-phenylacetophenone 99% (DMPA) | Sigma-Aldrich | 196118 | https://www.sigmaaldrich.com/US/en/product/aldrich/196118?srsltid=AfmBOoqVTif6KNwIr6A -bIgnXbkrvWKIUNH6qOsc RseQLNVKi0DMWPb- |
| 2,5-Dihydroxybenzoic acid (DHB) | Millipore Sigma | 149357 | https://www.sigmaaldrich.com/US/en/product/aldrich/149357 |
| 4-(Dimethylamino)pyridine | Millipore Sigma | 522821 | https://www.sigmaaldrich.com/US/en/search/522821?focus=products&page=1&perpage= 30&sort=relevance&term=522821 &type=product |
| 6-Bromohexanoic acid | Millipore Sigma | 150452 | https://www.sigmaaldrich.com/US/en/search/6-bromohexanoic-acid?focus=products&page=1 &perpage=30&sort=relevance&term= 6-Bromohexanoic%20acid&type=product |
| Benzaldehyde dimethyl acetal | Millipore Sigma | 226076 | https://www.sigmaaldrich.com/US/en/product/aldrich/226076?srsltid= AfmBOorbjP7zD9MO3g5Xk LL3rNZ02PhfkXoRfe3EjRK7 TrqJ-kEOrTCN |
| Benzoic acid | Millipore Sigma | 242381 | https://www.sigmaaldrich.com/US/en/product/sial/242381?srsltid=AfmBOook_iIcMnwuB3e _j-KetQyyHJ6Qq86jSK8 ZVxC3BorQgkO8Xg5I |
| Bruker UltraFlextreme | Bruker Daltonics | https://www.bruker.com/en/products-and-solutions/mass-spectrometry/maldi-tof/ultraflextreme.html | |
| Chloroform | Fisher Scientific | AA32614K7 | https://www.fishersci.com/shop/products/chloroform-acs-99-8-thermo-scientific/AA32614K7 ?searchHijack=true&searchTerm= chloroform-acs-99-8-thermo-scientific &searchType=Rapid&matchedCatNo =AA32614M6 |
| Dithranol, BP, 98.5-101% (DT) | Fisher Scientific | 18-602-270 | https://www.fishersci.com/shop/products/dithranol-bp-98-5-101-spectrum-chemical/18602270 |
| Ethylene brassylate | Millipore Sigma | W354309 | https://www.sigmaaldrich.com/US/en/product/aldrich/w354309?utm_source=google&utm_medium= cpc&utm_campaign=8692675663&utm _content=86098110623&gad_source= 1&gclid=CjwKCAiApY-7BhBjEiwAQMr rEdJTcKN5TEFkP1uHvRlVign3lwg2cj5 _spBUCrfi6exZ3Ur5sJkARxoCfWsQ AvD_BwE |
| Galvinoxyl, free radical | Millipore Sigma | G307 | https://www.sigmaaldrich.com/US/en/product/aldrich/g307?srsltid= AfmBOopoWGDMXtLk5Erf0rVyl 7j442uyg8rIWkfBjhHZ2z0dDktH3y8- |
| Methanol | Fisher Scientific | A456 | https://www.fishersci.com/shop/products/methanol-optima-lc-ms-grade-thermo-scientific/A4564 |
| Palladium, 10% on carbon, Type 487, dry | Fisher Scientific | AAA1201206 | https://www.fishersci.com/shop/products/palladium-10-carbon-type-487-dry-thermo-scientific-1/AAA1201206#?keyword=palladium%20on%20carbon |
| Poly(ethylene glycol) monomethyl ether 350 Mn (MeO-PEG-OH 360) | Fisher Scientific | AA4156022 | https://www.fishersci.com/shop/products/polyethylene-glycol-monomethylether-350-thermo-scientific/AA4156022 |
| Potassium Trifluoroacetate (KTFA) | Millipore Sigma | 281883 | https://www.sigmaaldrich.com/US/en/product/aldrich/281883 |
| Propargyl alcohol | Fisher Scientific | A10295.0F | https://www.thermofisher.com/order/catalog/product/A10295.0F?SID=srch-hj-A10295.0F |
| Propargyl bromide 97% (80% w/w in toluene stabilized with MgO) | Fisher Scientific | AAL1059514 | https://www.fishersci.com/shop/products/propargyl-bromide-97-80-w-w-toluene-stab-magnesium-oxide-thermo-scientific/AAL1059514#?keyword=Propargyl%20bromide%2097%%20(80%%20w/w%20in%20toluene%20stabilized%20with%20MgO) |
| Sodium azide | Millipore Sigma | S2002 | https://www.sigmaaldrich.com/US/en/product/sial/s2002 |
| Sodium hydride 60% dispersion in mineral oil | Millipore Sigma | 452912 | https://www.sigmaaldrich.com/US/en/product/aldrich/452912?srsltid= AfmBOooZhbCm_qtgKU99922Y91zI qEOWONlEGxjZn0mdSJF2L5hW1uVn |
| Sodium Trifluoroacetate (NaTFA) | Oakwood | MFCD00013217 | https://www.oakwoodchemical.com/ProductsList.aspx?CategoryID=-2&txt Search=1549&ExtHyperLink=1 |
| SpheriCal Neat Low Range Kit (250 - 7,500 Da) | Polymer Factory | PFS-104 | https://www.polymerfactory.com/product-page/spherical-low-range-kit-500-7-500-da |
| Tetrahydrofuran (THF) | Fisher Scientific | T427 | https://www.fishersci.com/shop/products/tetrahydrofuran-optima-fisher-chemical-3/T4274#?keyword=tetrahydrofuran%20optima |
| trans-2-[3-(4-tert-Butylphenyl)-2-methyl-2-propenylidene]malononitrile (DCTB) | TCI | B3635 | https://www.tcichemicals.com/US/en/p/B3635 |
| α-Cyano-4-hydroxycinnamic Acid (CHCA) | TCI | C1768 | https://www.tcichemicals.com/US/en/p/C1768 |
References
- Mautjana, N. A., Pasch, H. Matrix-assisted laser desorption ionization mass spectrometry of synthetic polymers. Macromol Symp. 313-314 (1), 157-161 (2012).
- Bin Sun, A., Li, S., Kou, X. Applications of MALDI-TOF-MS in structural characterization of synthetic polymers. Anal Meth. 15 (7), 868-883 (2023).
- Hanton, S. D. Mass spectrometry of polymers and polymer surfaces. Chem Rev. 101 (2), 527-569 (2001).
- Weidner, S. M., Trimpin, S. Mass spectrometry of synthetic polymers. Anal Chem. 82 (12), 4811-4829 (2010).
- Cortez, M. A., Grayson, S. M. Application of time-dependent MALDI-TOF mass spectral analysis to elucidate chain transfer mechanism during cationic polymerization of oxazoline monomers containing thioethers. Macromolecules. 44 (6), 10152-10156 (2011).
- Li, Y., Hoskins, J. N., Sreerama, S. G., Grayson, M. A., Grayson, S. M. The identification of synthetic homopolymer end groups and verification of their transformations using MALDI-TOFmass spectrometry. J Mass Spectrom. 45 (6), 587-611 (2010).
- Redding, M. J., Grayson, S. M., Charles, L. Mass spectrometry of dendrimers. Mass Spectrom Rev. , 1-33 (2024).
- Montaudo, G., Montaudo, M. S., Puglisi, C., Samperi, F. Characterization of polymers by matrix-assisted laser desorption/ionization time-of-flight mass spectrometry: Molecular weight estimates in samples of varying polydispersity. Rapid Comm Mass Spectrom. 9 (5), 453-460 (1995).
- Curole, B. J., Broussard, W. J., Nadeem, A., Grayson, S. M. Dithiol-yne Polymerization: Comb Polymers with Poly(ethylene glycol) Side chains. ACS Polymers Au. 3 (1), 70-81 (2023).
- Wang, Z., Zhang, Q., Shen, H., Yang, P., Zhou, X. Optimized MALDI-TOF MS Strategy for Characterizing Polymers. Front Chem. 9, 2296-2646 (2021).
- Macha, S. F., Limbach, P. A., Savickas, P. J. Application of nonpolar matrices for the analysis of low molecular weight nonpolar synthetic polymers by matrix-assisted laser desorption/ionization time-of-flight mass spectrometry. J Am Soc Mass Spectrom. 11 (8), 731-737 (2000).
- Wyatt, M. F., Stein, B. K., Brenton, A. G. Characterization of various analytes using matrix-assisted laser desorption/ionization time-of-flight mass spectrometry and 2-[(2E)-3-(4-tert- butylphenyl)-2-methylprop-2-enylidene]malononitrile matrix. Anal Chem. 78 (1), 199-206 (2006).
- De Winter, J., et al. MALDI-ToF analysis of polythiophene: Use of trans-2-[3-(4-t-butyl-phenyl)- 2-methyl-2-propenylidene]malononitrile - DCTB - as matrix. J Mass Spectrom. 46 (3), 237-246 (2011).
- Gabriel, S. J., et al. Improved analysis of ultra-high molecular mass polystyrenes in matrix-assisted laser desorption/ionization time-of-flight mass spectrometry using DCTB matrix and caesium salts. Rapid Comm Mass Spectrom. 29 (11), 1039-1046 (2015).
- Schlosser, G., et al. Matrix/analyte ratio influencing polymer molecular weight distribution in matrix-assisted laser desorption/ionization time-of-flight mass spectrometry. Rapid Comm Mass Spectrom. 23 (9), 1249-1254 (2009).
- Payne, M. E., Grayson, S. M. Characterization of synthetic polymers via matrix assisted laser desorption ionization time of flight (MALDI-TOF) mass spectrometry. J Vis Exp. (136), e57174(2018).
- Räder, H. J., Sclirepp, I. K. MALDI-TOF mass spectrometry in the analysis of synthetic polymers. Acta Polymerica. 49 (6), 253-318 (1998).
- Mamyrin, B. A., Karataev, V. I., Shmikk, D. V., Zagulin, V. A. The mass-reflectron, a new nonmagnetic time-of-flight mass spectrometer with high resolution. Sov Phys JETP. 37 (1), 45-48 (1973).
- Kaufmann, R., Spengler, B., Lützenkirchen, F. Mass spectrometric sequencing of linear peptides by product-ion analysis in a reflectron time-of-flight mass spectrometer using matrix-assisted laser desorption ionization. Rapid Comm Mass Spectrom. 7 (10), 902-910 (1993).
- Hoskins, J. N., Grayson, S. M. Synthesis and Degradation Behavior of Cyclic Poly(ε-caprolactone). Macromolecules. 42 (17), 6406-6413 (2009).
- Li, Y., Hoskins, J. N., Sreerama, S. G., Grayson, S. M. MALDI-TOF mass spectral characterization of polymers containing an azide group: Evidence of metastable ions. Macromolecules. 43 (14), 6225-6228 (2010).
- Wetzel, S. J., Guttman, C. M., Girard, J. E. The influence of matrix and laser energy on the molecular mass distribution of synthetic polymers obtained by MALDI-TOF-MS. Int J Mass Spectrom. 238 (3 SPEC. ISS), 215-225 (2004).
- Grayson, S. M., Myers, B. K., Bengtsson, J., Malkoch, M. Advantages of monodisperse and chemically robust “spherical” polyester dendrimers as a “universal MS Calibrant. J Am Soc Mass Spectrom. 25 (3), 303-309 (2014).
- Xiang, B., Prado, M. An accurate and clean calibration method for MALDI-MS. J Biomol Tech. 21 (3), 116-119 (2010).
- Kovtoun, S. V., Cotter, R. J. Mass-correlated pulsed extraction: Theoretical analysis and implementation with a linear matrix-assisted laser desorption/ionization time of flight mass spectrometer. J Am Soc Mass Spectrom. 11 (10), 841-853 (2000).
- Montaudo, G., Samperi, F., Montaudo, M. S. Characterization of synthetic polymers by MALDI-MS. Prog Poly Sci. 31 (3), 277-357 (2006).
- Wesdemiotis, C., Williams-Pavlantos, K. N., Keating, A. R., McGee, A. S., Bochenek, C. Mass spectrometry of polymers: A tutorial review. Mass Spectrom Rev. 43 (3), 427-476 (2024).
- Byrd, H. C. M., McEwen, C. N. The limitations of MALDI-TOF mass spectrometry in the analysis of wide polydisperse polymers. Anal Chem. 72 (19), 4568-4576 (2000).
- McEwen, C. N., Jackson, C., Larsen, B. S. Instrumental effects in the analysis of polymers of wide polydispersity by MALDI mass spectrometry. Int J Mass Spectrom Ion Proc. 160 (1-3), 387-394 (1997).
- Lin-Gibson, S., et al. Optimizing the covalent cationization method for the mass spectrometry of polyolefins. Macromolecules. 35 (18), 7149-7156 (2002).
- Ji, H., et al. Characterization of polyisobutylene by matrix-assisted laser desorption ionization time-of-flight mass spectrometry. Macromolecules. 35 (4), 1196-1199 (2002).
- Meier, M. A. R., Adams, N., Schubert, U. S. Statistical approach to understand MALDI-TOFMS matrices: Discovery and evaluation of new MALDI matrices. Anal Chem. 79 (3), 863-869 (2007).
- Wu, T., et al. Solvent effect in polymer analysis by MALDI-TOF mass spectrometry. Int J Poly Anal Characterizat. 22 (2), 160-168 (2017).
- Chen, H., Guo, B. Use of Binary Solvent Systems in the MALDI-TOF Analysis of Poly(methyl methacrylate). Anal Chem. 69 (21), 4399-4404 (1997).
- Yalcin, T., Dai, Y., Li, L. Matrix-assisted laser desorption/ionization time-of-flight mass spectrometry for polymer analysis: Solvent effect in sample preparation. J Am Soc Mass Spectrom. 9 (12), 1303-1310 (1998).
- Wang, S. F., Li, X., Agapov, R. L., Wesdemiotis, C., Foster, M. D. Probing surface concentration of cyclic/linear blend films using surface layer MALDI-TOF mass spectrometry. ACS Macro Lett. 1 (8), 1024-1027 (2012).
- Hanton, S. D., Parees, D. M. Extending the solvent-free MALDI sample preparation method. J Am Soc Mass Spectrom. 16 (1), 90-93 (2005).
- Williams-Pavlantos, K., Wesdemiotis, C. Advances in solvent-free sample preparation methods for matrix-assisted laser desorption/ionization mass spectrometry (MALDI-MS) of polymers and biomolecules. Adv Sample Prep. 7, 100088(2023).
- Veloso, A., Leal, G. P., Agirre, A., Leiza, J. R. Combining SEC & MALDI for characterization of the continuous phase in dispersion polymerization. Eur Poly J. 105, 265-273 (2018).
- Esser, E., Keil, C., Braun, D., Montag, P., Pasch, H. Matrix-assisted laser desorption/ionization mass spectrometry of synthetic polymers. 4. Coupling of size exclusion chromatography and MALDI- TOF using a spray-deposition interface. Polymer. 41 (11), 4039-4046 (2000).
- Crotty, S., Gerişlioğlu, S., Endres, K. J., Wesdemiotis, C., Schubert, U. S. Polymer architectures via mass spectrometry and hyphenated techniques: A review. Anal Chim Acta. 932, 1-21 (2016).
- Fouquet, T., Sato, H. Extension of the Kendrick Mass Defect Analysis of Homopolymers to Low Resolution and High Mass Range Mass Spectra Using Fractional Base Units. Anal Chem. 89 (5), 2682-2686 (2017).
Reprints and Permissions
