Plasmodium sexual development occurs in the mosquito midgut. Targeting the parasite's sexual stages is a promising strategy to block transmission. We developed Ookluc, a transgenic P. berghei expressing nanoluciferase after zygote formation, enabling high-throughput screening of transmission-blocking compounds. This article details the methods for screening using Ookluc.
A subscription to JoVE is required to view this content. Sign in or start your free trial.
Method Article
Ookluc: A Plasmodium berghei Line for Identifying Transmission-blocking Compounds
In This Article
Summary
Abstract
Malaria remains a world health challenge; in 2023, 263 million cases and 597,000 deaths were reported around the globe. The parasite's life cycle is complex, and targeted interventions at critical developmental stages are needed to effectively control the disease. Transmission-blocking (TB) strategies aim to interrupt Plasmodium transmission by targeting either the mosquito vector or the parasite's sexual stages through vaccines and drugs. TB interventions can focus on gametocytes in the human host or other forms in the mosquito midgut, such as gametes, zygotes, ookinetes, and oocysts.
The development of new TB approaches faces significant challenges. Studying the parasite's sexual stages is inherently difficult, and high-throughput screening (HTS) for gametocytocidal compounds relies primarily on P. falciparum cultures. However, robust in vitro tools for assessing interventions against later sexual stages remain limited. To accelerate the discovery of TB compounds, our group developed a novel HTS assay for gametocyte activation and fertilization using P. berghei, a murine model of Plasmodium infection. The transgenic parasite, Ookluc, expresses nanoluciferase exclusively after zygote formation, with peak luminescence during ookinete development. This luminescence-based assay provides a quantitative readout of gamete to zygote and zygote to ookinete differentiation, where increased luminescence directly correlates with ookinete formation. This video article presents the methods for screening malaria TB compounds using Ookluc.
Introduction
Malaria is an ancient disease that has profoundly shaped human history. In 2023 alone, 263 million cases were reported across 85 endemic countries, resulting in 597,000 deaths1. The disease is caused by protozoan parasites of the genus Plasmodium, belonging to the phylum Apicomplexa. Among the five species that infect humans -- P. falciparum, P. vivax, P. knowlesi, P. ovale, and P. malariae -- P. falciparum and P. vivax account for the majority of cases. P. falciparum is associated with severe malaria and is predominant in Africa, whereas P. vivax has the widest geographic distribution, being more prevalent in South America and Asia2.
The complexity of the Plasmodium life cycle, which involves multiple developmental stages across two hosts, facilitates its transmission and persistence in endemic regions3. A critical step in this cycle is the transition from humans to the mosquito vector, making it a key target for intervention. Transmission begins within the human host, where Plasmodium sexual stages develop as merozoites differentiate into male and female gametocytes. Upon ingestion by a mosquito, environmental cues trigger gametocyte activation and gamete formation, leading to fertilization in the midgut lumen. The resulting zygote differentiates into a motile ookinete, which actively invades the midgut epithelium and develops into an oocyst within the basal lamina. Inside the oocyst, thousands of sporozoites are generated and subsequently released into the hemolymph, allowing them to migrate to the salivary glands. There, sporozoites invade the acinar cells and move into the gland lumen, where they remain until the mosquito takes its next blood meal, transmitting the parasite to the human skin4.
The search for new transmission-blocking (TB) strategies is critical given the limitations of available drugs and the increasing resistance to antimalarials5. Traditional screening methods-such as mosquito infections, manual microscopic analysis, or radioactive hypoxanthine incorporation-are labor-intensive, difficult to standardize, and unsuitable for high-throughput applications6,7. More recent approaches using fluorescence-based detection (e.g., DNA staining or GFP reporters) have improved efficiency, yet significant challenges remain in assessing compounds that target the parasite's sexual stages6,7,8.
To address these challenges, a transgenic P. berghei line expressing nanoluciferase (nLuc), termed Ookluc, was developed8. In this system, the nLuc gene is placed under the control of the ookinete-specific P. berghei Circumsporozoite- and TRAP-related protein (CTRP) promoter, which is activated in zygotes, leading to nLuc production beginning approximately 6 h after gamete activation and peaking 24 h after the conversion assay8. This design enables automated, luminescence-based quantification of parasite viability shortly after fertilization -- eliminating the need for direct vector manipulation -- and facilitates high-throughput screening of thousands of compounds8.
Although nLuc expression occurs regardless of ookinete viability, limiting the detection of compounds that specifically affect later stages such as ookinete morphogenesis, Ookluc remains highly effective for identifying TB compounds that target gametogenesis, sexual recombination, or parasite survival within the mosquito, including agents that induce reactive oxygen species production. Previous studies have validated this system by successfully identifying compounds known to inhibit Plasmodium sexual stages9,10,11,12,13,14,15. Thus, Ookluc represents a robust and innovative platform for high-throughput screening of Plasmodium sexual stages, facilitating the discovery of novel TB compounds and advancing efforts toward malaria elimination in the coming years8. This protocol outlines the application of the Ookluc system for drug screening and inhibitory concentration 50% (IC50) determination.
Access restricted. Please log in or start a trial to view this content.
Protocol
All animal experiments were conducted in strict accordance with ethical guidelines and were approved by the Ethics Committee on Animal Use of the Institute of Biomedical Sciences, University of São Paulo (CEUA-ICB/USP). Animals were housed and maintained in compliance with the standards established by this committee. Experiments involving genetically modified Plasmodium parasites, as well as their cryopreserved storage at -80 °C, were conducted in compliance with the regulations established by the Institutional Biosafety Committee of the Institute of Biomedical Sciences, University of São Paulo (CIBio-ICB/USP). A total of three female BALB/c mice, aged 3-5 weeks, were used in this study-two infected and one uninfected.
1. Materials and reagents
- Prepare the ookinete medium by supplementing RPMI 1640 with 0.025 M HEPES, penicillin-streptomycin-neomycin (PSN), 50 mg/L hypoxanthine, and 100 µM xanthurenic acid. Adjust the pH to 8.38,16.
- Prepare the working solution for the luminescence assay by mixing 1 volume of substrate with 50 volumes of the lysis buffer provided in the luciferase assay system.
- Set an incubator to 21 °C.
2. Infection and parasitized blood collection
- Infect two female BALB/c mice (4-6 weeks old) with 150 µL of cryopreserved Ookluc strain via intraperitoneal (IP) injection (Day 0).
NOTE: In this protocol, we recommend the use of BALB/c mice due to their ready availability and widespread use in animal facilities. However, any wild-type mouse strain that is susceptible to P. berghei infection and supports gametocytogenesis should be suitable for use. - Starting on Day 3, assess parasitemia and gametocytemia by microscopic examination of Giemsa-stained blood smears.
- When parasitemia and gametocytemia reach approximately 5% and 0.5%, respectively (usually on Day 4), collect blood via cardiac puncture using heparinized syringes and pool the blood from both infected mice.
NOTE: Although this is a transgenic line of P. berghei, its growth and gametocytemia profile are similar to those observed in the ANKA strain. In this context, the proportion of gametocytes relative to total parasitemia is approximately 10x lower.
NOTE: Ideally, the compound plate (see below) is prepared before the collection of parasitized blood, so the blood is pipetted to the plate immediately after collection. If the mouse blood must be collected in a different room, or it cannot be immediately pipetted to the compound plate for any other reason, the collected blood must be kept at 37 °C for not more than 30 min.
3. Conversion assay - screening in 96-well plates
NOTE: To ensure consistent results, the entire experiment should be repeated three times on different days to confirm findings.
- Prepare the compound samples using ookinete medium as a diluent (a final concentration of 10 µM). Dilute the compound stock to 1 mM and prepare working samples by diluting the 1 mM stock 1:100 v:v in Ookinete Medium. For one assay in duplicate, prepare a final volume of 200 µL of working sample.
- If the compound is diluted in a solvent other than water, include a control sample containing the solvent diluted in ookinete medium at the same proportion as in the test sample to ensure that any observed inhibition is attributable to the compound and not the solvent.
NOTE: As an example, we will screen 90 compounds. - Using two 96-well plates, place 80 µL of the samples in each well, as follows and illustrated in Figure 1, in duplicate (two plates): Positive control: 80 µL of ookinete medium; Negative control: 80 µL of ookinete medium; Solvent control: 80 µL of ookinete medium with 1% DMSO; Samples: 80 µL of 10 µM of each compound in ookinete medium.
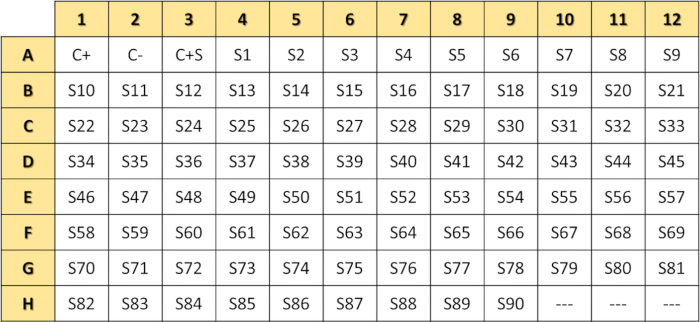
Figure 1: Schematic representation of a 96-well plate layout designed for compound screening. The plate layout includes positive control (C+), negative control (C-), control plus dilution solvent (C+S), and 90 test compounds (S1-S90). Please click here to view a larger version of this figure.
- Add 4 µL of parasitized mouse blood to each well of the 96-well plate at a 1:20 ratio v:v, except to the negative control (C-). Gently homogenize by pipetting.
NOTE: Considering losses, we calculate the need of ~400 µL of parasitized blood for each plate. - For the negative control, add non-infected mouse blood at a 1:20 ratio (v:v, blood:sample). Gently homogenize.
- Incubate at 21 °C for 6 h or 24 h.
NOTE: nLuc activity is detectable with 6 h of incubation and peaks at 24 h of the assay8. The assay is not capable of identifying compounds with activity after zygote formation, like compounds that inhibit ookinete morphogenesis, because formed zygotes will accumulate nLuc regardless of completing morphogenesis. Therefore, 6 h incubation is sufficient to detect all compounds that will block nLuc activity by inhibiting gametogenesis, sexual recombination, or have early cytotoxicity. However, we normally favor incubations of 24 h to have stronger signals and better signal-to-noise ratio.
4. Luminescence assay
- After the incubation period, homogenize samples by pipetting up and down to ensure thorough blood-medium mixing.
- Prepare the lysis buffer/luciferase substrate mixture immediately before use at a 1:50 ratio (v:v, substrate:lysis buffer).
- Mix the substrate mixture with samples at a 1:1 (v:v) ratio, ensuring gentle mixing to avoid bubbles. Incubate at 37 °C for 3-5 min.
NOTE: In this example, we added 84 µL of substrate:lysis buffer to each well. - Transfer samples to a 96-well white, flat-bottom plate. Measure luminescence using a plate reader. Use the following parameter configuration: emission filter: lens; measurement interval time: 1 s per well.
5. Data analysis - screening
- After the luminescence assay, make a note of the raw data that appear (Figure 2).
NOTE: The Relative Light Units (RLU) obtained depend on the luminometer used. In our case, RLU values for the positive control ranged from 10,000 to 500,000 in a 24 h incubation assay. Shorter incubation times (6 h) will result in lower RLU values.
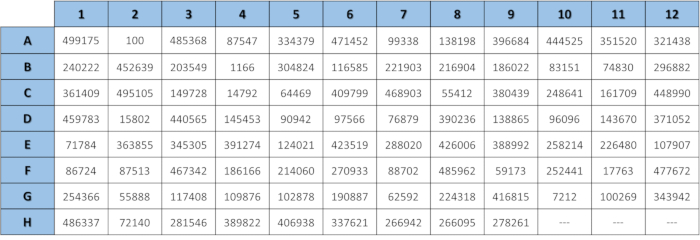
Figure 2: Results obtained from a simulated reading of a conversion assay for compound screening. The image displays simulated luminescence readings from an assay performed after the conversion of ookinetes in the presence of a panel of 90 compounds. Lower Relative Light Unit values indicate reduced ookinete formation. Please click here to view a larger version of this figure.
- Using a spreadsheet, calculate the mean of each measurement using the formula below. Replace XX with the address of the first measurement cell and YY with the address of the second measurement cell. Repeat the formula for all samples.
=(AVERAGE(XX:YY) - Convert the data into % inhibition for a better analysis of the results. In the spreadsheet, use the formula below. Replace A with the sample RLU value and B with the control RLU value. Repeat the formula for all tested compounds:
= 1 - (A/B) x 100
NOTE: The data will appear as shown in Figure 3.
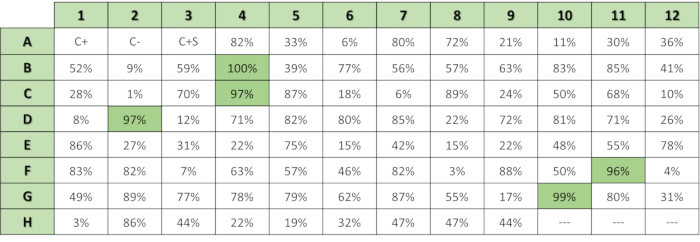
Figure 3: Results obtained from a simulated reading of a conversion assay for compound screening represented as % of inhibition for each compound. Percentage of inhibition of conversion for each tested compound, calculated as described above. The highlighted squares indicate compounds that promote more than 95% inhibition of conversion. Please click here to view a larger version of this figure.
- Identify the compounds that show more than 95% inhibition.
NOTE: These compounds exhibit high activity against sexual stages at 10 µM concentration. In our example, we found five compounds with high activity against sexual stages. - For the identified compounds, perform an IC50 determination as described below.
6. Conversion assay - determining IC 50
- Infect mice with Ookluc and collect parasitized blood, as described in section 2.
- Prepare the samples using ookinete medium as the diluent. Use an initial concentration at which 100% inhibition of conversion by the compound is observed.
NOTE: Since the active compounds were identified in a screen with 10 µM concentration, we use 20 µM as the initial concentration for the first dose-response curve. For an accurate dose-response curve, it is important that your assay includes initial concentrations that result in 100% inhibition of conversion and final concentrations that lead to 0% inhibition. This approach ensures a precise IC50 calculation. The first dose-response curve will inform the lowest concentrations of the compound with ~100% inhibition. In this protocol, we will use PyAz90, recently identified using Ookluc13, as an example. - In a 96-well plate, add in triplicate (see Figure 4): Positive control (C+): 80 µL of ookinete medium; Negative control (C-): 80 µL of ookinete medium; Sample first dilution (Cpd D1): 160 µL of compound at an initial concentration in ookinete medium that results in 100% inhibition of conversion; D2 to D12 wells: 80 µL of ookinete medium.
- Make two-fold serial dilutions by pipetting 80 µL of well D1 into D2, homogenize, and pipette 80 µL of well D2 into D3 and so on. Ensure that all wells have 80 µL of total volume, so discard the last 80 µL removed from well D12.
NOTE: Perform the experiment with at least three replicates for all samples, as indicated in Figure 4. To ensure the reliability and reproducibility of your results, the entire experiment should be repeated on three separate days using newly infected animals each time.
NOTE: If in the first screen, the results show no impact of the solvent in the conversion, it is not necessary to include these controls in serial dilutions. Otherwise, serial dilutions of the solvent must also be included.
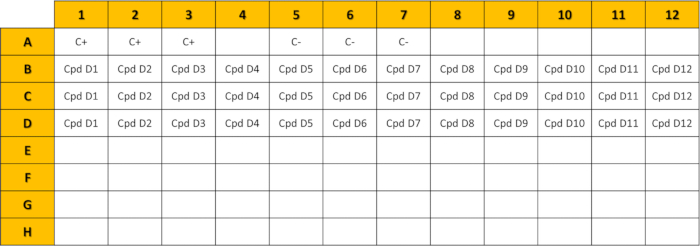
Figure 4: 96-well plate layout designed for compound IC50 determination. The plate layout includes positive control (C+), negative control (C-), and compound (Cpd) dilutions (D1 to D12). Please click here to view a larger version of this figure.
- Add parasitized mouse blood to the 96-well plate at a 1:20 v:v. Gently homogenize by pipetting.
NOTE: A total of 4 µL of parasitized blood will be added to each well, except to the negative control (C-). Considering losses, we calculate the need of ~200 µL of parasitized blood for each compound to be tested. - In negative control wells, add non-infected mouse blood at a 1:20 ratio (v:v, blood:sample). Gently homogenize.
- Incubate at 21 °C for 6 h or 24 h.
- Perform the luminescence assay, as described in section 4.
7. Data analysis - IC 50 determination
NOTE: IC50 is defined as the concentration of a compound required to inhibit 50% of biological activity/inhibition. In this assay, inhibition refers to the reduction in ookinete conversion. Data are represented as a sigmoidal dose-response curve, where the X-axis represents compound concentration (log-transformed) and the Y-axis represents % inhibition.
- Calculate % inhibition as described in section 5, step 5.3.
- Open the software and create an XY table.
- Set Y-axis options to Enter 3 replicate values in side-by-side subcolumns.
- Paste data, with X representing compound concentration and Y representing % inhibition (Figure 5A).
- In the menu bar, click on Analyze and select Nonlinear regression (curve fit) and then Dose-response curves - Inhibition and [inhibitor] vs. normalized response -- variable slope; click OK.
- In the left panel, observe the dose-response curve of the data. Apply the desired personalization, such as color changes and point formats.
- Locate the Nonlin fit table to find the calculated IC50 and 95% Confidence Interval (95% CI) (Figure 5B).
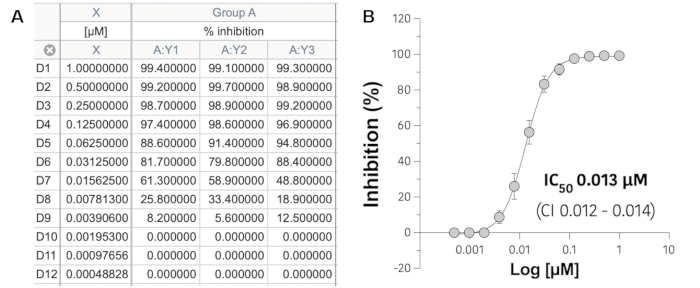
Figure 5: Dose-response curve of PyAz90. The % inhibition was measured as a function of PyAz90 concentration (µM) on a logarithmic scale. The sigmoidal curve represents the fitted data used to determine the IC50, which was 0.013 µM (95% confidence interval: 0.012-0.014 µM). Data points represent the mean ± standard error of the mean from experimental replicates. Please click here to view a larger version of this figure.
Access restricted. Please log in or start a trial to view this content.
Results
The generation of Ookluc parasites enables the evaluation of new TB drug candidates from a perspective not offered by existing assays, particularly in assessing the effects of compounds on gamete activation, fertilization, and zygote formation8. Figure 2 and Figure 3 illustrate the method's ability to screen a panel of compounds against the sexual stages of the parasite in a high-throughput ma...
Access restricted. Please log in or start a trial to view this content.
Discussion
Most HTS methods used to develop new TB compounds focus on gametocytogenesis inhibition or gametocytocidal activity. To date, only two P. berghei models have been developed that allow the assessment of gametocyte function, gametogenesis, zygote formation, and ookinete morphogenesis5.
One of these models is similar to Ookluc, as it utilizes a fluorescence reporter linked to the ctrp promoter17. However, Ookluc i...
Access restricted. Please log in or start a trial to view this content.
Disclosures
The authors have no conflicts of interest to disclose.
Acknowledgements
This project was supported by grants from the Fundação de Amparo à Pesquisa do Estado de São Paulo (FAPESP 2021/06769-0) and the Instituto Serrapilheira (grant G-1709-16618).
Access restricted. Please log in or start a trial to view this content.
Materials
| Name | Company | Catalog Number | Comments |
|---|---|---|---|
| Dimethyl Sulfoxide (DMSO) | Sigma-Aldrich | D8418 | |
| GraphPad Prism version 10.0.0 for Windows | GraphPad Software, Boston, Massachusetts, USA | ||
| Heparin sodium salt from porcine intestinal mucosa | Sigma-Aldrich | H3393 | |
| HEPES (1 M) | Thermo Scientific | 15630106 | |
| Hypoxanthine | Sigma-Aldrich | H9636 | |
| Mice | --- | --- | Female BALB/c mice, aged 3 to 5 weeks |
| Nano-Glo Luciferase Assay System | Promega | N1110 | |
| Penicillin − Streptomycin − Neomycin Solution Stabilized | Sigma-Aldrich | P4083 | |
| POLARStar Omega Microplate Reader | BMG Labtech | ---- | |
| RPMI 1640 Medium, GlutaMAX Supplement | Thermo Scientific | 61870036 | |
| Xanthurenic acid | Sigma-Aldrich | D120804 |
References
- World malaria report 2024: addressing inequity in the global malaria response. , World Health Organization. https://www.who.int/teams/global-malaria-programme/reports/world-malaria-report-2024 (2025).
- Miller, L. H., Ackerman, H. C., Su, X., Wellems, T. E. Malaria biology and disease pathogenesis: insights for new treatments. Nature Med. 19 (2), 156-167 (2013).
- Tsoumani, M. E., Voyiatzaki, C., Efstathiou, A. Malaria Vaccines: From the Past towards the mRNA Vaccine Era. Vaccines. 11 (9), 1452(2023).
- Ménard, R., et al. Looking under the skin: the first steps in malarial infection and immunity. Nature Rev. Microbiol. 11 (10), 701-712 (2013).
- Appetecchia, F., et al. Transmission-blocking strategies for malaria eradication: Recent advances in small-molecule drug development. Pharmaceuticals. 17 (7), 962(2024).
- Baniecki, M. L., Wirth, D. F., Clardy, J. High-throughput Plasmodium falciparum growth assay for malaria drug discovery. Antimicrob Agents Chemother. 51 (2), 716-723 (2007).
- Delves, M., et al. The activities of current antimalarial drugs on the life cycle stages of Plasmodium: A comparative study with human and rodent parasites. PLoS Med. 9 (2), e1001169(2012).
- Calit, J., et al. Screening the pathogen box for molecules active against Plasmodium sexual stages using a new nanoluciferase-based transgenic line of P. berghei identifies transmission-blocking compounds. Antimicrob Agents Chemother. 62 (11), e01053-e01118 (2018).
- Calit, J., et al. Novel transmission-blocking antimalarials identified by high-throughput screening of Plasmodium berghei Ookluc. Antimicrob Agents Chemother. 67 (4), e0146522(2023).
- Lima, M. N. N., et al. Integrative multi-kinase approach for the identification of potent antiplasmodial hits. Front Chem. 7, 773(2019).
- Ferreira, L. T., et al. Computational chemogenomics drug repositioning strategy enables the discovery of epirubicin as a new repurposed hit for Plasmodium falciparum and P. vivax. Antimicrob Agents Chemother. 64 (9), aac.02041-aac.02119 (2020).
- Krishnan, K., et al. Torin 2 derivative, NCATS-SM3710, has potent multistage antimalarial activity through inhibition of P. falciparum phosphatidylinositol 4-kinase (Pf ACS Pharmacol). Transl Sci. 3 (5), 948-964 (2020).
- Calit, J., et al. Pyrimidine azepine targets the Plasmodium bc1 complex and displays multistage antimalarial activity. JACS Au. 4 (10), 3942-3952 (2024).
- Lima, M. N., et al. Chalcones as a basis for computer-aided drug design: Innovative approaches to tackle malaria. Future Med Chem. 11 (20), 2635-2646 (2019).
- Ferreira, L. T., et al. A novel 4-aminoquinoline chemotype with multistage antimalarial activity and lack of cross-resistance with PfCRT and PfMDR1 mutants. PLoS Pathog. 20 (10), e1012627(2024).
- Blagborough, A. M., et al. Assessing transmission blockade in Plasmodium spp. Methods Mol Biol. 923, 577-600 (2013).
- Azevedo, R., et al. Bioluminescence method for in vitro screening of Plasmodium transmission-blocking compounds. Antimicrob Agents Chemother. 61 (6), aac.02699-aac.02616 (2017).
- Gaitán, X. A., et al. Characterisation of the merozoite thrombospondin related anonymous protein (MTRAP) of Plasmodium berghei as a transmission-blocking antigen. Mem Inst Oswaldo Cruz. , 119(2024).
Access restricted. Please log in or start a trial to view this content.
Reprints and Permissions
