This protocol integrates a custom-built bioreactor system with hyperpolarized ¹³C NMR spectroscopy to measure real-time pyruvate metabolism in live cells, improving reproducibility and kinetic accuracy for metabolic studies and drug screening applications.
Method Article
Real-Time Metabolic Detection in Living Cells Using Hyperpolarized 13C NMR
In This Article
Summary
Abstract
The protocol presents a method to integrate an in-house-built bioreactor system with hyperpolarized 13C nuclear magnetic resonance (NMR) spectroscopy to measure pyruvate metabolism in live cells in real time. The protocol outlines the construction of a bioreactor system that allows precise timing of hyperpolarized substrate injection and NMR signal acquisition while maintaining a stable cell culture environment. The method reliably detects the metabolic conversion of pyruvate to lactate within a 60 s measurement window while maintaining a sufficient signal-to-noise ratio throughout the process. The in situ mixing capability of the system accelerates NMR signal detection and reduces T1 relaxation losses. The protocol also includes detailed instructions for the preparation of alginate gels to encapsulate cells and place them within the bioreactor. The proposed method exhibits improved reproducibility and kinetic accuracy compared to conventional methods, indicating potential applications in cancer metabolism studies and drug screening. Further refinements of the system, such as the adoption of alternative gel matrices, may improve its versatility in various biological studies.
Introduction
Hyperpolarized NMR, particularly through dynamic nuclear polarization (DNP), significantly enhances NMR signal intensity1 and enables real-time tracking of metabolic changes with greatly improved sensitivity2,3. This technique has been successfully applied across various biological systems, including yeast4,5, cancer cell models6,7,8, and microorganisms9,10. It has also been used to monitor key metabolic pathways such as glycolysis11,12, redox homeostasis13,14, and pH regulation15,16. Beyond basic research, hyperpolarized NMR is now utilized in clinical imaging through MRI, allowing metabolic assessment from the cellular to whole-body scale17. These developments underscore the growing demand for accessible protocols that facilitate the broader use of hyperpolarized NMR across diverse biological contexts.
Despite its versatility, implementing real-time metabolic measurements in live cells using hyperpolarized NMR remains technically challenging. Conventional systems often rely on complex, lab-specific setups that lack reproducibility and are difficult to operate without extensive expertise8,18,19,20. This presents a major barrier to researchers aiming to adopt this technology for biological or translational research. Compared to alternative methods such as optical imaging or mass spectrometry, hyperpolarized 13C NMR allows non-invasive, time-resolved monitoring of specific metabolic reactions without destructive sampling. It provides direct biochemical information with temporal precision, making it well-suited for dynamic studies of cellular metabolism.
To address these limitations, this study presents a practical and reproducible protocol specifically designed to enable researchers to perform hyperpolarized NMR measurements of live-cell metabolism with minimal technical hurdles. A comprehensive method is described for the basic measurement of pyruvate metabolism in living cells. While this protocol can be applied to other 13C-labeled probes, pyruvate is particularly suitable due to its rapid cellular uptake, well-characterized metabolic pathways, and its central role in cellular metabolism. The procedure consists of: (i) preparation of cell samples, (ii) encapsulation in alginate gels, (iii) hyperpolarization using a DNP polarizer, and (iv) real-time 13C NMR measurement in a 400 MHz spectrometer (Figure 1). Additionally, key parameters for constructing the bioreactor system are provided to ensure reproducibility and compatibility with standard NMR hardware. The protocol is optimized for ease of implementation using commercially available components and is intended to help researchers, especially those new to the technique, determine its suitability for their experimental needs.
Protocol
1. Bioreactor setup (Figure 2A-B)
- Assembling the NMR Tube
- Use a screw-cap NMR tube (10 mm diameter, length 178 mm) with an open-top cap for tubing insertion.
- Prepare a silicone/PTFE vial septum (9 mm diameter) and insert a PEEK tube through it for tight sealing (Supplementary Figure 1).
- Insert the septum with chemically resistant PEEK tubing (inner diameter 1.0 mm, outer diameter 1.6 mm, wall thickness 0.3 mm, length 1 m) into the opening of the modified cap.
- Place the septum between the NMR tube and its open-top cap, and secure it by firmly closing the cap. This setup holds the septum in place and provides a sufficient seal to prevent leakage during perfusion or injection.
- Setting up medium delivery tubing (Figure 2C)
- Connect the PEEK tubing to the inlet and outlet ports of the NMR tube to enable continuous perfusion. Secure the connections using a flangeless fitting set to prevent leakage.
- Installing the medium warming components
- Connect the PEEK tubing to a peristaltic pump adjustable to a stable flow rate of approximately 0.2 mL/min, ensuring continuous medium circulation via an external circulation kit. Place the medium reservoir in a water bath set to 37 °C to maintain temperature.
- Adding gel leakage prevention component
- Cut a dense sponge to fit the NMR tube diameter. Insert the sponge into the bottom of the tube to prevent alginate gel leakage while allowing medium flow.
- Fabrication and insertion of the 3D-printed sponge-fixing component (Figure 2D-F)
- 3D print a cylindrical holder (outer diameter 9.1 mm, length 20 mm, with a central hole of 1.5 mm diameter) using a photopolymer resin compatible with stereolithographic 3D printing. The design specifications are provided in the attached Supplementary File 1.
- Insert a borosilicate glass capillary (outer diameter 1.5 mm, inner diameter approximately 0.9 mm, length 90 mm) through the pre-formed hole of the 3D-printed holder.
- Attach the sponge to the platform on the holder using UV-curable resin with water resistance property. Cure for 30 s under UV light to ensure solidification.
- Insert the assembled holder with sponge into the NMR tube.
2. Cell preparation (start 2 weeks before measurement)
- Thaw frozen cell stocks (SCCVII or HeLa) rapidly in a 37 °C water bath. Transfer approximately 1 × 10⁶ cells into 10 mL RPMI-1640 medium supplemented with 10% (v/v) fetal bovine serum and 1% (v/v) penicillin-streptomycin.
- Culture cells at 37 °C with 5% CO2 and passage them every 2-3 days once 70%-80% confluency is reached. Continue culturing for approximately 2 weeks to obtain ~4 x 10⁷ cells, estimated from five 10 cm dishes grown to approximately 90% confluency (each yielding ~8 x 10⁶ cells).
3. Alginate gel preparation
- Preparation of alginate solution
- Dissolve biological research-grade sodium alginate powder in deionized water to prepare a 2% (w/v) solution. Incubate the solution overnight at 25 °C or higher with gentle end-over-end agitation. Use a tube rotator set at approximately 10-20 rpm to prevent bubbles and ensure uniform dissolution.
- Encapsulation of cells in alginate gel
- Add 2 mL of 0.25% (v/v) trypsin-EDTA to the 10 cm dish. Tilt the dish to cover the entire surface and aspirate the excess trypsin-EDTA.
- Incubate the dish at 37 °C for 2 minutes.
- Add 10 mL of culture medium to the dish. Gently pipette up and down to detach the cells. Collect the entire cell suspension into a 15 mL conical tube.
- Take approximately 10 µL of the suspension and count the number of cells using a cell counter. Typically, around 1 × 10⁷ cells are required for the subsequent procedures, but the actual number should be confirmed by measurement.
- Centrifuge the remaining cell suspension at 120 × g for 5 min. Remove the supernatant and resuspend the cell pellet in 4 mL of 2% (w/v) alginate solution. Pipette slowly to minimize the generation of bubbles.
- Gel formation by calcium cross-linking (Figure 3)
- Add 10 mL of 50 mM CaCl2 solution to a 50 mL centrifuge tube (Figure 3A).
- Take 300 µL of the cell-alginate mixture into a 0.5 mL syringe fitted with a 30G, 10 mm needle, and secure it to the cap of the centrifuge tube (Figure 3B).
- Close the cap of the centrifuge tube tightly with the syringe fixed to it and centrifuge the entire assembly gently at 200 × g for 5 min. Remove the supernatant solution after centrifugation and resuspend the cell-loaded gel in the medium (Figure 3C-D).
- Loading the gel into the NMR tube
- Transfer the cell-encapsulated gel into the NMR tube using a Pasteur pipette. Insert the sponge fixture and ensure a tight seal.
- Pre-warm the medium reservoir (containing 5% (v/v) D2O) prepared in step 1.3.2 in a water bath to 37 °C and circulate it at a rate of approximately 500 µL/h to stabilize the conditions.
- Ensure there are no leaks before inserting the NMR tube into the magnet. While keeping the PEEK tubing straight, insert the NMR tube into the magnet. Adjust the gel size, bead number, and pipetting speed according to cell type and experimental requirements.
4. Preparation of hyperpolarized probe using a DNP polarizer (Figure 4)
- Preparation of the sample vial
- Add 18 µL of [1-13C] pyruvic acid (14.2 M) doped with 25 mM OX063 to a sample vial. Connect the vial to the fluid path of the DNP polarizer system.
- Polarization of the sample
- Insert the vial into the bore unit of the DNP polarizer (6.7 T, 1.25 K, 1.2 mbar). Apply microwave irradiation at approximately 188 GHz (22 mW) for 60-80 min.
- Monitoring signal during polarization
- Use the solid-state NMR spectrometer built into the DNP system to monitor 13C signal intensity. Record signal data every 5 min using the NMR software (SPINit).
- Dissolve and prepare the hyperpolarized solution
- Rapidly dissolve the polarized sample in 3.2 mL of preheated dissolution buffer (40 mM Tris, 50 mM NaCl, 80 mM NaOH, 100 mg/L EDTA). Ensure the solution reaches biological temperature (308-313 K, pH ~7) before transferring for NMR measurement.
NOTE: Use caution when handling high-pressure components. Preheat the dissolution buffer to ~461 K to ensure efficient transfer and sample integrity.
- Rapidly dissolve the polarized sample in 3.2 mL of preheated dissolution buffer (40 mM Tris, 50 mM NaCl, 80 mM NaOH, 100 mg/L EDTA). Ensure the solution reaches biological temperature (308-313 K, pH ~7) before transferring for NMR measurement.
5. NMR setup
- Preparation of the NMR spectrometer
- Load the sample into the NMR tube and insert it into the spectrometer.
- Perform locking, tuning, matching, and shimming on the NMR console using the automated procedure with sample inserted, to optimize spectral resolution and signal stability.
- Setting up the acquisition parameters
- Load a 13C pulse-acquire sequence (e.g., zg2d) with proton decoupling enabled (e.g., 13-CPD).
- Set the flip angle to 90° by using a 1 µs pulse (P1). Set the acquisition time to 1.376 s, the spectral width to 23,663 Hz, and the number of acquisition points (TD) to 65,536. Set the relaxation delay (D1) to 0 s.
- Set the number of time increments (TD1) to 150 to acquire 150 sequential spectra in pseudo-2D mode. Adjust the receiver gain to a low value (e.g., ~1) to avoid signal saturation from hyperpolarized samples.
NOTE: Due to the high signal intensity of hyperpolarized NMR, set the receiver gain to a low value (e.g., ~1), which typically corresponds to less than 1% of the maximum available gain. The receiver gain is an internal, unitless parameter that controls signal amplification. Excessively high values may result in signal saturation.
6. NMR measurement
- Preparation for measurement
- Fill the entire inlet tubing path from the inlet tubing to the NMR tube with dissolution buffer to avoid air entrapment (Figure 2B). The inlet tubing is used for both medium perfusion and hyperpolarized probe injection.
- Carefully check that no air bubbles are present in the inlet tubing or inside the NMR tube, as bubbles in this region can interfere with signal acquisition during NMR measurements.
- Preparation for injection of hyperpolarized solution
- Stop the peristaltic pump to temporarily halt medium circulation before injecting the hyperpolarized solution through the inlet tubing.
- Start the spectral acquisition approximately 10 s before dissolving the hyperpolarized substrate to ensure that the signal is captured immediately upon arrival at the NMR detection site after injection.
- Draw 1 mL of the solution with a syringe when it exits the DNP polarizer.
- Injection of the hyperpolarized solution and confirmation of signal
- Switch the three-way valve at the bioreactor inlet to Position B to inject the hyperpolarized solution into the NMR tube.
- Switch the valve back to Position A after injection to resume medium circulation and prevent backflow.
- Confirm successful injection and substrate arrival by observing an increase in the Free Induction Decay (FID) signal in the acquisition software.
7. Data processing and analysis
- Processing spectral data
- Load the time-resolved NMR spectrum into the data processing software. If the data are stored in ser file format, locate and load the appropriate file.
- Analyzing the spectra
- Perform the Fourier Transformation (FT) to convert the raw FID to the frequency domain. Apply phase correction either manually or automatically. Conduct baseline correction to remove distortions.
- Visualization of metabolite conversion
- Plot the time-course signals for pyruvate C1 (~171 ppm) and lactate C1 (~183 ppm).
- Quantification of metabolic conversion
- Calculate the area under the curve (AUC) for the pyruvate and lactate peaks.
- Determine the [Lactate]/[Pyruvate] ratio by dividing the AUC of lactate by that of pyruvate.
NOTE: AUC is used instead of peak height to minimize the influence of ringing artifacts caused by the large hyperpolarized [1-¹³C] pyruvate signal. The AUC values are obtained by the simple summation of signal intensities within the defined integration range for each peak.
Results
In this study, a fabricated system was coupled to hyperpolarized 13C NMR spectroscopy to measure pyruvate metabolism in live cells in real time. The main signals detected in the 1D 13C NMR spectrum corresponded to pyruvate (approximately 171 ppm) and lactate (approximately 183 ppm)21, allowing us to evaluate the metabolic conversion of pyruvate to lactate under physiological conditions (Figure 4).
Spectral quality and signal dynamics
Representative results from repeated measurements on the same sample using SCCVII cells—a mouse squamous cell carcinoma line frequently used in hyperpolarized MRI studies—are shown in Figure 5. The first measurement exhibited a clear increase in lactate signal, indicating active metabolic conversion. However, subsequent measurements taken at 1.5 h intervals showed a progressive decline in metabolic activity. This time-dependent reduction likely reflects biological stress or adaptation induced by the initial pyruvate injection. Notably, a similar transient metabolic modulation has been reported in vivo using hyperpolarized MRI and EPRI, where tumor oxygenation temporarily decreased following pyruvate administration22. These results demonstrate that the repeatability of these measurements enables non-destructive tracking of dynamic metabolic changes — an advantage that is difficult to achieve with destructive methods23.
To evaluate the applicability of this protocol to other cell types, additional measurements were conducted using HeLa cells, a widely used human cancer cell line. As shown in Figure 6, HeLa cells also displayed clear pyruvate-to-lactate conversion. Although signal intensity gradually decreased due to T1 relaxation, the signal-to-noise ratio remained sufficient throughout the 60 s acquisition period. These findings suggest that the current protocol is broadly applicable and can serve as a versatile tool for real-time metabolic profiling in various cell types.
While rapid signal decay is an inherent limitation of DNP-based NMR, our in situ mixing system minimizes the delay between dissolution and measurement, thereby enhancing detection sensitivity. Further refinements, such as optimizing the gel matrix composition, may expand the applicability of this method to a wider range of biological systems.

Figure 1: Schematic diagram of the overall workflow from cell culture to hyperpolarized NMR measurement. The process begins with cell culture (~2 weeks), followed by alginate gel preparation (~60 min) to encapsulate cells for stable measurement. Next, hyperpolarization is performed using a DNP polarizer system (~60 min), and NMR measurement is conducted using a 400 MHz NMR spectrometer (~5 min). The photographs on the right show the corresponding instruments used in this workflow. Please click here to view a larger version of this figure.

Figure 2: Bioreactor setup for hyperpolarized NMR measurement. (A) Schematic diagram of the bioreactor setup. The culture medium is introduced into the NMR tube through inlet A and subsequently directed to waste. Alginate beads containing live cells are placed inside the NMR tube. During hyperpolarized NMR measurements, the hyperpolarized probe is injected through inlet B, labeled as the hyperpolarized probe inlet. (B) Photograph of the entire bioreactor setup, with the inlet and outlet tubing clearly labeled. (C) Close-up view of the inlet tubing switch, showing inlet A (medium perfusion) and inlet B (hyperpolarized probe injection). (D) CAD design and (E) representative photograph of the 3D-printed sponge-fixing component placed inside the NMR tube. The component includes a hole for guiding a glass capillary that delivers the hyperpolarized substrate solution and a platform to hold a sponge. The component itself does not fit tightly against the inner wall of the NMR tube; (F) instead, a sponge is inserted around it to fill the gap. This structure stabilizes the component and allows the waste medium to flow upward through the sponge, eliminating the need for an additional outlet hole. Please click here to view a larger version of this figure.
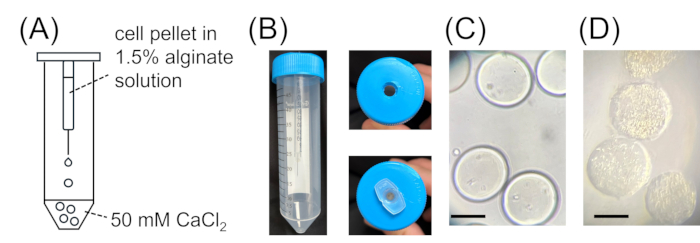
Figure 3: Alginate gel preparation. (A) Schematic illustration and (B) photograph of the alginate gel ball formation apparatus. The left image shows the entire setup, including the centrifuge tube with a syringe fixed to its modified lid. The top-right image shows a lid with a small hole for the syringe tip, while the bottom-right image shows a lid with a square opening for stable syringe positioning. The centrifuge tube is pre-filled with 10 mL of calcium chloride solution, allowing the alginate solution exiting the syringe tip to undergo gelation, forming alginate gel balls. (C) Representative microscopic image showing the morphology of alginate gel balls. (D) Representative microscopic image showing the morphology of alginate gel balls containing HeLa cells. Scale bar = 200 µm. Please click here to view a larger version of this figure.
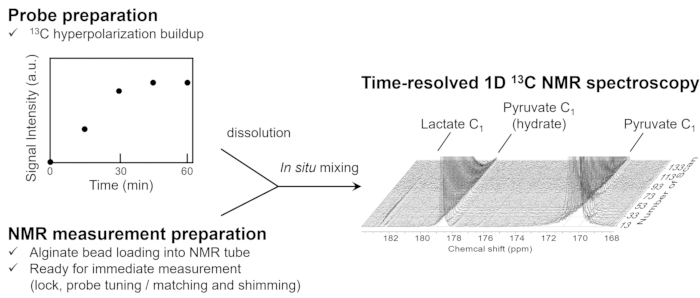
Figure 4: Schematic representation of the preparation steps for NMR measurement and hyperpolarization. During the ~60 min DNP buildup process, the NMR setup is performed in parallel to minimize delays. The preparation involves alginate bead loading into the NMR tube, followed by 1H lock adjustment, shimming, and probe tuning to ensure the system is ready for immediate measurement. After dissolution and in situ mixing, time-resolved 13C NMR spectroscopy reveals clear pyruvate and lactate peaks. The peaks observed at approximately 171 ppm, 179 ppm, and 183 ppm correspond to pyruvate, pyruvate hydrate, and lactate, respectively. Approximately 4 × 10⁷ HeLa cells encapsulated in alginate gel were used for the NMR measurement. Please click here to view a larger version of this figure.
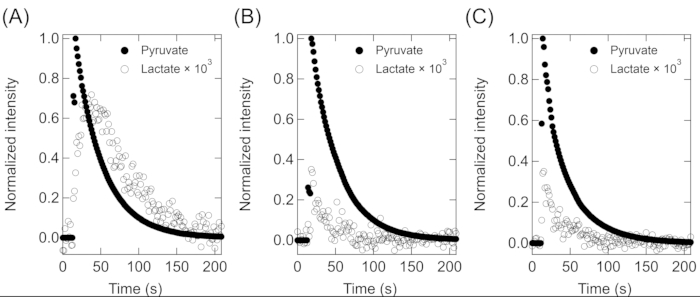
Figure 5: Time-resolved detection of pyruvate and lactate signals in repeated measurements. Hyperpolarized 13C NMR spectra of the same SCCVII cell-encapsulated sample were acquired at 1.5 h intervals to evaluate the feasibility of repeated non-destructive measurements. Pyruvate (open circles) and lactate (filled circles, scaled by 1000×) peak intensities are plotted over time for each acquisition. (A) First measurement. (B) The second measurement, after 1.5 h, reveals a marked reduction in lactate production. (C) The third measurement, after another 1.5 h, confirmed sustained low metabolic activity. Quantitative analysis based on the area under the curve (AUC) showed that the [Lactate]/[Pyruvate] ratio decreased from 0.00134 (first measurement) to 0.00019 (second) and 0.00027 (third). The final cell concentration in the alginate gel was approximately 1.0 × 10⁷ cells/mL (4 × 10⁷ cells in 4 mL). Please click here to view a larger version of this figure.
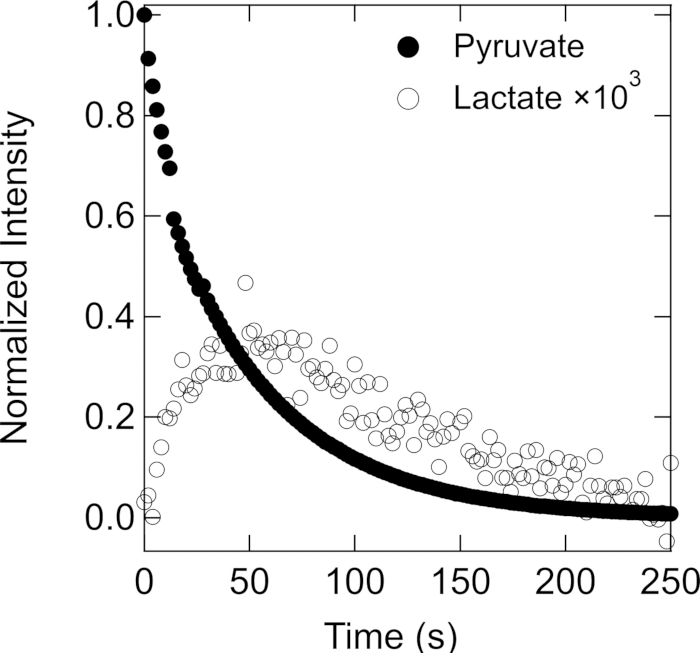
Figure 6: Conversion of pyruvate to lactate in HeLa cells. Time-resolved hyperpolarized 13C NMR signals of pyruvate and lactate were measured in live HeLa cells. The pyruvate signal intensity is normalized to its maximum value at time zero. The lactate signal intensity is scaled by a factor of 103 for visibility. Quantitative analysis based on the area under the curve (AUC) showed a [Lactate]/[Pyruvate] ratio of 0.00121. The final cell concentration in the alginate gel was approximately 7.5 × 10⁶ cells/mL (3 × 10⁷ cells in 4 mL). Please click here to view a larger version of this figure.
Supplementary Figure 1. Representative images of the vial septum used in the bioreactor system. (A) Silicone/PTFE septum (9 mm diameter) before use. (B) The same septum in actual use, with PEEK tubing inserted through punctured holes. The elasticity of the septum material allows it to reseal around the tubing, maintaining airtight conditions during hyperpolarized substrate injection. Please click here to download this figure
Supplementary Figure 2: Time-resolved hyperpolarized 13C NMR spectrum acquired after external mixing. Representative time-resolved spectrum of [1-13C] pyruvate metabolism measured using a benchtop NMR system after external mixing of hyperpolarized pyruvate and cells outside the NMR tube. Please click here to download this figure
Supplementary File 1: CAD design of the cylindrical holder. Please click here to download this file
Discussion
Critical steps of the protocol
The success of this protocol depends on several critical steps. First, it is important to ensure proper dissolution and transfer of hyperpolarized 13C pyruvate to maintain a high signal-to-noise ratio. To capture the early metabolic conversion of pyruvate to lactate, the timing of the injection of the hyperpolarized probe and the NMR acquisition must be synchronized. Furthermore, it is important to maintain cell viability throughout the experiment. Deviations from these parameters may result in reduced metabolic activity and loss of signal.
Modifications and troubleshooting of the method
While this protocol provides a robust approach for real-time metabolic monitoring, certain modifications may improve its applicability. For example, adjusting the flip angle of the NMR acquisition can balance signal intensity and polarization decay to optimize data collection. In addition, although a method was introduced to stably prepare alginate gels of a certain size, the size of the gels to be created can be easily adjusted by selecting a syringe or needle. This can contribute to reproducing a hypoxic environment24 in addition to preventing cells from escaping from the NMR tube. In addition, the alginate gel becomes dense and viscous inside the NMR tube, especially in the NMR measurement area. If air gets in when injecting the culture medium or hyperpolarized probe from the PEEK tube, it is likely to remain at the NMR measurement site, which will lead to a decrease in the quality of the spectrum.
Limitations of the method
Although hyperpolarized measurements have the advantage of high sensitivity of NMR signals, they have inherent limitations. Due to the T1 relaxation of hyperpolarized 13C pyruvate, the duration of metabolic measurements is limited to about 1 min, limiting the observation of long-term metabolic shifts. In addition, it is difficult to measure a cell sample several hours after it has been measured once, which may be related to the dripping of a large amount of pyruvate in one measurement. This is the same as the fact that related groups have measured spectra one day later18, and the measurement interval needs to be that long.
Importance of the method compared to existing techniques
Compared to conventional metabolic assays, our method has an advantage over endpoint measurements such as mass spectrometry and biochemical assays in that it provides real-time insight into cellular metabolism. Although similar hyperpolarized NMR spectra can be obtained without using a bioreactor, the ability to start measurements immediately with in situ mixing is beneficial, given the rapidity of relaxation. In addition, cells can be pre-set in a stable environment before injection, improving reproducibility and kinetic accuracy of metabolic analysis. This advantage is supported by a supplementary experiment (Supplementary Figure 2), where time-resolved spectra were acquired using a benchtop NMR system after external mixing. In this setup, a delay of approximately 30 s between mixing and signal acquisition led to significant polarization loss, particularly affecting the detection of lactate. This confirms that in situ mixing improves the fidelity of kinetic measurements under conditions with rapid T1 decay. However, it is worth noting that the signal intensity in this in situ setup was lower, likely due to dilution caused by medium perfusion — an issue that remains to be optimized.
Importance and potential applications
This method may pave the way for applications in understanding the metabolic properties of diverse life forms. Real-time measurement of metabolic fluxes enables researchers to dynamically assess the effects of metabolic inhibitors. Integrating this approach with other measurement techniques may further enhance the accuracy of intracellular metabolism analysis.
We envision a practical experimental workflow in which destructive, high-throughput metabolomics is used to identify candidate pathways, followed by real-time validation using hyperpolarized 13C NMR to evaluate enzyme function and flux dynamics in living cells. This approach enables the direct detection of transient metabolic responses under physiological conditions-something difficult to achieve using immunoassays or fluorescence sensors, which typically measure static metabolite levels or require exogenous probes. While fluorescence imaging and immunoassays are indispensable for spatial localization and high-throughput screening, respectively, hyperpolarized NMR provides a complementary functional readout that captures reaction kinetics in a non-destructive manner. This strategy not only facilitates mechanistic insights at the cellular level, but also serves as a bridge toward diagnostic applications at the tissue or organism scale. In particular, the ability to capture functional metabolic shifts in real time may support the early detection of metabolic disorders and therapeutic responses in complex biological systems.
Progress has also been made in the development of metabolic probes targeting diverse metabolic pathways and synthetic substrates designed for specific enzymes, expanding the possibilities for metabolic research25,26. Furthermore, advancements in hyperpolarization techniques, such as delivering hyperpolarized substrates directly from the polarizer to the NMR through a magnetic tunnel27- may improve signal retention and expand the potential applications of this method in biomedical research.
Disclosures
The authors have no conflicts of interest to disclose.
Acknowledgements
This work was supported by JSPS KAKENHI Grant Number 23KJ2179 and 24K17833 (to T.U.), 23K27561 (to Y.T.); MEXT Q-LEAP [JPMXS0120330644 (to Y.T.)]; and MEXT Promotion of Development of a Joint Usage/Research System Project: Coalition of Universities for Research Excellence Program (CURE) Grant Number JPMXP1323015488 (Spin-L program No. spin24XQ007).
Materials
| Name | Company | Catalog Number | Comments |
|---|---|---|---|
| [1-13C] pyruvic acid | Cambridge Isot ope Laboratories, Inc. | CLM-8077 | |
| 3D Printer | Elegoo | Saturn 2 | |
| Calcium Chloride | Nacalai Tesque, Inc. | 06729-55 | |
| D2O | Sigma-Aldrich | 151882 | |
| External Circulation Kit for Pump | AS ONE | 1-4141-02 | |
| Fetal Bovine Serum | Gibco | 10270106 | |
| Flangeless Fitting Set | GL Sciences Inc. | 6010-46390 | |
| Glass Capillary with Core | Narishige | GDC-1.5 | Inner diameter ~0.9 mm, length 90 mm |
| Magnetic Circulating Pump | AS ONE | 1-4141-01 | |
| MestReNova | Mestrelab Research | NMR spectral processing and analysis software | |
| My Shot Syringe | Nipro Corporation | 8277 | 0.5 mL/100U, 30G x 10 mm, 140 pcs |
| OX063 | Oxford Instruments Co. Ltd. and Polarize IVS Co. Ltd. | - | |
| PEEK Tube | AS ONE | 3-780-05 | |
| penicillin-streptomycin | Nacalai Tesque, Inc. | 26252-94 | |
| Peristaltic Bio Mini Pump | ATTO | 1221200 | High precision, wide flow rate type for stable medium flow |
| Resin | Siraya Tech | Smoky Black | |
| RPMI-1640 Medium | Nacalai Tesque, Inc. | 30264-85 | |
| Silicone/PTFE vial septum | GL Sciences Inc. | 1030-50009 | |
| Sodium Alginate 80-120 | FUJIFILM Wako Pure Chemical Corporation | 194-13321 | |
| SPINit software | RS2D | NMR software in the DNP polarizer | |
| Sponge | - | - | Commercially available sponge cut to size for gel stabilization |
| Three-way Stopcock | AS ONE | 3-6247-04 | |
| TopSpin | Bruker | NMR data acquisition and processing software | |
| Trypsin-EDTA (0.25%) | Thermo Fisher Scientific | 07086-74 | |
| UV-curable Resin | BONDIC | BD-SKCJ | |
| Water Bath | AS ONE | 1-5832-41 | Thermal Robot TR Series TR-1α for maintaining 37 °C temperature |
| Wilmad Screw-cap NMR tube | Sigma | Z271977 | Frequency 400 MHz, diameter 10 mm, L 178 mm. |
References
- Ardenkjaer-Larsen, J. H., et al. Increase in signal-to-noise ratio of >10,000 times in liquid-state NMR. Proc Natl Acad Sci USA. 100 (18), 10158-10163 (2003).
- Comment, A., Merritt, M. E. Hyperpolarized magnetic resonance as a sensitive detector of metabolic function. Biochemistry. 53 (47), 7333-7357 (2014).
- Balzan, R., et al. Dissolution Dynamic Nuclear Polarization Instrumentation for Real-time Enzymatic Reaction Rate Measurements by NMR. J Vis Exp. (108), e53548(2016).
- Liu, M., Hilty, C. Metabolic measurements of nonpermeating compounds in live cells using hyperpolarized NMR. Anal Chem. 90 (2), 1217-1222 (2018).
- Sannelli, F., Jensen, P. R., Meier, S. In-cell NMR approach for real-time exploration of pathway versatility: substrate mixtures in nonengineered yeast. Anal Chem. 95 (18), 7262-7270 (2023).
- Harris, T., Eliyahu, G., Frydman, L., Degani, H. Kinetics of hyperpolarized 13C1-pyruvate transport and metabolism in living human breast cancer cells. Proc Natl Acad Sci USA. 106 (43), 18131-18136 (2009).
- Rao, Y., et al. Hyperpolarized [1-13C]pyruvate-to-[1-13C]lactate conversion is rate-limited by monocarboxylate transporter-1 in the plasma membrane. Proc Natl Acad Sci USA. 117 (36), 22378-22389 (2020).
- Mathiassen, T. B. W., et al. Hyperpolarized 13C NMR for longitudinal in-cell metabolism using a mobile 3D cell culture system. J Magn Reson Open. 16 - 17 (100131), 100131(2023).
- Meier, S., et al. Hyperpolarized 13C NMR reveals pathway regulation in Lactococcus lactis and metabolic similarities and differences across the tree of life. Molecules. 29 (17), 4133(2024).
- Sriram, R., et al. Detection of bacteria-specific metabolism using hyperpolarized [2-13C]pyruvate. ACS Infect Dis. 4 (5), 797-805 (2018).
- Park, J. M., et al. Hyperpolarized sodium [1-13C]-glycerate as a probe for assessing glycolysis in vivo. J Am Chem Soc. 139 (19), 6629-6634 (2017).
- Singh, J., et al. Probing carbohydrate metabolism using hyperpolarized 13C-labeled molecules. NMR Biomed. 32 (10), e4018(2019).
- Bohndiek, S. E., et al. Hyperpolarized [1-13C]-ascorbic and dehydroascorbic acid: vitamin C as a probe for imaging redox status in vivo. J Am Chem Soc. 133 (30), 11795-11801 (2011).
- Yamamoto, K., et al. Real-time insight into in vivo redox status utilizing hyperpolarized [1-13C] N-acetyl cysteine. Sci Rep. 11 (1), 12155(2021).
- Düwel, S., et al. Imaging of pH in vivo using hyperpolarized 13C-labelled zymonic acid. Nat Commun. 8 (1), 15126(2017).
- Chen, J., Hackett, E. P., Singh, J., Kovács, Z., Park, J. M. Simultaneous assessment of intracellular and extracellular pH using hyperpolarized [1-13C]alanine ethyl ester. Anal Chem. 92 (17), 11681-11686 (2020).
- Eills, J., et al. Spin hyperpolarization in modern magnetic resonance. Chem Rev. 123 (4), 1417-1551 (2023).
- Keshari, K. R., et al. Hyperpolarized 13C spectroscopy and an NMR-compatible bioreactor system for the investigation of real-time cellular metabolism. Magn Reson Med. 63 (2), 322-329 (2010).
- Sriram, R., et al. Real-time measurement of hyperpolarized lactate production and efflux as a biomarker of tumor aggressiveness in an MR compatible 3D cell culture bioreactor. NMR Biomed. 28 (9), 1141-1149 (2015).
- Mangas-Florencio, L., et al. A DIY bioreactor for in situ metabolic tracking in 3D cell models via hyperpolarized 13C NMR spectroscopy. Anal Chem. 97 (3), 1594-1602 (2025).
- Hill, D. K., et al. Model free approach to kinetic analysis of real-time hyperpolarized 13C magnetic resonance spectroscopy data. PLoS One. 8 (9), e71996(2013).
- Saito, K., et al. 13C-MR spectroscopic imaging with hyperpolarized [1-13C]pyruvate detects early response to radiotherapy in SCC tumors and HT-29 tumors. Clin Cancer Res. 21 (22), 5073-5081 (2015).
- Sengupta, D., Pratx, G. Imaging metabolic heterogeneity in cancer: from PET to hyperpolarized MRI. Mol Cancer. 15, 43(2016).
- Read, G. H., et al. Three-dimensional alginate hydrogels for radiobiological and metabolic studies of cancer cells. Colloids Surf B Biointerfaces. 171, 197-204 (2018).
- Meier, S., Jensen, P. R., Karlsson, M., Lerche, M. H. Hyperpolarized NMR probes for biological assays. Sensors. 14 (1), 1576-1597 (2014).
- Kondo, Y., Nonaka, H., Takakusagi, Y., Sando, S. Design of nuclear magnetic resonance molecular probes for hyperpolarized bioimaging. Angew Chem Int. Ed. 60 (27), 14779-14799 (2021).
- Milani, J., et al. A magnetic tunnel to shelter hyperpolarized fluids. Rev Sci Instrum. 86 (2), 024101(2015).
Reprints and Permissions
