Machine learning models were developed to predict L5-S1 disc herniation recurrence after PEID surgery, analyzing data from 309 patients. Key predictors included BMI and PDHI, with random forest and extreme gradient boosting models showing the best performance.
A subscription to JoVE is required to view this content. Sign in or start your free trial.
Research Article
The Prediction of Recurrence of Lumbar Disc Herniation at L5-S1 through Machine Learning Based on Endoscopic Discectomy via the Interlaminar Approach
In This Article
Summary
Abstract
This study aimed to develop machine learning (ML) models to predict the L5-S1 level recurrent lumbar disc herniation (rLDH) after percutaneous endoscopic interlaminar discectomy (PEID), a minimally invasive treatment for L5-S1 lumbar disc herniation. Data from 309 patients who underwent single-level L5-S1 PEID between January 2020 and June 2024, with at least 6 months of follow-up, were analyzed. Clinical records, preoperative imaging, and visual analog scale (VAS) scores were used. LASSO regression identified key predictors, and six ML models were built: support vector machine (SVM), decision tree (DT), adaptive boosting (ADA), light gradient boosting machine (LGBM), random forest (RF), and extreme gradient boosting (XGB). Among the patients, 10.7% experienced rLDH, defined as ≥60% VAS reduction followed by symptom recurrence and imaging confirmation. Key predictors included Body Mass Index (BMI), posterior disc height index (PDHI), spinal canal stenosis, disease duration, numbness or weakness, Modic changes, herniation type, and diabetes. The RF and XGB models performed best. Higher BMI, Higher PDHI, spinal canal stenosis, disease duration over six months, Modic changes, non-contained herniation, and diabetes increased rLDH risk. Variable importance was ranked for both models. Predicting rLDH preoperatively can enhance decision-making and reduce recurrence risk after PEID, with ML models improving accuracy and identifying critical risk factors.
Introduction
Percutaneous endoscopic lumbar discectomy (PELD) encompasses various techniques, such as percutaneous endoscopic transforaminal discectomy (PETD) and percutaneous endoscopic interlaminar discectomy (PEID), with the choice of surgical approach depending on the lesion location and individual anatomical characteristics of the patient1. Recurrent lumbar disc herniation (rLDH) is one of the most common reasons for reoperation following PELD, with an incidence ranging from 0% to 12.5%2,3. As a minimally invasive technique, PEID has been widely applied in the treatment of lumbar conditions such as L5-S1 level disc herniation. Its advantages, including minimal trauma, short hospital stays, and rapid postoperative recovery, have made it highly favored by both clinicians and patients4. However, despite the significant benefits of endoscopic techniques in reducing surgical trauma and promoting quick recovery, some patients still face the issue of recurrent disc herniation post-surgery5.
The recurrence of lumbar disc herniation is closely associated with multiple factors, including the degree of disc degeneration, posterior disc height, Modic changes (endplate inflammation), and areas in close contact with the endplate6. Additionally, BMI has a significant impact on postoperative recovery, with studies indicating that patients with higher BMI typically face a greater risk of recurrence5. The intervertebral disc height index, as an important indicator for assessing the degree of disc degeneration, has been widely used. It is defined as the height of the anterior and posterior disc margins divided by the centroid distance of the two vertebral bodies. However, for disc herniation and postoperative recurrence, due to the stress distribution at the anterior and posterior margins, the posterior disc height index is more critical in predicting rLDH7. Incomplete removal of the nucleus pulposus during surgery is one of the primary causes of residual postoperative symptoms, as some disc tissue is challenging to completely excise during the procedure8. Modic changes lead to endplate damage and inflammatory responses, resulting in mechanical instability. The nucleus pulposus and cartilage components in non-contained disc herniations may exacerbate degeneration of the endplate and intervertebral disc8,9. Spinal canal stenosis is associated with the incidence of rLDH, particularly in patients undergoing simple decompression surgery without fusion10. Furthermore, unhealthy lifestyle habits, cardiovascular diseases, and metabolic disorders such as diabetes significantly prolong disc healing time, increasing the risk of recurrence and pain11,12. Therefore, the first objective of this study is to further investigate the risk factors associated with rLDH following PEID at the L5-S1 segment.
In recent years, advancements in artificial intelligence (AI) and machine learning technologies have opened new possibilities for medical analysis. The application of AI and machine learning in spine-related research has significantly increased13,14. As the lowest lumbar segment bearing the greatest upper body weight and possessing unique biomechanical properties, L5-S1 is a common site for lumbar disc herniation. Based on the patient's lumbar MRI T2 sequence (due to its high sensitivity for intervertebral disc imaging, serving as the most critical evaluation tool), combined with CT and X-ray examinations, more pathophysiological information about the patient's intervertebral discs can be obtained, leading to a clearer understanding of rLDH15. In clinical practice, accurately predicting postoperative recurrence risk factors, considering the unique anatomical structure of the L5-S1 region and various potential complications, remains a significant challenge16,17.
Machine learning has been widely applied in the medical field, with algorithms such as Random Forest and Gradient Boosting playing a significant role in disease prediction and risk assessment18. LASSO regression, through its L1 regularization mechanism for variable selection and coefficient shrinkage, is used to address feature selection and overfitting issues in high-dimensional data19. The grid search algorithm comprehensively explores the hyperparameter space, facilitating the identification of the optimal hyperparameter combination for each model, thereby enhancing prediction capability and stability20. In this context, machine learning algorithms implemented in mainstream AI languages such as Python and R, when based on a sample size exceeding 240 cases, can be used to build artificial intelligence models21. By employing techniques like LASSO regression for variable selection and constructing models, grid search algorithms are utilized to minimize errors and maximize prediction accuracy, thus improving model stability.
In this study, by statistically analyzing and measuring various risk factors in L5-S1 patients, and integrating multidimensional data -- including clinical information (e.g., age, BMI) and imaging variables (e.g., disc height, posterior disc height index) -- aims to develop a more accurate predictive model. The second objective of this study is to assess patients' preoperative recurrence risk, evaluate model performance, and highlight the importance of various risk factors.
Access restricted. Please log in or start a trial to view this content.
Protocol
This study is a retrospective analysis approved by the Institutional Ethics Committee of Nantong First People's Hospital. The trial has been registered on ClinicalTrials.gov (Registration Number: NCT06833099). As all participants' health information was anonymized, informed consent was not required. The consumables and equipment used are listed in the Table of Materials.
1. Study population
The study included clinical data and preoperative imaging records of 436 patients who underwent percutaneous endoscopic interlaminar discectomy (PEID) for low back pain and leg pain due to L5-S1 disc herniation at Nantong First People's Hospital between January 1, 2020, and June 30, 2024. Based on exclusion criteria, 309 patients were ultimately included, among whom recurrent lumbar disc herniation (rLDH) was confirmed through postoperative Visual Analog Scale (VAS) scores and follow-up imaging. Of the 309 patients, 33 experienced rLDH post-surgery, while the remaining 276 had significant relief of low back and leg pain, with VAS scores reduced by over 60%. Imaging variables for all participants were derived from preoperative X-ray, CT, and MRI examinations, combined with detailed clinical information, including gender, age, height, weight, BMI, VAS scores, and other relevant variables (Figure 1).
2. Inclusion and exclusion criteria
Inclusion criteria for rLDH: (1) Patients with L5-S1 lumbar disc herniation who underwent single-segment PEID. (2) Comprehensive imaging examinations completed within one month preoperatively. (3) Postoperative VAS score reduction ≥60%, followed by an increase in score and confirmation by imaging. (4) No other abnormalities detected on imaging. (5) Minimum follow-up period of 6 months.
Inclusion criteria for Non-rLDH: (1) Patients with L5-S1 lumbar disc herniation who underwent single-segment PEID. (2) Comprehensive imaging examinations completed within one month preoperatively. (3) Postoperative VAS score reduction ≥60%, with no recurrence. (4) No other abnormalities detected on imaging. (5) Minimum follow-up period of 6 months.
Exclusion criteria: (1) Presence of other pathological conditions causing low back pain, such as disc infection, spinal tumors, metabolic bone diseases, or osteoporosis. (2) History of lumbar disc or other spinal surgeries. (3) Poor imaging quality or incomplete examination data. (4) Loss to follow-up.
3. Categorical and continuous variables
Preoperative clinical characteristics and imaging data of patients were statistically analyzed and measured (Table 1 and Table 2). Categorical variables were used to distinguish basic disease characteristics, lifestyle factors, and other variables, while continuous variables represented specific measurements describing patients' physiological status and preoperative imaging changes. To reduce bias, strict quality control measures were implemented. Two radiologists and spine surgeons with over 10 years of clinical experience were responsible for the statistical analysis and measurement of imaging data. For complex cases, the two doctors resolved issues through joint consultation to ensure accuracy and consistency in data processing.
Categorical variables included: gender, diabetes, hypertension, cardiovascular and cerebrovascular diseases (CCD), scoliosis, spinal stenosis, triggering factors (e.g., strenuous activity, sprain, cold exposure, impact, or no clear trigger), disease duration (over 6 months or less than 6 months), numbness or weakness, protrusion type (contained or non-contained), disc degeneration (Grades I, II, III and IV, V), adjacent disc degeneration (Grades I, II, III and IV, V), Modic changes, and disc calcification.
Continuous variables included: age, surgical duration, height, weight, body mass index (BMI), maximum disc herniation diameter (MDHD), posterior disc height (PDH), distance between two vertebrae centers (DBTVC), facet joint orientation angle (FJOA), disc angle (DA), sacral slope angle (SSA), lumbar lordosis angle (LLA), and posterior disc height index (PDHI, PDHI = PDH / DBTVC).
4. Data cleaning and variable selection
First, the data file "zjkj3" was read into R (version 4.3.1, https://www.r-project.org/, Platform: x86_64-w64-mingw32/x64 (64-bit), Copyright (C) 2023 The R Foundation for Statistical Computing) using the read_excel function and stored in a data variable. The character encoding selected was UTF-8 (system default), which is a widely used encoding method capable of supporting the written languages of most countries around the world. The select function was then used to separate the target variable from the feature variables. To ensure reproducibility of the data split, a fixed random seed of 3 was set, and the dataset was divided into a training set (80%) and a test set (20%). Finally, a LASSO regression function was defined, and a portion of the training data was randomly sampled using the glmnet function to fit the LASSO regression. The optimal regularization parameter λ was determined using L1 regularization and cross-validation (default 10-fold), while ensuring no duplicate patient data was mixed between the training and test sets. The cross-validation error for each λ value was calculated to determine the optimal λ value.
5. Model development and evaluation
SVM (Support Vector Machine): This model maps training data to a hyperplane, maximizing the margin between two classes to predict the target. The specific hyperparameter settings for the SVM model in this study are: kernel = "linear", cost = 1. Supplemental Figure 1 depicts the confusion matrices for SVM.
DT (Decision Tree): This model recursively splits data to create a tree structure for predicting the target variable. The specific hyperparameter setting for the DT model in this study is: max_depth = 3. Supplemental Figure 2 depicts the confusion matrices for DT.
ADA (AdaBoost): This model combines multiple weak learners (typically decision trees) to create a strong learner, improving classification performance. The specific hyperparameter settings for the ADA model in this study are: n_estimators = 150, learning_rate = 0.1, seed = 80. Supplemental Figure 3 depicts the confusion matrices for ADA.
LGBM (Light Gradient Boosting Machine): This model uses a histogram algorithm to split continuous features, speeding up the training process and reducing memory load, making it an efficient and fast gradient boosting framework, particularly suitable for large-scale datasets. The specific hyperparameter settings for the LGBM model in this study are: num_leaves = 5, learning_rate = 0.05, n_estimators = 50. Supplemental Figure 4 depicts the confusion matrices for LGBM.
RF (Random Forest): This model constructs multiple decision trees and combines their predictions to improve accuracy and control overfitting. The specific hyperparameter settings for the RF model in this study are: ntree = 310, mtry = 1, maxnodes = 10, max_depth = 1, seed = 80. Supplemental Figure 5 depicts the confusion matrices for RF.
XGB (Extreme Gradient Boosting): This model is an enhanced algorithm based on decision trees, utilizing a new generalized gradient boosting decision tree algorithm to accelerate model construction, with strong applicability for classification and regression tasks. The specific hyperparameter settings for the XGB model in this study are: nrounds = 100, max_depth = 2, eta = 0.39, gamma = 0, colsample_bytree = 0.88, seed = 80. Supplemental Figure 6 depicts the confusion matrices for XGB.
The performance of the six models was evaluated using the following metrics: test set ROC AUC, accuracy, sensitivity, specificity, positive predictive value (PPV), negative predictive value (NPV), and F1 score. The calculation formula is as follows22:
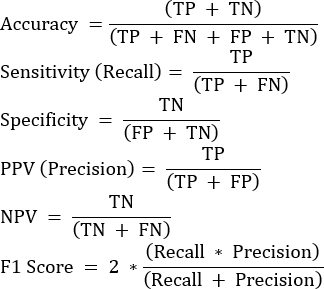
TP: True Positive; TN: True Negative; FP: False Positive; FN: False Negative.
6. Grid search and hyperparameter tuning
To optimize model performance, grid search was utilized to explore various combinations of hyperparameters. Through iterative tuning and evaluation, the optimal hyperparameter combination was identified to maximize the ROC AUC values for both the train and test sets, thereby improving the overall model performance. The ranges of adjusted hyperparameters are presented in Table 3. The grid search is provided in Supplemental Figure 7, Supplemental Figure 8, and Supplemental Table 1, Supplemental Table 2, Supplemental Table 3, and Supplemental Table 4.
7. Variable importance ranking
The top-performing models-Random Forest (RF) and Extreme Gradient Boosting (XGB)-were selected for variable importance ranking. These rankings aid in identifying the most critical predictors of L5-S1 rLDH following PEID.
8. Statistical analysis
All statistical analyses were performed using R software. Categorical variables were reported as percentages, while continuous variables were expressed as mean ± standard deviation. Clinical characteristics and imaging parameters were compared between the non-recurrent group (non-rLDH, n=276) and the recurrent group (rLDH, n=33).
Access restricted. Please log in or start a trial to view this content.
Results
A total of 309 patients with L5-S1 lumbar disc herniation causing lower back and leg pain who underwent percutaneous endoscopic interlaminar discectomy (PEID) were included in this study. Preoperative imaging data, clinical physiological variables, and VAS scores, as well as postoperative imaging and VAS scores, were collected. Among these patients, 33 were classified into the recurrent lumbar disc herniation group (rLDH group), and 276 were categorized into the non-recurrence group (Non-...
Access restricted. Please log in or start a trial to view this content.
Discussion
Percutaneous endoscopic intervertebral discectomy (PEID) plays a significant role in treating L5-S1 disc herniation, which makes it highly important to predict postoperative recurrent lumbar disc herniation (rLDH)1,2. In the image selection and data cleaning phase, this study primarily measured MRI images. When image quality was poor or images were blurred, X-ray or CT scans were used for supplementary measurements. For patients with miss...
Access restricted. Please log in or start a trial to view this content.
Disclosures
The authors declare that the research was conducted in the absence of any commercial or financial relationships that could be construed as a potential conflict of interest.
Acknowledgements
The authors would like to thank them for their financial support (The work was supported by Science Foundation of Kangda College of Nanjing Medical University (Grant No. KD2024KYJJ292). The work was supported by Nantong University Special Research Fund for Clinical Medicine (Grant No. 2024JY002). This work was supported by the Science and Technology Project of Nantong Municipal Health Commission (grant no. MS2024045). This work was supported by Science and Technology Projects in Jiangsu Province [BE2023742], Project of Jiangsu Administration of Traditional Chinese Medicine (grant no. MS2023113).
Access restricted. Please log in or start a trial to view this content.
Materials
| Name | Company | Catalog Number | Comments |
|---|---|---|---|
| Laptop GPU | NVIDIA Corporation | N/A | |
| MRI Machine | Siemens Healthineers | 11672453 | Prisma 3.0T |
| MRI Machine | Siemens Healthineers | 10849662 | Ingenia CX 3.0T |
| MRI Machine | Philips Healthcare | 781341 | iCT 64-slice Spiral CT |
| CT Machine | Philips Healthcare | 728326 | Ysio |
| X-ray Machine | Siemens Healthineers | 10092577 | 4.3.1 |
| R | The R Foundation | Open-source software; available at https://www.r-project.org/. | |
| readxl | RStudio (Posit) | Latest (CRAN) | Open-source R package; install via CRAN (install.packages("readxl")). |
| tidyverse | RStudio (Posit) | Latest (CRAN) | Collection of R packages; install via CRAN (install.packages("tidyverse")). |
| glmnet | CRAN contributors | Latest (CRAN) | Open-source R package; install via CRAN (install.packages("glmnet")). |
| pROC | CRAN contributors | Latest (CRAN) | Open-source R package; install via CRAN (install.packages("pROC")). |
| zeallot | CRAN contributors | Latest (CRAN) | Open-source R package; install via CRAN (install.packages("zeallot")). |
| reticulate | RStudio (Posit) | Latest (CRAN) | Open-source R package; install via CRAN (install.packages("reticulate")). |
| showtext | CRAN contributors | Latest (CRAN) | Open-source R package; install via CRAN (install.packages("showtext")). |
| e1071 | CRAN contributors | Latest (CRAN) | Open-source R package; install via CRAN (install.packages("e1071")). |
| rms | CRAN contributors | Latest (CRAN) | Open-source R package; install via CRAN (install.packages("rms")). |
| rpart | CRAN contributors | Latest (CRAN) | Open-source R package; install via CRAN (install.packages("rpart")). |
| caret | CRAN contributors | Latest (CRAN) | Open-source R package; install via CRAN (install.packages("caret")). |
| rpart.plot | CRAN contributors | Latest (CRAN) | Open-source R package; install via CRAN (install.packages("rpart.plot")). |
| randomForest | CRAN contributors | Latest (CRAN) | Open-source R package; install via CRAN (install.packages("randomForest")). |
| corrplot | CRAN contributors | Latest (CRAN) | Open-source R package; install via CRAN (install.packages("corrplot")). |
| PRROC | CRAN contributors | Latest (CRAN) | Open-source R package; install via CRAN (install.packages("PRROC")). |
| Matrix | CRAN contributors | Latest (CRAN) | Open-source R package; install via CRAN (install.packages("Matrix")). |
| dplyr | RStudio (Posit) | Latest (CRAN) | Part of tidyverse; install via CRAN (install.packages("dplyr")). |
| ggplot2 | RStudio (Posit) | Latest (CRAN) | Part of tidyverse; install via CRAN (install.packages("ggplot2")). |
| class | CRAN contributors | Latest (CRAN) | Open-source R package; install via CRAN (install.packages("class")). |
| ada | CRAN contributors | Latest (CRAN) | Open-source R package; install via CRAN (install.packages("ada")). |
| lightgbm | Microsoft | Latest (CRAN/GitHub) | Open-source R package; install via CRAN (install.packages("lightgbm")) or GitHub. |
| xgboost | CRAN contributors | Latest (CRAN) | Open-source R package; install via CRAN (install.packages("xgboost")). |
References
- Chen, Z., et al. Transforaminal versus interlaminar approach of full-endoscopic lumbar discectomy under local anesthesia for L5/S1 disc herniation: A randomized controlled trial. Pain Physician. 25 (8), E1191-E1198 (2022).
- Cheng, J., et al. Reoperation after lumbar disc surgery in two hundred and seven patients. Int Orthop. 37 (8), 1511-1517 (2013).
- Yin, S., et al. Prevalence of recurrent herniation following percutaneous endoscopic lumbar discectomy: A meta-analysis. Pain Physician. 21 (4), 337-350 (2018).
- Pan, M., et al. Percutaneous endoscopic lumbar discectomy: Indications and complications. Pain Physician. 23 (1), 49-56 (2020).
- Ju, C. I., Lee, S. M. Complications and management of endoscopic spinal surgery. Neurospine. 20 (1), 56-77 (2023).
- Modic, M. T., Ross, J. S. Lumbar degenerative disk disease. Radiology. 245 (1), 43-61 (2007).
- Frobin, W., Brinckmann,, Kramer, M., Hartwig, E. Height of lumbar discs measured from radiographs compared with degeneration and height classified from MR images. Eur Radiol. 11 (2), 263-269 (2001).
- Li, H., Deng, W., Wei, F., Zhang, L., Chen, F. Factors related to the postoperative recurrence of lumbar disc herniation treated by percutaneous transforaminal endoscopy: A meta-analysis. Front Surg. 9, 1049779(2023).
- Hao, L., et al. Recurrent disc herniation following percutaneous endoscopic lumbar discectomy preferentially occurs when Modic changes are present. J Orthop Surg Res. 15 (1), 176(2020).
- Kim, C. H., et al. Reoperation rate after surgery for lumbar spinal stenosis without spondylolisthesis: a nationwide cohort study. Spine J. 13 (10), 1230-1237 (2013).
- Huang, W., Han, Z., Liu, J., Yu, L., Yu, X. Risk factors for recurrent lumbar disc herniatioN: A Systematic Review and meta-analysis. Medicine (Baltimore). 95 (2), e2378(2016).
- Wang, H., Zhou, Y., Li, C., Liu, J., Xiang, L. Risk factors for failure of single-level percutaneous endoscopic lumbar discectomy. J Neurosurg Spine. 23 (3), 320-325 (2015).
- Harada, G. K., et al. Artificial intelligence predicts disk re-herniation following lumbar microdiscectomy: development of the "RAD" risk profile. Eur Spine J. 30 (8), 2167-2175 (2021).
- Berg, B., et al. Machine learning models for predicting disability and pain following lumbar disc herniation surgery. JAMA Netw Open. 7 (2), e2355024(2024).
- Suthar, P., Patel, R., Mehta, C., Patel, N. MRI evaluation of lumbar disc degenerative disease. J Clin Diagn Res. 9 (4), TC04-9(2015).
- Li, R., et al. Comparative analysis of percutaneous endoscopic interlaminar discectomy for highly downward-migrated disc herniation. J Orthop Surg Res. 18 (1), 602(2023).
- Han, M., Liu, L., Hu, M., Liu, G., Li, P. Medical expert and machine learning analysis of lumbar disc herniation based on magnetic resonance imaging. Comput Methods Programs Biomed. 213, 106498(2022).
- Jordan, M. I., Mitchell, T. M. Machine learning: Trends, perspectives, and prospects. Science. 349 (6245), 255-260 (2015).
- Tibshirani, R., et al. Strong rules for discarding predictors in lasso-type problems. J R Stat Soc Series B Stat Methodol. 74 (2), 245-266 (2012).
- Panda, A., Datar, R., Deshpande, S., Bacher, G. Enhancing pH prediction accuracy in Al2O3 gated ISFET using XGBoost regressor and stacking ensemble learning. Sci Rep. 15 (1), 19197(2025).
- Balki, I., et al. Sample-size determination methodologies for machine learning in medical imaging research: A systematic review. Can Assoc Radiol J. 70 (4), 344-353 (2019).
- Chiu, P. F., et al. Machine learning assisting the prediction of clinical outcomes following nucleoplasty for lumbar degenerative disc disease. Diagnostics (Basel). 13 (11), 1863(2023).
- Jia, M., et al. Development and validation of a nomogram predicting the risk of recurrent lumbar disk herniation within 6 months after percutaneous endoscopic lumbar discectomy. J Orthop Surg Res. 16 (1), 274(2021).
- Li, Y., et al. Adjuvant surgical decision-making system for lumbar intervertebral disc herniation after percutaneous endoscopic lumbar discectomy: A retrospective nonlinear multiple logistic regression prediction model based on a large sample. Spine J. 21 (12), 2035-2048 (2021).
- Siemionow, K., An, H., Masuda, K., Andersson, G., Cs-Szabo, G. The effects of age, sex, ethnicity, and spinal level on the rate of intervertebral disc degeneration: a review of 1712 intervertebral discs. Spine (Phila Pa 1976). 36 (17), 1333-1339 (2011).
- Choi, G., Lee, S. H., Raiturker, P. P., Lee, S., Chae, Y. S. Percutaneous endoscopic interlaminar discectomy for intracanalicular disc herniations at L5-S1 using a rigid working channel endoscope. Neurosurgery. 58 (1 Suppl), ONS59-ONS68 (2006).
- Yu, C., et al. Risk factors for recurrent L5-S1 disc herniation after percutaneous endoscopic transforaminal discectomy: A Retrospective Study. Med Sci Monit. 26, e919888(2020).
- Shi, H., Zhu, L., Jiang, Z. L., Wu, X. T. Radiological risk factors for recurrent lumbar disc herniation after percutaneous transforaminal endoscopic discectomy: A retrospective matched case-control study. Eur Spine J. 30 (4), 886-892 (2021).
- Ren, G., et al. Machine learning predicts recurrent lumbar disc herniation following percutaneous endoscopic lumbar discectomy. Global Spine J. 14 (1), 146-152 (2024).
- Wilke, H. J., et al. ISSLS prize winner: A novel approach to determine trunk muscle forces during flexion and extension: A comparison of data from an in vitro experiment and in vivo measurements. Spine (Phila Pa 1976). 28 (23), 2585-2593 (2003).
- Schmidt, H., et al. Application of a new calibration method for a three-dimensional finite element model of a human lumbar annulus fibrosus. Clin Biomech (Bristol). 21 (4), 337-344 (2006).
- Leven, D., et al. Risk factors for reoperation in patients treated surgically for intervertebral disc herniation: A AR SPORT Data. J Bone Joint Surg Am. 97 (16), 1316-1325 (2015).
- Fritzell, P., Knutsson, B., Sanden, B., Strömqvist, B., Hägg, O., et al. Recurrent versus primary lumbar disc herniation surgery: Patient-reported outcomes in the Swedish Spine Register Swespine. Clin Orthop Relat Res. 473 (6), 1978-1984 (2015).
Access restricted. Please log in or start a trial to view this content.
Reprints and Permissions
This article has been published
Video Coming Soon