This study explores the effects of a configurable soft pneumatic robot on enhancing whole-brain network topology post-stroke. Graph theory analysis indicates significant improvements in clustering coefficient, path length, and global efficiency. Findings highlight the potential of programmable robotic protocols to modulate neuroplasticity and optimize functional recovery in stroke rehabilitation.
A subscription to JoVE is required to view this content. Sign in or start your free trial.
Method Article
Soft Pneumatic Robot Modulates Graph Theory Metrics of Brain Network for Hand Rehabilitation After Stroke
In This Article
Summary
Abstract
Functional restoration of the cerebral cortex relies on activity-dependent neuroplasticity following stroke. However, optimizing robotic rehabilitation for hand recovery remains a significant challenge. This proof-of-concept study investigates the feasibility of a configurable soft pneumatic robot in modulating the brain network among ten participants with hand motor impairments after stroke. The programmable robotic intervention was administered in a randomized sequence for resting-state assessment, slow-mode, and fast-mode robotic therapy by adjusting working mode, action time, and interaction duration. Functional near-infrared spectroscopy (fNIRS) was employed to measure cortical activity and functional connectivity. Additionally, graph theory metrics, including clustering coefficient, average path length, small-world index, global efficiency, degree centrality, and eigenvector centrality, were derived from fNIRS-based functional connectivity matrices. The results demonstrated that robotic intervention significantly improved clustering coefficient (P = 0.034), average path length (P = 0.007), and global efficiency (P = 0.001). While small-world index, degree centrality, and eigenvector centrality showed an increasing trend, these differences did not reach statistical significance. Moreover, fast-mode therapy induced more substantial changes in clustering coefficient compared to slow-mode therapy, suggesting a potentially stronger effect on neural reorganization. These findings preliminarily support the use of soft robotics with adjustable paradigms to enhance brain network connectivity and facilitate neuroplasticity following stroke. The observed improvements in global efficiency and small-world properties indicate that robotic therapy optimizes cortical organization, promoting functional recovery. Further studies with larger sample sizes and personalized intervention protocols are needed to confirm these results and explore their long-term effects.
Introduction
Stroke remains a leading cause of mortality and long-term disability for adults worldwide1. Among its debilitating sequelae, hand motor impairments significantly compromise essential daily activities and functional independence, thereby diminishing social participation and life quality in stroke survivors2,3. While physical medicine and rehabilitation are critical for motor recovery, conventional therapeutic approaches often yield inconsistent outcomes due to the complexity and interindividual variability of post-stroke neural reorganization4.
In recent years, robotic-assisted therapy (RAT) has gained significant attention for its ability to deliver high-intensity, repetitive, and task-specific training to facilitate motor recovery5. To tailor such interventions more effectively, a better understanding of the neural biomarkers is crucial for direct modulation by robotic interventions. This can ultimately help optimize therapeutic strategies and promote hand dexterity. In a previous study, voxel-based lesion symptom mapping has indicated that post-stroke proximal impairments of the upper limb could be associated with deficits in descending tracts from corticomotor areas and striatum. Distinct from this, hand impairments result from isolated injuries to the brain cortex6. However, clinical outcomes for hand function remain variable, and the neural mechanisms underlying motor recovery are not yet fully elucidated7,8,9. Moreover, most commercial robotic training follows predefined protocols with limited adaptability. It fails to address patient-specific needs and potentially constrains their clinical effectiveness10.
Over the past decades, neuroimaging studies have highlighted the pivotal role of brain network reorganization in stroke recovery, characterized by alterations in functional activity and connectivity. Functional near-infrared spectroscopy (fNIRS), a non-invasive technique for monitoring cortical hemodynamics, has emerged as a valuable tool for assessing neural dynamics and guiding rehabilitation settings11. Its portability and robustness against motion artifacts make it particularly well-suited for real-time monitoring and information transfer during robotic therapy12. While previous studies have documented changes in cortical interconnectivity following motor training, the effects of RAT on whole-brain network topology remain insufficiently explored13.
Characterizing changes in brain network topology offers a valuable window into the neuroplastic processes that underlie functional recovery after brain ischemic or hemorrhagic injuries. The human brain operates as a complex network, where neurological function or repair relies on both regional integrity and the dynamic interactions among multiple areas14. Under these circumstances, graph theory provides a robust framework for quantifying large-scale brain network architecture, offering insights into cortical organization at nodal levels15. By computing key network metrics such as clustering coefficient, average path length, and global efficiency, researchers may evaluate how RAT influences neural information processing and transfer capacity. As shown in previous literature, stroke-induced disruptions to network integrity often manifest as alterations in small-world properties and overall topological organization16,17. Rehabilitation, particularly task-specific and repetitive training, has been associated with cortical reorganization. However, the precise impact of varied robotic interventions on these network dynamics remains inadequately understood18.
This study aims to investigate the feasibility of a programmable soft pneumatic robot in modulating brain network dynamics in people who have had a stroke. Compared with hand flexion/extension exercise in existing robotic paradigms, the current pneumatic robot has advantages in customizing the working mode, action time, and interaction duration for the desired movements, such as grasp, release, and pinch19,20. These diverse modes of human-robot interaction may provide more targeted stimulation to the sensorimotor cortical areas. Such a paradigm can potentially promote neuroplasticity in regions associated with hand function recovery13. In addition, fNIRS-based graph theory analysis across diverse therapeutic conditions was utilized to assess how individualized robotic strategies may optimize hand motor recovery. Moreover, the neural mechanisms underlying soft robotic rehabilitation could be preliminarily elucidated. Understanding these network-level adaptations can inform the development of targeted, neurophysiology-driven rehabilitation protocols, ultimately enhancing hand recovery in stroke survivors.
Access restricted. Please log in or start a trial to view this content.
Protocol
This study was approved by the Ethics Committee of the Tongji Hospital, Wuhan, China. All research protocols adhered to the principles outlined in the Declaration of Helsinki. Written informed consent was obtained from all participants before their inclusion in the study. The equipment and software used are listed in the Table of Materials.
1. Participants
- Consider the following inclusion criteria:
- Age between 18 and 75 years.
- First-ever ischemic or hemorrhagic stroke confirmed by CT or MRI.
- Medically stable condition.
- Sign informed consent in person or from their authorized representative(s).
- Consider the following exclusion criteria:
- Severe aphasia, cognitive impairments, consciousness disorders, or inability to cooperate with the intervention or assessment protocol.
- Inability to remain seated for at least 20 min.
- Severe muscle tone abnormalities (Modified Ashworth Scale score ≥2).
2. Soft pneumatic robotic system
- Equipment connection and startup
- Plug the power cable of the robotic system into an electrical outlet.
- Turn on the computer by pressing the button located on the computer tower.
- Connect the two air pump power cables to the power outlet and the soft pneumatic glove.
- Press the green power button on the back of the robotic system to activate the device.
- Wearing the soft pneumatic robot
- Assist the participant in wearing the soft pneumatic robot on the affected hand, ensuring a secure fit around the palm and fingers.
- Fasten the robot using the Velcro strap, ensuring it is securely positioned from the dorsal side of the thumb to the thenar eminence on the palmar side for optimal stability.
- Robotic control and mode selection
- Press the green Connect button below the imaging device.
- On the computer interface, select the Robotic Inhalation Mode.
- Configure the communication port (Com 7) to ensure proper device connectivity.
- Select the appropriate inflation-deflation mode and confirm parameter settings without causing discomfort to patients. Slow Mode: 2000 ms action time (0.5 Hz) with 75% interaction duration. Fast Mode: 200 ms action time (5Hz) with 75% interaction duration21 (Figure 1).

Figure 1: Experimental equipment and configuration. (A) Experimental setup. (B) Soft robotic configuration. (C) Soft pneumatic robot. (D) fNIRS configuration and calibration. Please click here to view a larger version of this figure.
3. Functional Near-Infrared Spectroscopy (fNIRS) system
- Equipment connection and initialization
- Use the continuous wave fNIRS system to record data from all participants. The system emits near-infrared light at wavelengths of 690 nm and 830 nm, penetrating 2-3 cm beneath the cerebral cortex, with a sampling frequency of 100 Hz.
- Switch on the power strip to supply power to all connected devices.
- Press the power button on the fNIRS device and wait for the indicator light to illuminate.
- Ensure a stable connection between the computer and the fNIRS system for uninterrupted data transmission.
- Software startup and patient information entry
- Launch the fNIRS system and verify the stability of the Wi-Fi connection.
- Navigate to the patient management interface to create a new profile: click on Add Patient, enter the participant's information, and assign an identification number.
- Wearing the fNIRS signal acquisition cap
- Select an appropriately sized fNIRS cap. Position the sensor number label slightly above the center of the forehead, ensuring proper scalp adherence. Align the FPZ and CZ optodes of the 10-20 EEG system. Secure the detectors and light sources using a flexible headband to ensure optimal contact with the skin.
- During data collection, instruct the participant to remain in a quiet, relaxed state, with their head still and eyes open.
- Before the formal process of data collection, instruct the participant to rest quietly for 2 min without falling asleep.
- Data acquisition
- Select the experimental protocol from the software interface on the computer of the fNIRS system.
- Perform signal calibrationfrom the software interface to minimize light leakage, targeting a signal strength of ≥75% with minimal noise.
- If calibration fails, adjust the sensor placement and retry. The optode sensors consist of light-emitting diodes and photodetectors. These optodes are designed to emit and detect near-infrared light at specific wavelengths.
- Conduct date recording of the cerebral cortex from the software interface, instructing the participant to remain relaxed and avoid head movements.
- Ensure to initiate the experimental task following the random sequence, continuously collecting data. The fNIRS system continuously monitors and records data on cerebral oxygenation and hemodynamics.
- Upon completing the task, stop data acquisition and securely save the experimental data.
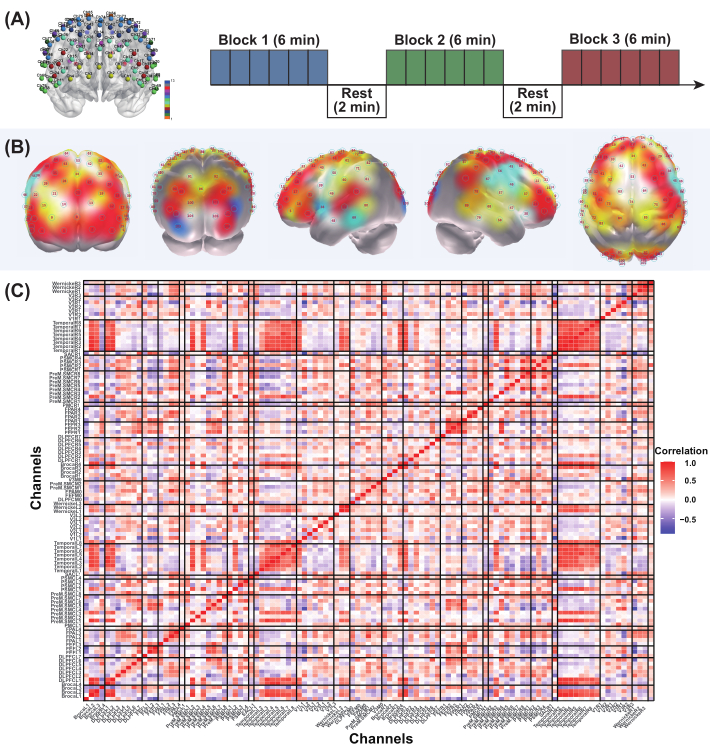
Figure 2: Experimental setup of the fNIRS system and neural assessment. (A) Optode configuration of the fNIRS system and the data acquisition protocol. (B) Visualization of brain activation from anterior, posterior, left lateral, right lateral, and superior perspectives. (C) Whole-brain functional connectivity analysis. Please click here to view a larger version of this figure.
4. Data analysis
- Preprocessing the raw fNIRS data
- Apply band-pass filtering to remove noise and artifacts from the raw data. Typical frequencies for fNIRS data are between 0.01 Hz and 0.2 Hz to capture slow changes in brain activity.
- Perform motion artifact correction by wavelet decomposition and independent component analysis (ICA). Specifically, perform wavelet decomposition on the raw fNIRS signal using a Daubechies 4 wavelet with a decomposition level of 3.
- Apply soft thresholding to the wavelet coefficients to reduce noise while preserving signal features. Reconstruct the signal from the thresholder coefficients. Apply ICA to the reconstructed signal to identify and remove components corresponding to motion artifacts.
- Divide the continuous fNIRS signal into epochs corresponding to different conditions. Specifically, identify the time points corresponding to the onset and offset of each experimental condition. Segment the continuous signal into epochs based on the experimental design (Figure 2) and their randomized sequences.
- Compute hemodynamic response
- Convert the raw intensity measurements from the fNIRS system into optical density changes using the Beer-Lambert law.
- Use the modified Beer-Lambert law to estimate changes inoxyhemoglobin (HbO) anddeoxyhemoglobin (HbR) concentrations. This typically involves solving a system of equations based on the source-detector geometry and the wavelengths used, 690 nm.
- Create 3D brain activation maps by visualizing the changes in HbO concentration across the brain regions. Specifically, use anatomical landmarks and the international 10-20 system to project the fNIRS channels onto the corresponding brain regions.
- Estimate HbO concentration changes across the entire brain surface based on the measured channels. Project the activation maps onto standardized brain templates (MNI template) to facilitate visualization.
- Use functional connectivity to map neural coactivation across the brain by computing the Pearson correlation coefficient between all pairs of channels. This coefficient quantifies the linear relationship between channel pairs and serves as the basis for constructing the functional connectivity network. Use the open-source R script (with ggplot2) to visualize the resulting network.
- Graph theory analysis
- Extract graph theory metrics (including clustering coefficient, average path length, small-world index, global efficiency, degree centrality, and eigenvector centrality) from fNIRS-derived functional connectivity matrices16,22.
- Calculate Clustering Coefficient:
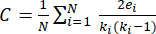
Where, ei denotes the edge number between neighbors of node i, N denotes the total number of nodes in the network (fNIRS channels), and ki denotes the degree of node i. Using the clustering coefficient, measure the degree to which nodes in a network cluster together.
NOTE: Specifically, quantify the likelihood that two neighbors of a node are also connected to each other. Ensure that a high clustering coefficient reflects highly interconnected neighbors, indicating localized, cohesive brain network structures. Neuroplasticity can alter the clustering coefficient by forming new connections or strengthening existing ones to support localized neural activity. - Calculate Average Path Length:

Where, d(i,j) represents the shortest path length between nodes i and j, and N represents the total number of nodes in the network.- Use the average path length to measure the mean number of steps required to traverse all pairs of nodes in a network. Shorter average path lengths indicate more efficient information transmission across the brain network.
NOTE: Neuroplasticity can reduce the average path length by creating new connections that act as shortcuts between distant brain regions, enhancing the brain's ability to integrate information and improving overall motor control function.
- Use the average path length to measure the mean number of steps required to traverse all pairs of nodes in a network. Shorter average path lengths indicate more efficient information transmission across the brain network.
- Calculate Small-world Index:

Where, Creal and Lreal denotes the clustering coefficient and average path length of the real network, and Crand and Lrand denotes those of a random network with the same number of nodes and edges. Use the small-world index to evaluate the balance between local clustering and global integration in the network.
NOTE: A small-world network exhibits high clustering and short path lengths, enabling efficient communication while preserving local groupings. Neuroplasticity can enhance the small-world properties by forming new connections that increase local clustering while maintaining short path lengths, thus supporting adaptive neural changes and hand dexterity. - Calculate Global Efficiency:

Where, d(i,j) represents the shortest path length between nodes i and j, and N represents the total number of nodes in the network. Use global efficiency to assess the network's ability to exchange information globally. Higher values indicate faster information transmission across the entire brain network, reflecting a well-connected system.
NOTE: Neuroplasticity can enhance global efficiency by optimizing the network's topology, leading to better integration of information across different brain regions and supporting complex hand functions. - Calculate Degree Centrality:

Where, ki denotes the degree of node . Use degree centrality to quantify the number of direct connections a node has in the network. Nodes with high degree centrality act as primary communication hubs. Neuroplasticity can increase the degree centrality of certain nodes by forming new connections, thus enhancing their role in the network, and supporting the brain's ability to adapt and reorganize. - Calculate Eigenvector Centrality:
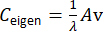
Where, A represents the adjacency matrix, and v represent the eigenvector corresponding to the largest eigenvalue λ. Use eigenvector centrality to evaluate a node's influence based on its connections to well-connected nodes.
NOTE: Nodes with high eigenvector centrality are central to hierarchical networks. Neuroplasticity can increase the eigenvector centrality of certain nodes by forming connections with other highly connected nodes, thus enhancing their role in supporting the brain's ability to process information efficiently.
- Statistical analyses
- Organize the data in long format in the statistical software, ensuring that the graph theory metrics, experimental conditions, and participant identifiers are properly structured. Prior to performing the ANOVA, verify the assumptions of normality and homogeneity of variances by using the Shapiro-Wilk test23 for normality and Levene's test for variance homogeneity24.
- Proceed with performing the one-way ANOVA to evaluate whether there are significant differences in the graph theory metrics across the three conditions. If the ANOVA yields a significant result (P < 0.05), follow up with post-hoc comparisons to identify specific differences between the conditions.
Access restricted. Please log in or start a trial to view this content.
Results
A total of 10 individuals with stroke were enrolled in the study and underwent resting-state assessment, slow-mode robotic therapy, and fast-mode robotic therapy in a randomized order. The results demonstrated the feasibility of individualizing neuroplasticity modulation by programming the robotic protocol and calculating graph theory metrics of the brain network. During soft robotic therapy, simultaneous fNIRS assessment enabled the acquisition of both brain activation and functional connectivity data.
Access restricted. Please log in or start a trial to view this content.
Discussion
This study investigated the neuroplastic effects of a configurable soft pneumatic robot on brain network dynamics in individuals with stroke using fNIRS-based graph theory analysis. The findings suggest that soft robotic therapy effectively modulates the topological organization of distributed brain networks, with participants demonstrating high compliance. Specifically, significant changes were observed in clustering coefficient, average path length, and global efficiency. While the small-world index, degree centrality,...
Access restricted. Please log in or start a trial to view this content.
Acknowledgements
This work was supported by Hubei Provincial Major Science and Technology Special Project (No. 2023BCA002), Interdisciplinary Research Support Program of Huazhong University of Science and Technology (No. 2024JCYJ067), Natural Science Foundation of Hubei Province, China (No. 2024AFB043), and Research Fund of Tongji Hospital (No. 2024B24).
Access restricted. Please log in or start a trial to view this content.
Materials
| Name | Company | Catalog Number | Comments |
|---|---|---|---|
| 106-channel fNIRS device | Wuhan Znion Technology Co., LTD | BS-2000 | Program implementation |
| FInger joint rehabilitation system | Nanjing Reseader Medical Technology Co., LTD. | RSD RS3 | Rehabilitation intervention |
| R software | R Foundation | Version 4.2.1 | Statistic analysis |
| SPSS software | IBM | Version 22.0 | Statistic analysis |
References
- He, Q., et al. Global, regional, and national burden of stroke, 1990-2021: A systematic analysis for global burden of disease 2021. Stroke. 55 (12), 2815-2824 (2024).
- Houwink, A., Nijland, R. H., Geurts, A. C., Kwakkel, G. Functional recovery of the paretic upper limb after stroke: Who regains hand capacity. Arch Phys Med Rehabil. 94 (5), 839-844 (2013).
- Hirayama, K., Matsuda, M., Teruya, M., Fuchigami, T., Morioka, S. Trends in amount of use to upper limb function in patients with subacute stroke: A cross-sectional study using segmental regression analysis. BMC Neurol. 23 (1), 429(2023).
- Feigin, V. L., Owolabi, M. O. Pragmatic solutions to reduce the global burden of stroke: A world stroke organization-lancet neurology commission. Lancet Neurol. 22 (12), 1160-1206 (2023).
- Chen, Z. J., et al. Exoskeleton-assisted anthropomorphic movement training for the upper limb after stroke: The eamt randomized trial. Stroke. 54 (6), 1464-1473 (2023).
- Lin, D. J., et al. Distinguishing distinct neural systems for proximal vs distal upper extremity motor control after acute stroke. Neurology. 101 (4), e347-e357 (2023).
- Rizor, E., et al. Brain-hand function relationships based on level of grasp function in chronic left-hemisphere stroke. Neurorehabil Neural Repair. 38 (10), 752-763 (2024).
- Chong, B., Wang, A., Stinear, C. M. Proportional recovery after stroke: Addressing concerns regarding mathematical coupling and ceiling effects. Neurorehabil Neural Repair. 37 (7), 488-498 (2023).
- Gao, Z., et al. Restoring after central nervous system injuries: Neural mechanisms and translational applications of motor recovery. Neurosci Bull. 38 (12), 1569-1587 (2022).
- Micera, S., Caleo, M., Chisari, C., Hummel, F. C., Pedrocchi, A. Advanced neurotechnologies for the restoration of motor function. Neuron. 105 (4), 604-620 (2020).
- Ricardo Sato, J., et al. An experiment using functional near-infrared spectroscopy and robot-assisted multi-joint pointing movements of the lower limb. J Vis Exp. (208), e66004(2024).
- Kim, J., Kim, E., Lee, S. H., Lee, G., Kim, Y. H. Use of cortical hemodynamic responses in digital therapeutics for upper limb rehabilitation in patients with stroke. J Neuroeng Rehabil. 21 (1), 115(2024).
- Liu, P., et al. Brain activation pattern caused by soft rehabilitation glove and virtual reality scenes: A pilot fNIRS study. IEEE Trans Neural Syst Rehabil Eng. 32, 3848-3857 (2024).
- Wang, J., He, Y. Toward individualized connectomes of brain morphology. Trends Neurosci. 47 (2), 106-119 (2024).
- Vecchio, F., Miraglia, F., Pappalettera, C., Rossini, P. M. Brain network modulation in response to directional and non-directional cues: Insights from EEG connectivity and graph theory. Clin Neurophysiol. 171, 146-153 (2025).
- Caliandro, P., et al. Small-world characteristics of cortical connectivity changes in acute stroke. Neurorehabil Neural Repair. 31 (1), 81-94 (2017).
- Li, Y., Yu, Z., Wu, P., Chen, J. The disrupted topological properties of structural networks showed recovery in ischemic stroke patients: A longitudinal design study. BMC Neurosci. 22 (1), 47(2021).
- Pavan, A., et al. Implementation of a robot-mediated upper limb rehabilitation protocol for a customized treatment after stroke: A retrospective analysis. NeuroRehabilitation. 54 (3), 411-420 (2024).
- Yurkewich, A., Kozak, I. J., Hebert, D., Wang, R. H., Mihailidis, A. Hand extension robot orthosis (hero) grip glove: Enabling independence amongst persons with severe hand impairments after stroke. J Neuroeng Rehabil. 17 (1), 33(2020).
- Syringas, P., et al. Exploring new tools in upper limb rehabilitation after stroke using an exoskeletal aid: A pilot randomized control study. Healthcare (Basel). 13 (1), 91(2025).
- Nurmi, T., Henriksson, L., Piitulainen, H. Optimization of proprioceptive stimulation frequency and movement range for fMRI. Front Hum Neurosci. 12, 477(2018).
- Akila, V., Johnvictor, A. C. Functional near infrared spectroscopy for brain functional connectivity analysis: A graph theoretic approach. Heliyon. 9 (4), e15002(2023).
- Chen, Z., et al. Action observation treatment-based exoskeleton (aot-exo) for upper extremity after stroke: Study protocol for a randomized controlled trial. Trials. 22 (1), 222(2021).
- Li, X., et al. Association of type 2 diabetes mellitus and glycemic control with intracranial plaque characteristics in patients with acute ischemic stroke. J Magn Reson Imaging. 54 (2), 655-666 (2021).
- Park, J. M., et al. Effects of robot-assisted therapy for upper limb rehabilitation after stroke: An umbrella review of systematic reviews. Stroke. , (2025).
- Singh, N., Saini, M., Kumar, N., Srivastava, M. V. P., Mehndiratta, A. Evidence of neuroplasticity with robotic hand exoskeleton for post-stroke rehabilitation: A randomized controlled trial. J Neuroeng Rehabil. 18 (1), 76(2021).
- Ti, C. E., Hu, C., Yuan, K., Chu, W. C., Tong, R. K. Uncovering the neural mechanisms of inter-hemispheric balance restoration in chronic stroke through EMG-driven robot hand training: Insights from dynamic causal modeling. IEEE Trans Neural Syst Rehabil Eng. 32, 1-11 (2024).
- Jia, T., et al. Tailoring brain-machine interface rehabilitation training based on neural reorganization: Towards personalized treatment for stroke patients. Cereb Cortex. 33 (6), 3043-3052 (2023).
- Liu, X., et al. Effects of motor imagery-based brain-computer interface on upper limb function and attention in stroke patients with hemiplegia: A randomized controlled trial. BMC Neurol. 23 (1), 136(2023).
- Li, W., et al. Bioinspired smart triboelectric soft pneumatic actuator-enabled hand rehabilitation robot. Adv Mater. 37 (9), e2419059(2025).
- Herbet, G., Duffau, H. Revisiting the functional anatomy of the human brain: Toward a meta-networking theory of cerebral functions. Physiol Rev. 100 (3), 1181-1228 (2020).
- Tang, Z., et al. Evidence that robot-assisted gait training modulates neuroplasticity after stroke: An fMRI pilot study based on graph theory analysis. Brain Res. 1842, 149113(2024).
- Wang, J., et al. Test-retest reliability of functional connectivity networks during naturalistic fMRI paradigms. Hum Brain Mapp. 38 (4), 2226-2241 (2017).
- Vecchio, F., et al. Cortical connectivity from EEG data in acute stroke: A study via graph theory as a potential biomarker for functional recovery. Int J Psychophysiol. 146, 133-138 (2019).
- Nemati, P. R., et al. Brain network topology early after stroke relates to recovery. Brain Commun. 4 (2), fcac049(2022).
- Shi, X., et al. An interactive soft robotic hand-task training system with wireless task boards and daily objects on post-stroke rehabilitation. Wearable Technol. 6, e4(2025).
- Zhou, Y., et al. Predicting upper limb motor recovery in subacute stroke patients via FNIRS-measured cerebral functional responses induced by robotic training. J Neuroeng Rehabil. 21 (1), 226(2024).
- Senadheera, I., et al. AI applications in adult stroke recovery and rehabilitation: A scoping review using AI. Sensors (Basel). 24 (20), 6568(2024).
- Chen, S., et al. Brain-computer interfaces in 2023-2024. Brain-X. 3 (1), e70024(2025).
Access restricted. Please log in or start a trial to view this content.
Reprints and Permissions
