This protocol offers a guide to implement infrared marker tracking for free-moving phantoms (e.g., organs) and holographic visualization using Augmented Reality. Additionally, it outlines a setup for preclinical validation of holographic navigation systems using electromagnetic tracking on free-moving phantoms.
Method Article
Technical Approach for Infrared Tracking for Soft Tissue Navigation with a Holographic Head-Mounted Display and Preclinical Validation
In This Article
Summary
Abstract
Augmented Reality (AR) has the potential to enhance surgical guidance by superimposing three-dimensional (3D) anatomical information directly onto the patient during surgical procedures. However, the practical implementation of AR encounters significant challenges, particularly in accurately tracking organs that move freely during surgical manipulation. Consequently, reliable organ tracking methods are necessary to maintain precise holographic overlays intraoperatively. Preclinical validation of holographic visualizations regarding accuracy poses additional challenges, requiring experimental protocols for quantitative assessment. This protocol addresses these two challenges: it describes a comprehensive approach for developing AR visualization applications using custom-made infrared markers for real-time organ tracking using a Head-Mounted Display (HMD), and it provides a validation framework leveraging electromagnetic (EM) tracking to validate holographic accuracy in phantom experiments. This work outlines step-by-step guidance for creating patient-specific 3D models from medical imaging, designing and manufacturing custom infrared markers, integrating these markers into an AR application for an HMD, and deploying them for surgical navigation. Additionally, it details a validation procedure by using EM-tracking to quantitatively measure the precision of holographic visualizations in semi-deformable kidney phantoms. Therefore, this protocol both facilitates real-time organ tracking and establishes a preclinical validation methodology. Implementing real-time organ tracking could enhance surgical guidance for free-moving organs by accurately overlaying holograms, potentially leading to improved surgical accuracy and better patient outcomes.
Introduction
In surgical oncology, accurately identifying the tumor location and relation to adjacent healthy tissues is crucial for achieving complete tumor resection while preserving healthy tissue1. Incomplete resections can lead to local recurrence and a decreased survival rate2,3, while excessive tissue removal may impair function and quality of life4. Surgical navigation systems hold promise in improving radical resections while preserving healthy tissue, by providing surgeons with intraoperative guidance that can potentially lead to improved clinical outcomes5. However, conventional surgical navigation systems typically present two-dimensional (2D) anatomical information on screens positioned outside the surgical field. This approach forces surgeons to mentally correlate the displayed 2D information with the patient's actual three-dimensional (3D) anatomy, increasing cognitive load6. Although recent advancements in 3D modeling provide surgeons with a better understanding of the tumor relation with surrounding anatomical structures7, this information is still visualized outside the operating area, maintaining the switching focus problem6,8. These limitations of surgical navigation systems can contribute to potential errors in the use of surgical navigation and potentially lead to suboptimal surgical outcomes9.
To overcome the above-mentioned limitations, augmented reality (AR) has emerged as a promising solution by visualizing anatomical structures and resection borders in 3D on patient10,11. By superimposing preoperative 3D models, which are segmented based on Magnetic Resonance Imaging (MRI) or Computed Tomography (CT) data, anatomy can be visualized. In systematic reviews, the potential benefits of AR for open surgery in adolescent patients were highlighted12, and preliminary work in this field demonstrates the feasibility of patient-specific 3D guides equipped with visual markers for automatic registration13. Van Doormaal et al. developed a navigation system with an AR device by using a point-based registration and a pointer with an image target for neurosurgery14. They assessed the developed AR application in the operating room on patients before surgery and in a phantom experiment, which showed a fiducial registration error of 7.2 mm and 4.4 mm, respectively.
Despite the promising progress, these registration systems are often rigid, lacking real-time tracking of target organs, and so, there remains a need for real-time tracking of organ movement15,16. This particularly holds true for moving organs, which are manipulated during surgery, such as the kidney and liver, which can result in inaccurate guidance, the need for reregistration, which takes considerable time, and potential harm to healthy tissue or incorrect resections17. To further address these issues, a novel AR system based on an application presented by Iqbal et al. to incorporate infrared markers for continuous organ tracking was developed18. This development allows the AR overlay to dynamically adapt to real-time changes in organ position, thereby maintaining spatial accuracy and potentially enhancing surgical precision. By combining rigid registration with dynamic infrared marker-based tracking, this system offers significant advancement towards achieving accurate, real-time holographic guidance in surgery.
This protocol presents an infrared marker-based AR navigation and preclinical validation system for a Head-Mounted Display (HMD). We aim to develop and validate a real-time augmented reality navigation system to maintain accurate holographic overlays of moving organs in a preclinical setting. First, the protocol provides a description of how a holographic application is prepared that uses infrared markers with a dimension of 32 mm (width) x 15 mm (length) x 6 mm (height) to track phantom organs in real-time, maintaining the overlay of 3D holograms independent of movement. We use a kidney phantom, printed with thermoplastic polyurethane filament (TPU), as an example model for a moving organ. Secondly, it gives an overview of how to design and print custom infrared markers and how to integrate these markers into the holographic visualization application. This allows other researchers and clinicians to adapt the application to other preclinical phantom scenarios that involve the simulation of open surgery and moving organs. Finally, a validation method based on electromagnetic tracking offers quantitative measurements to compute accuracy, offering preclinical validation of holographic guidance in phantom experiments. A limitation of this methodology is the absence of an automated registration procedure, which constrains the accuracy of this system. However, this approach assists users in determining the appropriateness of their developed AR technique for their clinical application.
Protocol
This study followed the guidelines of our institution and was not subjected to the Medical Research Involving Human Subjects Act (WMO). Therefore, it was not required to obtain informed consent from the participants.
1. Preparing hardware and software packages for 3D modeling and AR application deployment
- Download and install the following software programs on a personal computer (PC) running Microsoft Windows 10.
- Download Unity Hub v3.11.1 and Unity v. 2019.4.22f1 from https://unity.com/download. Include Visual Studio 2019 during the installation of Unity 2019.4.22f1. Link to manual: https://docs.unity3d.com/2019.4/Documentation/Manual/index.html
- Download MeshMixer v. 3.5.0 from https://apps.autodesk.com/FUSION/en/Detail/Index?id=4108920185261935100&appLang=en&os=Win64, the link to manual is https://help.autodesk.com/view/MSHMXR/2019/ENU/
- Download 3DSlicer v. 5.6.2 from https://download.slicer.org/, the link to manual is https://slicer.readthedocs.io/en/latest/
- Download Autodesk Fusion v. 2.0.21508 fromhttps://www.autodesk.com/products/fusion-360/personal, the link to manual is https://help.autodesk.com/view/fusion360/ENU/
- Download Bambu Studio v. 01.09.07.52 from https://bambulab.com/en/download/studio, the link to manual is https://wiki.bambulab.com/en/studio-handy
2. Designing and printing custom infrared markers
- Design infrared markers in a 3D Design Software as described below.
- Open the 3D Computer-aided design (CAD) software (see Table of Materials) and create a new file.
- Select the SOLID tab and click Create Sketch to begin sketching a new design for an infrared marker.
- Add three or four small circles with a diameter of 3 mm by pressing Center Diameter Circle. These circles serve as attachment points for screws.
- Calculate the center point of the infrared marker by connecting the vertices of the triangle to the midpoints of the opposite sides. Press Line and connect all circles by drawing lines from one side to the point of a circle.
- Create a circle as the base of the infrared marker on the center point using Center Diameter Circle. Use a 3-point Rectangle to draw rectangles that connect the center circle with each of the three or four smaller circles.
- Extrude the circular base and rectangles to a thickness of 2 mm, and the small circles to 5 mm.
- Add a thread to each of the three cones using an ISO Metric Profile (e.g., M3 × 0.5, 6g, Right Hand) to accommodate 6.4 mm infrared reflective spheres by pressing Create and then Thread.
- Export the model as an object (OBJ) file using the 3D Print or Export function.
- Within 3D CAD software, measure the XYZ coordinates of the infrared reflective spheres in correlation to the center point by selecting Measure. Measure the locations of the center points of the circles in correlation to the center point of the shape. Use these coordinates in step 4.1.2.
- Print 3D markers as described below.
- Import the exported stereolithography (.STL) file of the infrared marker into software suitable for the 3D printer by dragging it into the scene (see Table of Materials).
- Configure the slicing parameters, including the layer height (0.08 mm is the smallest possible layer height to avoid inaccurate printing of the thread for the infrared reflective sphere) by pressing Quality > Layer Height. Add support to the design by pressing Support > Enable Struct.
- Export the slicing file to the 3D printer by clicking Slice All, export the file by clicking Export all Slice File, and print the 3D model using a 3D printer (see Table of Materials) with polylactic acid filament (e.g., PLA; see Table of Materials).
3. Preparing the 3D patient-specific model of the kidney
- Model segmentation
- Open the 3D segmentation software (see Table of Materials) and import the patient MRI/CT data using the Import DICOM files.
- Go to the Segment Editor, choose the appropriate Source volume, and create a new segmentation by clicking Add.
- Select manual or semi-automatic segmentation based on imaging modality.
- For manual segmentation, use the Paint and Erase tool to segment the tumor and surrounding relevant structures in each slice.
- For semi-automatic segmentation, consider using options like Threshold with the appropriate threshold range for the specific structure, and Scissors to segment out the irrelevant structures.
- In the Data screen, select the Created Segmentation and then right-click to go to the Export Visible Segments to Models button. Ensure that the Eye option is selected on the right side of the screen.
- Export the STL files of the models by clicking Save and save the files as a .STL file.
- Post-processing of patient-specific model
- Import the STL file into a mesh editor (see Table of Materials) and reduce the number of triangles by selecting 3D model > Edit and then reduce by a percentage that reduces the triangles without deforming the visual aspect of the 3D model, and press Accept.
- Ensure that the target points are visually represented within the 3D model of the holographic application for further validation. Press Add spheres and place them on the 3D model.
- Export the 3D models to an OBJ file format by pressing File > Export. Ensure that the 3D model has approximately 100,000 polygons by selecting the model and reduce the polygons by pressing Edit > Reduce. Higher polygon counts necessitate more operations from the Graphics Processing Unit, so reducing the number of polygons in the scene can substantially decrease the render time.
4. Preparing the holographic application
- Configure the IRTrackingOrgans_HoloLens Project as described below.
- Launch the game development software (see Table of Materials) and import the IRTrackingOrgans_HoloLens project and open it.
- Adapt the JavaScript Object Notation (JSON) file using a text-editor, following the default format, to implement a custom infrared marker based on the coordinates measured in step 2.1.10. The JSON file is saved in Assets/StreamingAssets.
- Go to the DINO Unity tab, select the ToolManager > ResearchModeController > JSON file and Parent transform, and click Create Objects & Apply JSON Setting.
- Import the virtual infrared marker 3D model as an asset that was created in step 1.1.
- Transform the virtual infrared marker 3D model to the position of the spawned markers in the scene by selecting the model and changing the transform coordinates in the inspector window.
- Insert a patient-specific 3D model into the scene by selecting and dragging it into the scene.
- Transform the patient 3D model to the correct place, so that the infrared marker touches the surface of the 3D model. Position the infrared marker close to the center of the 3D object to minimize inaccuracies due to the lever effect.
- Connect the scene with a patient selection menu
- For practical use and selection of multiple cases, connect the patient scene to a button in the menu screen. Go to Assets > Scenes > Menu scene.
- In the Hierarchy window, go to NearMenu4x2 and ButtonCollection and then the relevant button.
- In the Inspector window, go to Basic Events and under MenuScript.LoadScene type in the name of the patient scene.
- Prepare the HMD for first-time deployment
NOTE: This section is only necessary if the application is deployed for the first time.- Log in to the HMD (see Table of Materials) device and set the device in Research Mode. Go to Settings > Update & Security > For Developers > Turn on Developer Features and Device Discovery.
- Pair the HMD to a PC (Wi-Fi or USB-C). If this is the first time connecting, follow these steps: Find the HMD's IP address in the developer tab, fill in the IP address in a web browser to connect to the Device Portal, and pair the device by generating a PIN and filling in the PIN.
- Build and deploy the application to an HMD
- Add the scenes to the build by going to File > Build Settings, adding the scene in the following order: Menu > Tracking Scene by pressing Add Open Scenes.
- Build the project using the Universal Windows Platform, Target Device HoloLens, and Architecture x64. Click Build and select a build map.
- Open the build file (.sln) with Visual Studio 2019 and change the platform to ARM64. Then open Properties by right clicking on the .sln File in the Solution Explorer and inside Debugging, type in the IP-address of the HMD under Machine Name.
- Deploy the application to the HMD by selecting Debug > Start without Debugging.
- Launch the HMD and open the holographic application. Subsequently, navigate to the patient Menu screen and select the Appropriate Case to initiate holographic visualization and guidance.
5. Validation of holographic visualization of moving organs
- Semi-deformable phantom printing
- Create or obtain a 3D model of a kidney phantom with realistic anatomical structures.
- Import the 3D model into a 3D CAD modelling software and integrate five registration pivot points onto the side of the model by using Solid > Create > Hole > with settings Hole Type: Simple, Hole tap Type: Simple, Drill Point: Angle, Height: 0.5 mm, and Diameter: 4.0 mm.
- Integrate a cylinder with a hole into the 3D model to fixate the EM reference sensor for further validation steps.
- Create a Sketch with a circle and an inner circle with a diameter of 2.8 mm using Center Diameter Circle. Extrude the outer circle by 16.5 mm.
- Combine the cylinder with the 3D model by Modify > Combine > Select 3D model and cylinder > Join > OK.
- Export the 3D model using the Export or 3D print function.
- Use a flexible or semi-flexible filament, such as TPU, (see Table of Materials) to print the kidney phantom according to the procedure described in step 2.2.
- 3D Slicer set-up using EM-tracking system
- See the extensive 3D Slicer and SlicerIGT tutorial (https://www.slicerigt.org/wp/user-tutorial/) for setting up an EM-system with 3D-Slicer.
NOTE: This section of the protocol presumes that the setup of 3DSlicer, EM-tracking configuration, and connection is well-understood and correctly set up. - Place the field generator of the EM tracking system (see Table of Materials) directly beneath the phantom. Remove all ferromagnetic materials from the environment to avoid electromagnetic field inhomogeneities.
- Connect the EM sensor (see Table of Materials) and the EM pointer (see Table of Materials) to the EM-tracking system. Ensure that the transforms of these tools are accurately visualized in 3DSlicer.
- Attach the EM-reference sensor (e.g., NDI Aurora 6DOF Cable Tool) to the 3D model by securing it in the cylinder with glue.
- In 3D Slicer, import the 3D model with pivot-points and allocate the landmark points digitally using the Fiducial Registration Wizard > Place a control Point.
- Perform landmark registration by pinpointing the landmark points in real-life with the EM pointer, press Place a control point and register them in 3DSlicer. Calculate the rigid linear registration transform by pressing Update.
- After registration, apply the registration transform to the 3D model to establish a link between it and the EM-reference sensor. Subsequently, if the 3D model is physically moved, its digital counterpart in 3DSlicer should move; accordingly, confirm this visually by observing the movements.
- See the extensive 3D Slicer and SlicerIGT tutorial (https://www.slicerigt.org/wp/user-tutorial/) for setting up an EM-system with 3D-Slicer.
- Holographic validation
- Launch the device and open the holographic application of step 4.4.5. Subsequently, navigate to the correct patient 3D model, which is also visualized in 3DSlicer.
- Fixate the infrared marker to the correct place using glue, with the fitted 6.4 mm infrared markers (see Table of Materials), as visualized by the preoperative planning.
- Use the EM pointer to digitally pinpoint the target points based on holographic visualization. Save the set of EM sensor coordinates.
- Calculate the error in locating the target landmarks compared to the placed landmarks to quantitatively validate the holographic visualization.
Results
A kidney phantom was used to demonstrate the performance of the infrared-tracking system for organ tracking and to validate the holographic validation setup in moving organs. The complete workflow is outlined in Figure 1.
First, the kidney was semi-automatically segmented based on MRI data using the thresholding tool in 3DSlicer. The resulting 3D model was exported and imported into 3D CAD software to reduce the polygon count. A second model was saved, and five target points were integrated into this model using the sphere tool (Figure 2). This model was used for the technical validation of the holographic display. The first version of the model, without target points, was imported into Autodesk Fusion. Five pivot points were integrated into this model, and the cylinder was integrated to facilitate the EM sensor. Using 3D slicing software, the 3D model was prepared for 3D printing. TPU with a print density of 8% was used to create a minimally flexible kidney surface.
A standardized infrared marker was designed, 3D-printed, and fitted with infrared reflective spheres (6.4 mm diameter). From this infrared marker, the coordinates of the infrared marker were measured in correlation to the center point. Inside the game development software application, the JSON file containing the coordinates of the infrared marker was imported. Secondly, the 3D model of the kidney was imported, with target points for validation purposes. Also, for visualization purposes, the infrared marker model was imported and translated to the position of the points implemented by the JSON file. The 3D model was transformed to the center of the infrared marker (Figure 3), and additional shaders were applied. After integrating the patient menu scene, the application was deployed on the HMD.
Based on the placement of the IR-markers, the holographic 3D model is visualized on the kidney inside a pediatric abdominal phantom using the HMD (Figure 4). It had a tracking rate of 11.6 Hz. However, for distances exceeding 60 cm, the HMD loses the ability to track the infrared markers. Secondly, the continuous tracking and noise in the infrared-marking tracking causes the holographic overlay to flicker, resulting in inaccurate visualization.
For validation purposes, the EM-tracking system was connected to 3D Slicer through the Plus Server. An EM sensor was placed on the phantom kidney for tracking (Figure 2). After point-based registration, the 3D model was registered with a median accuracy of 0.59 mm, which proved to be an accurate method for validating holographic accuracy (Figure 5). The median Point Localization Error was 8.74 mm (Interquartile Range: 6.38 - 10.85), based on input from three surgeons (Table 1).
The implementation of this AR tracking and visualization system involves a protocol that spans approximately 45-60 min. An experienced technical physician with 2 years of experience executed the entire protocol once to determine the duration of the individual steps of the protocol. Notably, certain steps are only necessary to be executed once. The essential steps for each patient include segmentation, model integration in the game development software, and scene configuration. Segmenting anatomical structures in patient-specific cases requires relatively more time due to the multiple anatomical structures involved, but segmenting the renal parenchyma and tumor can be completed within 30 min. Integrating the segmented 3D models into the application and aligning them with the infrared marker takes approximately 5 min of manual adjustments. Connecting the correct scene requires no more than 5 min. The game development project build time varies depending on hardware specifications but typically takes around 3 min, followed by approximately 10 min for deployment onto the HoloLens 2. Overall, excluding the validation setup, this protocol demonstrates a method for moving organ tracking in preclinical settings.
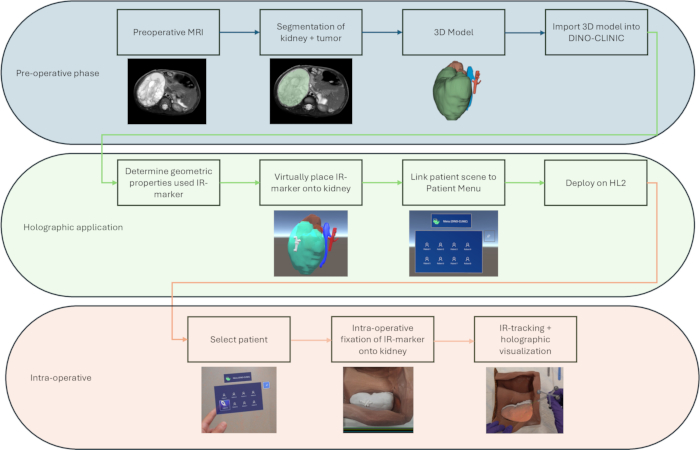
Figure 1: Schematic overview of the workflow. The workflow shows steps that are required per patient in a phantom setting, including the preoperative phase, holographic, and intraoperative phases. The pre-operative phase consists of segmenting (see step 3) pre-operative medical imaging. Preparation of the holographic application consists of virtually planning the infrared marker placement on the 3D model (see step 4). In the intraoperative phase, the surgeons can select the correct patient and fix the infrared marker for holographic visualization and continuous tracking. Please click here to view a larger version of this figure.
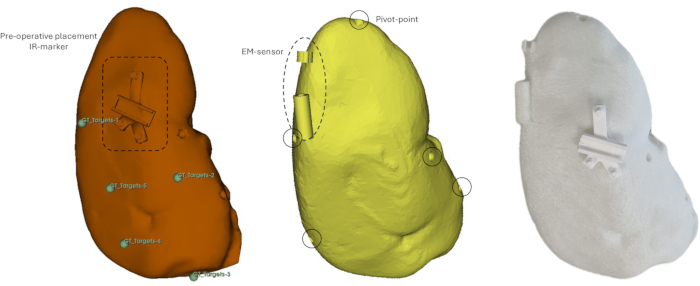
Figure 2: Overview of kidney phantoms used in the validation methodology. Left: a 3D hologram of the kidney with the target points and virtual placement of the infrared marker. Middle: 3D phantom with integrated EM sensor and pivot-points for registration. Right: 3D printed phantom, with the infrared marker and cylinder for the EM sensor, used for the validation procedure. Please click here to view a larger version of this figure.
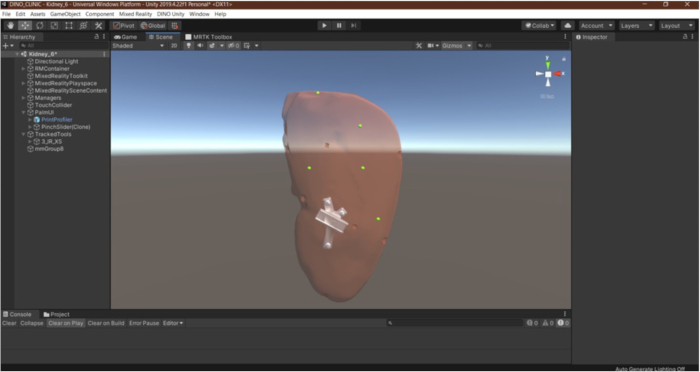
Figure 3: Preparation of the holographic application in the game development software. The kidney model is transformed into an infrared marker. Secondly, shaders are applied to the kidney and to the target points. Please click here to view a larger version of this figure.
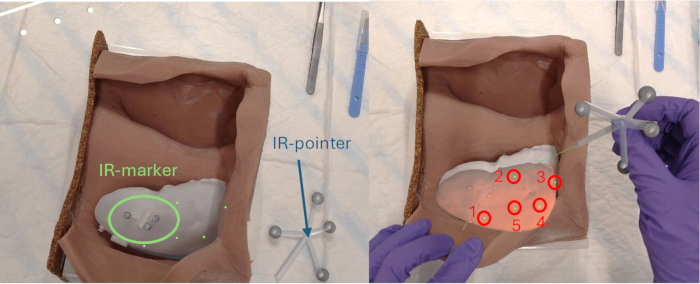
Figure 4: Holographic visualization of the phantom experiment. Left: Placement of the infrared marker on the kidney. Right: Holographic visualization of target points in the correct order (1 to 5). Displacement of the holographic visualization is caused by the jitter in the infrared marker tracking. Please click here to view a larger version of this figure.
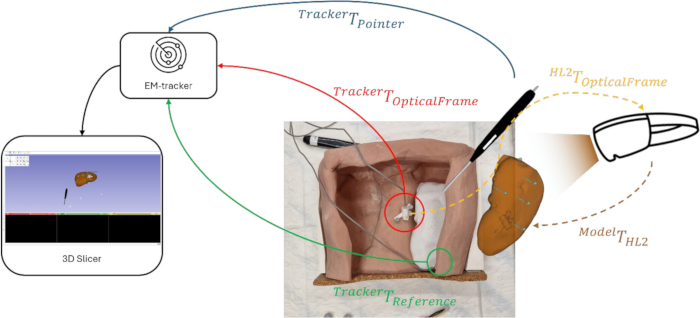
Figure 5: Set-up from the EM-tracking validation protocol for holographic visualization of moving organs. Green, Red, and Blue visualize the transformation of the necessary EM-tools for validation. Yellow and Green visualize the transformation regarding the Head-Mounted Display (HMD). Please click here to view a larger version of this figure.
| Participant | Measurement | GT-X (mm) | GT-Y (mm) | GT-Z (mm) | Point-X (mm) | Point-Y (mm) | Point-Z (mm) | PLE (mm) |
| Surgeon 1 | 1 | -67.02 | 7.88 | 297.50 | -76.72 | 8.97 | 295.49 | 9.97 |
| 2 | -46.77 | 4.78 | 249.67 | -55.71 | -0.26 | 243.61 | 11.91 | |
| 3 | -3.21 | -12.36 | 244.46 | -9.99 | -3.03 | 244.83 | 11.54 | |
| 4 | -15.06 | 1.16 | 273.72 | -20.00 | 2.71 | 272.70 | 5.27 | |
| 5 | -39.00 | 5.40 | 281.25 | -46.82 | 6.91 | 277.75 | 8.70 | |
| Surgeon 2 | 1 | -67.02 | 7.88 | 297.50 | -63.60 | 8.02 | 292.12 | 6.38 |
| 2 | -46.77 | 4.78 | 249.67 | -45.94 | 2.73 | 246.98 | 3.48 | |
| 3 | -3.21 | -12.36 | 244.46 | -5.43 | -10.70 | 244.27 | 2.78 | |
| 4 | -15.06 | 1.16 | 273.72 | -11.87 | 0.80 | 267.51 | 7.00 | |
| 5 | -39.00 | 5.40 | 281.25 | -35.54 | 5.82 | 273.28 | 8.70 | |
| Surgeon 3 | 1 | -67.02 | 7.88 | 297.50 | -62.97 | 7.87 | 287.43 | 10.85 |
| 2 | -46.77 | 4.78 | 249.67 | -44.59 | -0.42 | 242.70 | 8.96 | |
| 3 | -3.21 | -12.36 | 244.46 | 2.23 | -20.32 | 253.48 | 13.20 | |
| 4 | -15.06 | 1.16 | 273.72 | -10.73 | 1.33 | 266.14 | 8.74 | |
| 5 | -39.00 | 5.40 | 281.25 | -34.95 | 5.93 | 271.74 | 10.35 |
Table 1: For each measurement, the ground truth (GT) coordinates of the target landmarks, their corresponding point location coordinates, and the PLE measured for all surgeons are provided.
Discussion
The presented protocol outlines an approach to real-time organ tracking and holographic visualization, including validation for moving tumors and organs in a phantom setting. Leveraging infrared marker-based tracking with an HMD, this method has the potential to better maintain correct anatomical holographic overlays during the manipulation of moving organs. Despite its application for tracking the kidney, this method could also be explored in other clinical fields, such as open surgery for the liver or lungs, with minimal adjustments in the segmentation protocol. Secondly, infrared markers could potentially be used with various surgical techniques, such as laparoscopic surgery. In such cases, infrared reflective stickers could be detected on laparoscopic images to track organs, tools, or anatomical landmarks. However, the application of this technique to other clinical fields or surgical techniques may introduce errors due to variations in deformability of the target organ or technical limitations, such as a limited field of view, which require validation in preclinical experiments.
Step 1 of the protocol is focused primarily on setting up the necessary hardware and software tools. This setup requires numerous applications and steps, so it's crucial that all software packages are installed correctly, including any necessary extensions, to avoid deployment issues downstream. It is not anticipated that different versions of software will cause issues, even though the combination of the game development software and the integrated development environment is crucial.
In step 2, the process of creating customized infrared markers is described. This step becomes particularly important if the tracking will be utilized for other applications. The flexibility to modify the shape of the infrared marker ensures its potential suitability for diverse preclinical applications. Furthermore, users can explore various design options to improve the infrared marker's adherence to the surface of an organ and enhance the accuracy of tracking the infrared marker. Additionally, testing multiple infrared marker diameters can lead to improved detection over distances exceeding 60 cm.
In step 3, patient-specific 3D modeling based on medical imaging is described. Accurate segmentation of the kidney and tumor is crucial, as it directly influences the accuracy of surgical guidance. Poor segmentation may result in misleading visualizations that compromise surgical precision19. Secondly, this step is the most time-consuming. Integrating fully automatic segmentation methods can expedite the protocol, reducing the necessity for manual and semi-automatic adjustments while ensuring precise anatomical segmentation20. Optimizing the polygon count is crucial for achieving optimal AR rendering performance. If this optimization is not performed, the performance of the HMD is significantly compromised.
In step 4, the configuration of the holographic application is outlined, following the implementation of DINO-DLL. One critical aspect is proper alignment between the infrared marker positions and the holographic anatomical models, as this affects manual registration accuracy. Especially, the lever effect should be minimized to prevent inaccuracy at further distances from the center of the infrared marker. Further improvements could include implementing additional registration methods. Moreover, the current system exhibits an acceptable tracking rate for continuous visualization, which aligns with literature21. Thirdly, further improvements should involve implementing a Kalman filter to reduce noise in the infrared marker tracking data, thereby eliminating the jitter of holographic visualization.
In step 5, the framework provides a holographic validation method utilizing EM tracking. This protocol is useful for validating the accuracy of holograms in a phantom setting, as it provides a quantitative assessment of holographic accuracy for moving organs. A crucial step here is the precise integration of EM-tracking sensors within semi-deformable 3D-printed phantoms. Users must ensure accurate calibration of the EM sensors and landmark registration in 3D Slicer. If validation errors occur, re-registration or removing any metallic objects could enhance the validation accuracy. To further validate the clinical feasibility, ex vivo organs could be employed to more accurately simulate the surgical tissue22.
This protocol serves as a comprehensive guide for researchers aiming to implement AR solutions for organ tracking and validate these systems in phantom experiments. Additionally, it provides a broadly applicable validation setup that can be easily utilized across different clinical scenarios, particularly for validating AR methods for moving organs. Given the complexity of deploying holographic applications, this framework facilitates the transition from conceptual AR-based solutions to preclinical validation.
Disclosures
The authors have nothing to disclose.
Acknowledgements
We thank Hisham Iqbal for his expertise and support in establishing infrared marker tracking using the HoloLens 2, based on the open DINO-DLL repository.
Materials
| Name | Company | Catalog Number | Comments |
|---|---|---|---|
| 3D Slicer (v5.6.2) | Slicer | N/A | Medical image segmentation software and necessary for electromagnetic tracking validation |
| 6.4 mm (1/4") M3 Markers Infrarec Markers | OptiTrack | N/A | Infrared reflective spheres which should be attached to marker for tracking |
| Autodesk Fusion 360 (v2.0.21508) | Autodesk | N/A | CAD software for designing infrared markers and phantoms |
| Bambu Studio (v01.09.07.52) | Bambu Lab | N/A | 3D printing slicing software for Bambu 3D printers |
| Bambu X1 Carbon | Bambu Lab | N/A | 3D printer used for infrared markers and phantom models |
| HoloLens 2 | Microsoft | N/A | Augmented Reality Head-Mounted Display for AR visualization |
| IRTrackingOrgans_HoloLens | Open source | N/A | Unity-based application supporting IR marker tracking |
| MeshMixer (v3.5.0) | Autodesk | N/A | Used for mesh editing and polygon reduction |
| NDI Aurora | Northern Digital Inc. | N/A | Electromagnetic tracking system for validation |
| NDI Aurora 6DOF Cable Tool | Northern Digital Inc. | N/A | Sensor for registering movement of phantom organs |
| NDI Aurora 6DOF Probe | Northern Digital Inc. | N/A | Used to identify landmark locations on the phantom |
| Polylactic Acid Filament | Any Manufacturer | N/A | Filament for printing rigid parts like infrared markers |
| Thermoplastic Polyurethane Filament | Any Manufacturer | N/A | Semi-flexible filament for printing deformable kidney phantom |
| Unity Hub (v3.11.1) and Unity (v2019.4.22f1) | Unity Technologies | N/A | Game development software for AR application development and deployment |
| Visual Studio 2019 | Microsoft | N/A | Required IDE for Unity integration and deployment |
References
- Bortot, B., et al. Image-guided cancer surgery: a narrative review on imaging modalities and emerging nanotechnology strategies. J Nanobiotechnol. 21 (1), 155(2023).
- Liu, Q., Luo, D., Cai, S., Li, Q., Li, X. Circumferential resection margin as a prognostic factor after rectal cancer surgery: A large population-based retrospective study. Cancer Med. 7 (8), 3673-3681 (2018).
- Cost, N. G., et al. Pathological review of Wilms tumor nephrectomy specimens and potential implications for nephron sparing surgery in Wilms tumor. J Urol. 188 (4 Suppl), 1506-1510 (2012).
- Taghavi, K., Sarnacki, S., Blanc, T., Boyer, O., Heloury, Y. The rationale for nephron-sparing surgery in unilateral non-syndromic Wilms tumour. Pediatr Nephrol. 39 (4), 1023-1032 (2024).
- Mezger, U., Jendrewski, C., Bartels, M. Navigation in surgery. Langenbecks Arch Surg. 398 (4), 501-514 (2013).
- Herrlich, M., et al. Instrument-mounted displays for reducing cognitive load during surgical navigation. Int J Comput Assist Radiol Surg. 12 (9), 1599-1605 (2017).
- Portnoy, Y., et al. Three-dimensional technologies in presurgical planning of bone surgeries: current evidence and future perspectives. Int J Surg. 109 (1), 3-10 (2023).
- Meulstee, J. W., et al. Toward Holographic-Guided Surgery. Surg Innov. 26 (1), 86-94 (2019).
- Glas, H. H., et al. Augmented Reality Visualization for Image-Guided Surgery: A Validation Study Using a Three-Dimensional Printed Phantom. J Oral Maxillofacial Surg. 79 (9), 1943.e1-1943.e10 (2021).
- Fitski, M., et al. MRI-Based 3-Dimensional Visualization Workflow for the Preoperative Planning of Nephron-Sparing Surgery in Wilms' Tumor Surgery: A Pilot Study. J Healthcare Eng. 2020 (1), 8899049(2020).
- van der Zee, J. M., et al. Virtual Resection: A New Tool for Preparing for Nephron-Sparing Surgery in Wilms Tumor Patients. Curr Oncol. 29 (2), 777-784 (2022).
- Fida, B., Cutolo, F., di Franco, G., Ferrari, M., Ferrari, V. Augmented reality in open surgery. Updates Surg. 70 (3), 389-400 (2018).
- Moreta-Martinez, R., et al. Augmented reality in computer-assisted interventions based on patient-specific 3D printed reference. Healthc Technol Lett. 5 (5), 162-166 (2018).
- van Doormaal, T. P. C., van Doormaal, J. A. M., Mensink, T. Clinical Accuracy of Holographic Navigation Using Point-Based Registration on Augmented-Reality Glasses. Oper Neurosurg (Hagerstown). 17 (6), 588-593 (2019).
- Zhao, Z., et al. Augmented reality technology in image-guided therapy: State-of-the-art review. Proc Inst Mech Eng H. 235 (12), 1386-1398 (2021).
- Doughty, M., Ghugre, N. R., Wright, G. A. Augmenting Performance: A Systematic Review of Optical See-Through Head-Mounted Displays in Surgery. J Imaging. 8 (7), 203(2022).
- Vávra, P., et al. Recent Development of Augmented Reality in Surgery: A Review. J Healthcare Eng. 2017, 4574172(2017).
- Iqbal, H., Baena, F. R. Semi-Automatic Infrared Calibration for Augmented Reality Systems in Surgery. 2022 IEEE/RSJ Int Conf Intelligent Robots Syst (IROS). , 4957-4964 (2022).
- Zhao, W., Jiang, D., Queralta, J. P., Westerlund, T. Multi-Scale Supervised 3D U-Net for Kidneys and Kidney Tumor Segmentation. arXiv. , (2020).
- Elloumi, N., et al. CT Images Segmentation Using a Deep Learning-Based Approach for Preoperative Projection of Human Organ Model Using Augmented Reality Technology. Int J Comp Intel Appl. 22 (02), 2350006(2023).
- von Haxthausen, F., Moreta-Martinez, R., Pose Díez de la Lastra, A., Pascau, J., Ernst, F. UltrARsound: in situ visualization of live ultrasound images using HoloLens 2. Int J Comput Assist Radiol Surg. 17 (11), 2081-2091 (2022).
- Towards an accurate tracking of liver tumors for augmented reality in robotic assisted surgery. Haouchine, N., et al. 2014 IEEE Int Conf Robotics Automat, , 4121-4126 (2014).
Reprints and Permissions
