This paper outlines the protocol for qualitatively and quantitatively validating a university service-learning instrument, following the parsimony criterion to create the most robust and optimal version possible. The Delphi qualitative validation method and Robust Unweighted Least Squares Exploratory Factor Analysis, as a quantitative item optimization method, are utilized for this purpose.
A subscription to JoVE is required to view this content. Sign in or start your free trial.
Method Article
Qualitative and Quantitative Validation of Tools with Rating Scales Aimed at Assessing the Quality of University Service-Learning
In This Article
Summary
Abstract
Service-Learning (SL) has become a highly effective learning methodology in recent years, bridging the gap between theory and practice while contextualizing learning in real-world scenarios. It has been successfully implemented across all levels of higher education, resulting in notable improvements in university students' skills. However, as a transformative methodology, SL is still in the early stages of development in terms of assessment methods. Consequently, there is a pressing need to design and validate reliable and, above all, valid measurement instruments, as the application of SL to real-world contexts is its primary value. This paper demonstrates how to optimally design and validate university SL instruments to evaluate the quality of the SL experiences at the university level from the point of view of university professors, guided by the principle of parsimony. The online modified Delphi method, Robust Unweighted Least Squares Exploratory Factor Analysis, and Confirmatory Factor Analysis have been applied to create a new instrument, the QaSLu-27, validated through a sample of 16 experts using the online modified Delphi method and 118 university teachers who implement SL projects. The results show optimal psychometric conditions for the new instrument (W = 0.11; α = 0.92; CMIN/DF=1.027; CFI= 0.979; WRMR= 0.0985; RMSEA= 0.046), leading to the development of new rating scales that allow comparisons of future users of this methodology, considering their attributional and demographic characteristics. The design of new validated instruments, capable of being used in the real world and allowing the creation of scales, will be very useful to measure the implementation of new experiences in SL, to evaluate their progress, their participants, their managers and their monitors, contributing to the establishment of this field of study in the current academic framework and in the generation of new scientific knowledge.
Introduction
Service-Learning (SL), an educational approach that integrates academic learning with community service, has increasingly gained recognition in contemporary education. This pedagogical approach enables students to apply classroom knowledge to real-world challenges, while also fostering civic responsibility and community engagement1. The significance of SL in current education cannot be overstated, as it equips students with practical professional competencies, promotes civic engagement, and provides a deeper understanding of social issues2.
Recent research on SL has grown significantly, fueled by increasing acknowledgment of its potential to enhance both academic learning and community involvement. This growth is driven by the rising demand for educational models that not only promote academic development but also address societal challenges3. Students have explored the diverse impacts of SL, from promoting social justice to cultivating civic-mindedness among students4. Additionally, service-learning research has increasingly focused on its application in specific fields such as STEM, healthcare, and environmental science, where real-world problem-solving is critical5,6,7. As the body of literature expands, researchers are also beginning to explore how service-learning can effectively bridge the gap between theory and practice in ways that are meaningful to both students and the communities they serve8.
However, despite its growing role, significant challenges remain in measuring the effectiveness of SL programs9. There are various proposals in the form of a rubric, such as those of Furco10, Martín et al.11, Lorenzo and Belando-Montoro12, Shek et al.13, or Lu and Lambright14, which, despite their proven usefulness in field studies, have not yet been validated. On the other hand, there are other proposals, such as those of Escofet-Roig et al.15, Rodríguez-Izquierdo16, León-Carrascosa et al.17, Ruiz-Ordoñez et al.18, Santos-Pastor et al.19, or Gul et al.20 that lack qualitative validation or present very limited quantitative validations. Other shortcomings observed in previous assessment tools are the lack of optimization of factors and items to comply with the principle of parsimony and the complete lack of rating scales. This situation is common in new scientific fields and is the natural process that all areas of study go through to achieve optimal instruments for widespread use.
At the time of the creation of the Questionnaire for the Self-Assessment of University Service-Learning Experiences (QaSLu) a tool to evaluate the quality of the SL experiences at university level from the point of view of university professors, the most recognized tools that defined the standards for ensuring the quality of SL experiences were the following: Campo (2015)21, Europe Engage (2017)22, GREM (2014)23, RMC Research Corporation (2008)24, Puig-Rovira, Martín, and Rubio-Serrano (2017)25, and Rubio-Serrano, Puig-Rovira, Martín, and Palos (2015)26. While there are now additional tools, current measurement instruments often fail to adequately capture the broad and nuanced learning outcomes associated with these programs, especially in terms of long-term personal growth, community impact, with some found to be overly general or not based on rigorous scientific frameworks9,27. This gap in measurement tools hinders a comprehensive understanding and optimization of the impact of SL on both students and communities.
The next step in advancing SL research involves developing scientifically rigorous measurement instruments. These tools should be designed not only to capture academic outcomes but also to assess the personal and social impacts that SL can have on students and the communities they serve. Our research aims to address this gap by creating an instrument grounded in scientific rigor, offering a more comprehensive evaluation of SL projects and guiding their future implementation.
In addition to creating the instrument, it will be validated, first qualitatively and then quantitatively. For the initial validation, the modified online Delphi method will be used28. The term "modified" refers to Cabero's proposal to limit the Delphi method to two rounds of consultation, thereby avoiding dropout among the expert group members. The term "online" was introduced by Cruz-Ramírez and Rúa-Vásquez29 to highlight that consultations were conducted via email, as the Internet helps overcome certain limitations inherent in traditional Delphi, such as groupthink or the influence of dominant expert opinions, which could affect item selection30,31.
Using the modified online Delphi method, two types of validity will be assessed: construct validity, following the process outlined in Bakieva et al.'s study32, where experts are consulted on the relevance of each item, and content validity, based on the work of Gil and Pascual-Ezama33, which evaluates the clarity of each item through expert consultation.
Experts will be provided with a Likert scale containing four response options (none, little, quite a lot, a lot). By not introducing any intermediate response alternatives, experts are required to take a definitive position in favor of or against each item34, thus facilitating the decision-making process on whether to retain or remove items in the questionnaire.
Regarding quantitative validation, it is based on the law of parsimony, a fundamental principle in science that states that, given a scientific problem, under equal conditions, the shortest solution is preferable35,36. Therefore, the search for the shortest and most optimized valid instrument offers the same scientific guarantees, being more practical, exportable and general for everyday use in real contexts without sacrificing reliability or validity. Confirmatory Factor Analysis (CFA)37 and Robust Unweighted Least Squares (RULS) Exploratory Factor Analysis38,39 will be used as analytical techniques to reduce unnecessary items and validate the final structure of the instrument. Fit and reliability indices are used as indicators of the validity of the new structure with respect to the previous one, taking as a reference to maintain or improve the reliability and validity of the optimized instrument within the levels that guarantee the adequacy and robustness of the new structure of the reduced and optimized questionnaire.
Access restricted. Please log in or start a trial to view this content.
Protocol
This protocol was ethically approved in 2020 by the National Commission for Scientific and Technological Research of Chile (CONICYT Fondecyt/Initiation) under approval number: 11170623. A group of external experts reviewed and validated the entire process. In accordance with the Declaration of Helsinki40, participants were required to provide written informed consent to participate in the study, and it was clearly communicated that they would not be involved in any experimental condition.
1. Designing the first draft of a QaSLu
- Conduct a content analysis of the items from the primary tools recognized for evaluating SL experiences. To achieve this, the items from international tools defining standards for ensuring the quality of SL experiences, as well as the primary rubrics recognized by the SL expert community, were reviewed.
NOTE: As a result of this review, QaSLu explicitly addresses social justice, a characteristic focus of European SL. - Categorize all items based on the phases involved in designing SL experiences (1. Design, 2. Implementation, 3. Evaluation) and the application of SL experiences (A. Initial Phase, B. Planning, C. Execution, D. Closure and Replication).
NOTE: To ensure the reliability of the categorization, absolute inter-rater agreement was used, accepting only those categorizations where all authors concurred. - Select the final items for the first draft of the instrument to evaluate University Service-Learning (USL).
- First, eliminate duplicate items within each category, both in the phases related to the design and application of SL experiences.
- Second, remove non-relevant items that do not align with the objectives of the new instrument are removed.
- Finally, create or adapt items to suit the target population (university faculty) and the study's objectives (evaluating the quality of SL experiences).
NOTE: QaSLu is designed for university service-learning. While most tools evaluated the quality of SL at the university level, some items from previous tools had to be reformulated, and new items were created to ensure QaSLu was fully adapted to the university context.
- Design the first draft of the questionnaire to meet the goals of the study.
NOTE: The draft of QaSLu was created using Microsoft Word for ease of sharing and modification. Initially, it consisted of 54 items answered via a 5-point Likert scale (Never, Rarely, Sometimes, Almost Always, Always). The questionnaire was designed with a single factor or main component structure in mind so that its final score could be used to compare users according to their characteristics by means of standardized rating scales.
2. Selection of the expert group for the Delphi method
- Select a large sample of experts in USL who could evaluate the instrument designed previously. In this process, establish essential inclusion criteria: 1. A minimum of four years of experience in researching and designing/implementing USL experiences; 2. Membership in a university academic body; and 3. Being a doctoral candidate or holder of a doctoral degree.
NOTE: Based on the inclusion criteria, a list of 20 experts who could play a prominent role in the USL community was created. - Send an email to all experts selected in step 2.1, explaining the research objectives, the phases of the Delphi method, the expected timelines, the inclusion criteria, and asking about their availability and willingness to participate in the validation process, along with their acceptance of the written informed consent.
NOTE: All experts agreed to participate. - Configure the final expert group to evaluate the definitive instrument for assessing USL. Establish the new inclusion criteria based on the characteristics of the experts who agreed to participate. The final configuration of the expert group aimed for: 1. Academic and professional diversity, i.e., representation from different academic strata; 2. Geographic diversity in the locations where SL experiences were conducted; and 3. Gender diversity.
NOTE: Sixteen USL experts committed to and completed the process in its entirety. The final expert group consisted of 75% women and 25% men.
3. Qualitative validation of the QaSLu questionnaire via the Modified Online Delphi Method
- Send an email to each member of the expert group with a template to assess the items of the first draft of the instrument for evaluating USL, along with the relevant instructions (Round 1 of the Delphi Method).
NOTE: The experts assess the relevance (construct validity) and clarity (content validity) of each item using a 4-point Likert scale, where 1 represents "not relevant or not clear" and 4 represents "very relevant or very clear." Next to each item, there is one box to evaluate relevance and another for clarity-where the experts must rate each item on a scale from 1 to 4. Below these boxes, a further section allows them to qualitatively explain their assessment and suggest possible revisions to the items (see a sample draft of the questionnaire provided as Supplementary File 1). By not including any intermediate response options, experts were forced to take a definitive stance, which facilitated the decision-making process regarding the retention or removal of items in the questionnaire. - Collect the responses from the experts for Round 1 of the Delphi consultation in a single file.
NOTE: Experts were given 2 weeks to complete the evaluation of the relevance (construct validity) and clarity (content validity) of the 54 items in the template. - Calculate the Kendall coefficient to determine the level of agreement between the experts' responses regarding relevance and clarity.
- First access the menu Analyze > Nonparametric Tests > Legacy Dialogs > K Related Samples (see Figure 1). Select all responses from the experts regarding relevance and clarity. Do this separately, first relevance and then clarity.
- Move items to the Test Variables List box. In the Test Type section, select the Kendall's W option. Finally, click OK to run the analysis and obtain the corresponding results.
NOTE: The concordance analysis revealed that there was statistically significant agreement among the experts questioned on relevance (construct validity) and clarity (content validity).
- Assess the construct validity (relevance) and content validity (clarity).
- Perform a descriptive analysis using statistical software package 1. First, select the Analyze menu > Descriptive Statistics > Frequencies, and in the Frequencies dialog box, select the relevance scores for all items of the instrument and add them to the Variable(s) box by clicking the arrow icon.
- Then, click the Statistics icon, check the Percentile(s) box, and add the percentiles 25, 50, and 75 to the Frequencies: Statistics dialog box, then click Continue to return to the Frequencies dialog box.
- Finally, click the OK icon to generate the desired percentiles for each item (see Figure 2). After the output, go to Analyze > Descriptive Statistics > Descriptive, and in the Descriptives dialog box, select the clarity scores for all items of the instrument and add them to the Variable(s) box by clicking the arrow icon (see Figure 3). Finally, click OK to generate the results.
- Remove any items that 75% of the experts consider highly irrelevant and reformulate items that were rated as highly relevant but unclear.
NOTE: After the first round of consultation, 10 items were removed from the initial draft of QaSLu: items 4, 5, 9, 16, 27, 45, 51, 52, 53, and 54. Additionally, 16 items from the first draft of QaSLu were reformulated: items 1, 2, 10, 13, 14, 15, 23, 30, 31, 33, 37, 41, 42, 43, 48, and 49. The reformulation or rewording was based on the experts' suggestions. - Prepare a results report for Round 1 of the consultation that includes the following: 1. The result regarding the level of agreement on relevance or construct validity (Kendall's coefficient); 2. The decision-making criteria established; 3. The number of validated items; 4. The number of items removed; 5. The number of reformulated items still under review; and 6. The modified version of the instrument for evaluating USL.
NOTE: The purpose of creating this report was to inform the expert group without overwhelming them with excessive data and without influencing their future evaluations. - Send an email to each member of the expert group with the report on the results of Round 1 of the consultation, along with a template to evaluate the reformulated items in the modified version of the instrument for evaluating USL, with specific instructions (Round 2 of the Delphi Method).
NOTE: The experts evaluate the clarity (content validity) of each reformulated item using a 4-point Likert scale, where 1 represents "not relevant or not clear" and 4 represents "very relevant or very clear." Next to each item, there is a box for rating clarity with a number from 1 to 4, followed by another section where they can qualitatively explain their evaluation and propose possible further revisions to the item (see a sample draft of the questionnaire provided as Supplementary File 2). By not introducing any intermediate response options, the experts were compelled to take a definitive stance, either in favor or against the items. This facilitated the decision-making process regarding the inclusion or exclusion of items from the questionnaire. - Compile the responses from the experts in Round 2 of the Delphi consultation into a single file.
NOTE: The experts were again given two weeks to complete their evaluation of the clarity (content validity) of the 16 items in the template. - Repeat the steps in 3.3, but this time select only the clarity scores for the reformulated items of the instrument and incorporate them into the Variable(s) box.
- Repeat the steps in 3.4, removing all items that were rated as highly clear by 75% of the experts.
NOTE: Following the second round of consultation, the following items were removed: items 1, 23, 31, and 41. - Include several control items with the objective of evaluating internal consistency in the future (it is recommended to include approximately one control item for every 10 items).
NOTE: Four control items were added to this version of the instrument. - Prepare a results report for Round 2 of the consultation, which includes the following: 1. The result regarding the level of agreement on clarity or content validity (Kendall's coefficient); 2. The decision-making criteria established; 3. The number of validated items; 4. The number of items eliminated; 5. The number of items included as control items; and 6. The modified version of the QaSLu-45 (41 validated items + 4 control items).
NOTE: The final version of the questionnaire was structured as follows: 1) Purpose of the questionnaire, written informed consent, and instructions; 2) Organization or institution, gender, age, level of education, and years of professional experience in service-learning of the respondent (this information does not allow for participant identification); 3) Data on the service-learning experience; 4) 45 items for self-assessment of service-learning experiences; and 5) Appreciation for participation (a sample draft of the questionnaire is provided as Supplementary File 3). - Send the results report from the second round of consultation to the expert group, containing the final version of the designed questionnaire (QaSLu-45), and thank them for their participation in the modified online Delphi Method.
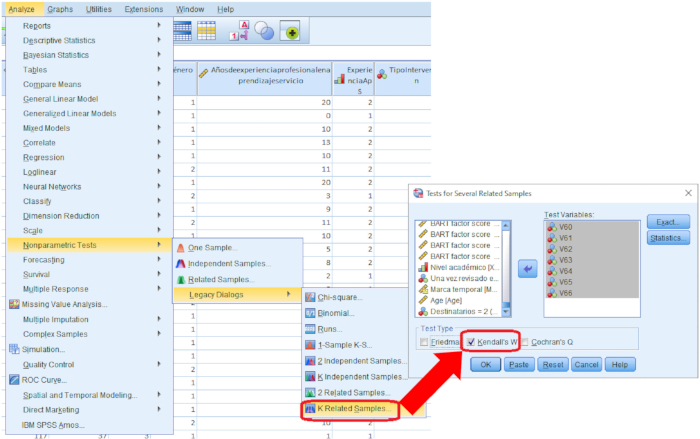
Figure 1: Calculating Kendall's coefficient in the statistical software package 1. (1) Click on K Related Samples icon; (2) Select Kendall's W; (3) click on the OK icon. Please click here to view a larger version of this figure.
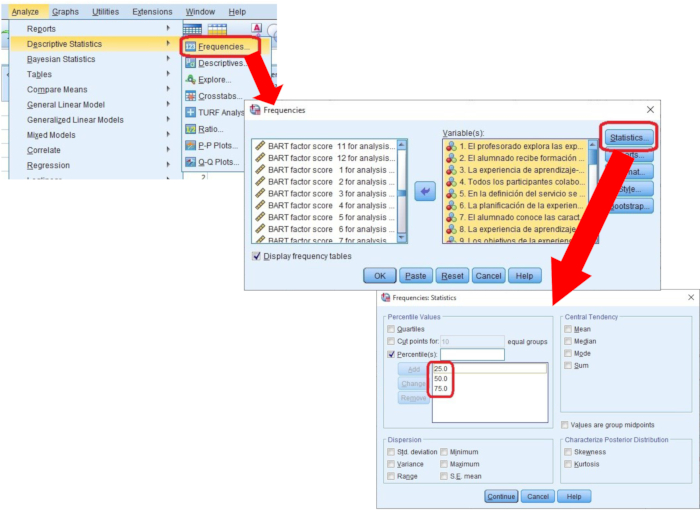
Figure 2: Extracting percentiles in statistical software package 1. (1) Click on the Frequencies icon; (2) Click on Statistics icon; (3) in the Frequencies: Statistics dialogue box, add the percentiles. Please click here to view a larger version of this figure.
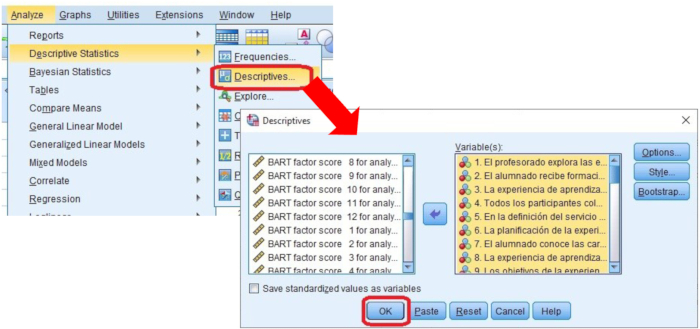
Figure 3: Extracting descriptives in statistical software package 1. (1) Click on the Descriptive icon; (2) Add the Variable(s); (3) click on the OK icon.
4. Adapting the questionnaire to the online specification of a secure server
- Go Navigate to the main page of the software-as-a-service (SaaS) platform with a private server (see Table of Materials) as a registered user. This registration must be completed in advance by providing personal data. Once registered, select Create your survey from scratch (see Figure 4).
- Create the first page, which must include mandatory acceptance informed consent to proceed.
- Create the second page with participant attributional questions, which will be used in the research as intervening or control variables in the research.
NOTE: This study includes the analysis of three discrete quantitative variables and five nominal categorical variables. Below is the operational description of these eight variables included in the study:
Sex: A nominal, attributive, and dichotomous variable with two levels (male/female).
Age: A discrete quantitative variable that determines the participant's age in the study.
USL Experience: A discrete quantitative variable that measures the participant's service-learning experience. The scale starts at 0, representing less than one year of experience in service-learning (which is not equivalent to 'no experience'), with no upper limit.
Academic Level: A nominal, dichotomous variable with two levels (PhD/Not PhD), reflecting whether the participant holds a professional doctorate.
Collaborating Organization for USL Activity: A nominal variable with five levels (Social centers, NGOs, Foundations, Schools, Alliances with Higher Education Institutions or Universities, Government public administrations, Senior centers, and other health-related centers). This variable identifies the type of organization or institution with which the participant collaborates in the service-learning experience.
Target Group of the USL Activity: A nominal variable with five levels (Groups with disabilities, Students, Ethnic minorities, Elderly individuals, Disadvantaged groups at social risk). This variable identifies the primary beneficiary group of the service-learning activity.
Mode of Intervention for the USL Activity: A nominal, dichotomous variable (Exclusively face-to-face service-learning / Includes online activities in whole or part). This variable indicates whether the service-learning activity involves an online component. - Create several pages for the previously designed questionnaire, including the questions and possible answers, through the SaaS platform with a private server.
- After creating and saving the survey (see the final questionnaire in Supplementary File 2), return to the main menu of the platform, select the questionnaire, and click on the icon Open > Close Public Survey to make it available to participants. Then, click on the Obtain a Link to the Survey icon, choosing from several options for participant access (e.g., a link embedded in an email or on a website, an iframe on a website, a pop-up on a website, or a link provided to computers of a call center, see Figure 5).
NOTE: The final version of the questionnaire was structured as follows: 1) Purpose of the questionnaire, written informed consent, and instructions; 2) Participant details (institution or organization, age, gender, educational level, and years of professional experience in service-learning). This information ensures participant anonymity; 3) Data on the service-learning experience; 4) 45 items for self-assessment of service-learning experiences; and 5) A section expressing gratitude for participation.
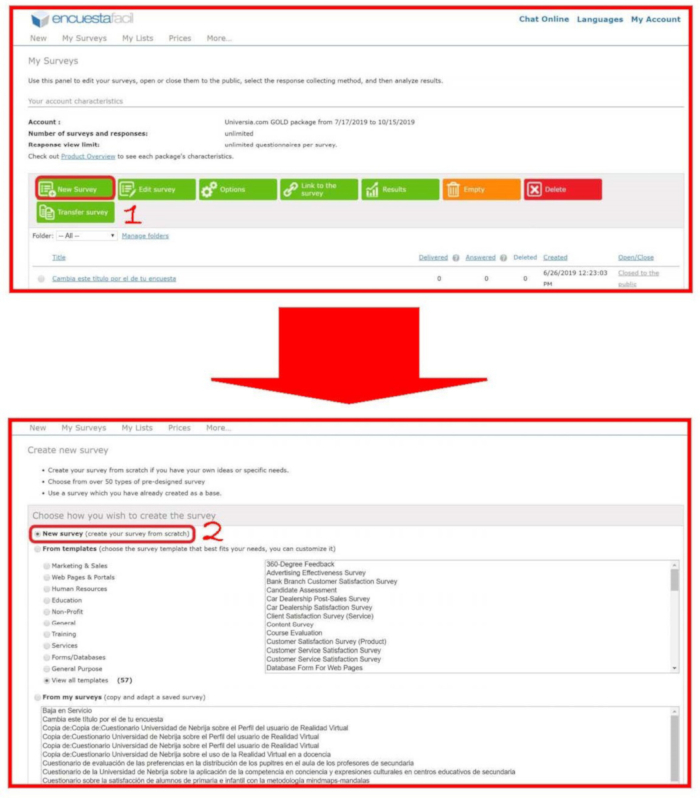
Figure 4: Creating the questionnaire from scratch. (1) Click on the New Survey icon; (2) Select Create Your Survey from Scratch. Please click here to view a larger version of this figure.
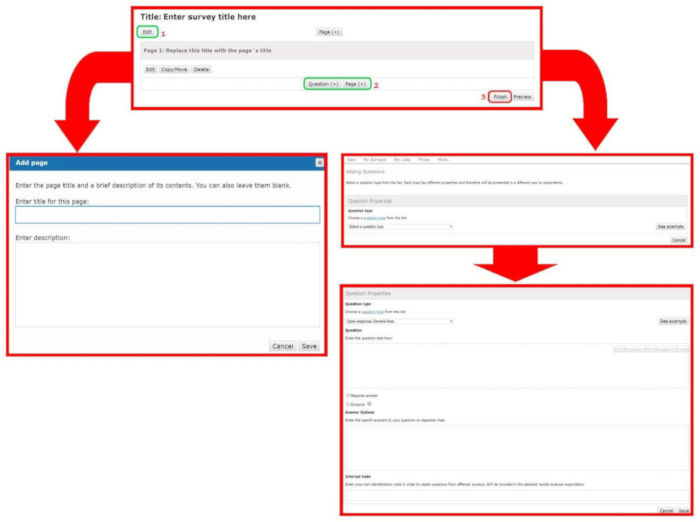
Figure 5: Designing the questionnaire. (1) Edit the survey; (2) Add and configure pages and questions; (3-5) Develop pages, questions, and answers. Please click here to view a larger version of this figure.
5. Sampling method
- Review all proceedings from conferences organized by the Spanish Network of University Service-Learning over the past 3 years. Compile a list of authors who have worked on service-learning in recent years and collect their email addresses.
NOTE: The sampling was incidental and opportunistic. - Send an email to all authors inviting them to participate in the study. Resend the email one and two weeks later.
NOTE: The email encouraged recipients to forward it to contacts who might be interested in participating. Thus, the incidental sampling method was complemented by a snowball sampling technique. - Access the main page of the SaaS platform as a registered user, select the created questionnaire, and click on Results. In the pop-up menu, click the Questionnaire icon to directly access the completed questionnaires. Eliminate any incomplete or erroneous responses through the SaaS platform (see Figure 6).
- Once the questionnaires reach the required minimum number of participants (>100), after excluding incomplete responses, navigate to the main page of the SaaS platform as a registered user, select the questionnaire, and click on the Open/Close Public Survey icon to close the survey and prevent any further participation (see Step 1 in Figure 5 again).
NOTE: A total of 118 educators from 43 higher education institutions participated, with 67.80% identifying as women and 32.20% as men. The average age was 46.16 years (SD = 9.60), with ages ranging from 24 to 65. Regarding academic qualifications, a significant majority (76.3%) held a doctoral degree, while the remaining participants had at least a bachelor's degree. In terms of service-learning experience, the average was 6.69 years (SD = 5.39 years), with the lowest recorded at half a year and the highest at 34 years. The institutions with which the participants' universities collaborated included educational centers (including other universities), social centers, senior citizen centers, health centers, NGOs, foundations, and government agencies such as town halls and councils. Service-learning partnerships were formed with two types of institutions: formal education centers, comprising 50.85% of the sample, and non-formal education centers, comprising the remaining 49.15%. Concerning the modality of the service-learning experiences, 64.41% were face-to-face, while 35.59% involved some form of virtual activity.
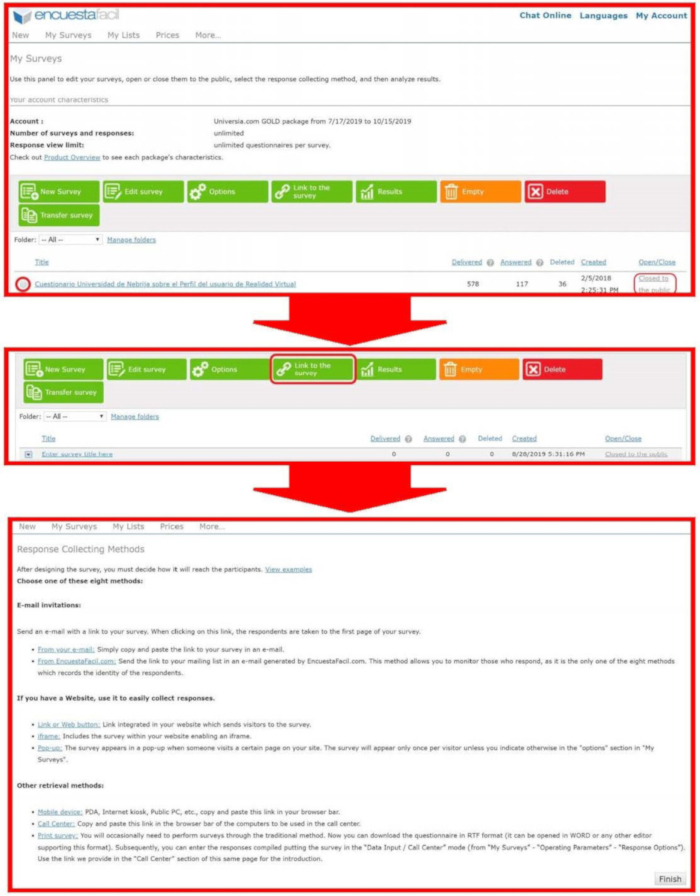
Figure 6: Obtaining a link to the survey. (1) Open the survey; (2) Click on the Obtain a Link to the Survey icon; (3) Select the desired method. Please click here to view a larger version of this figure.
6. Quantitative validation of the questionnaire by factor analysis
- Navigate to the main page of the SaaS platform as a registered user, select the created survey, and click on the Results icon. In the pop-up menu, click on Export and select the detailed report options (advanced spreadsheet format), in Text, with a comma separated values (.csv) extension (see Figure 7). Once the participants complete the questionnaires, export the data to an email account in .csv format, ensuring it is stored in a secure, private, and protected location.
- Open statistical software package 1 (see Table of Materials) and select File Menu > Import Data > CSV Data. Choose the previously saved .csv file. This process transforms the anonymous data into the required analysis format for statistical software package 1 (see Figure 8).
- Select the variables to be analyzed statistically (Gender, Age, Educational Qualification, Collaborating Organization of the USL Activity, Target Group of the USL Activity, Mode of Intervention for the USL Activity, and the 45 items from the QaSLu), and remove any irrelevant data imported through the .sav file generated by statistical software package 1.
- Assess the internal consistency of the QaSLu-45 questionnaire using Cronbach's Alpha with statistical software package 1. To do this, select the Analyze Menu > Scale > Reliability Analysis, and transfer all the relevant variables into the Reliability Analysis dialogue box. Finally, click the OK button to generate the desired output (see Figure 9).
NOTE: The questionnaire demonstrated high reliability and internal consistency, as measured by Cronbach's Alpha (α = 0.917). - Perform the exploratory factor analysis using statistical software package 1.
- To conduct this analysis, select Analyze Menu > Dimension Reduction > Factor. In the Factor Analysis dialogue box, select all the items from the questionnaire, then click on Descriptives and select Univariate Descriptives and KMO and Bartlett's Test of Sphericity.
- Click on Continue to return to the main menu of the Factor Analysis dialogue box. Next, click on Extraction and select Principal Components as the extraction method.
- Check the options for Unrotated Factor Solution and Scree Plot, then click on Continue again to return to the main menu of the Factor Analysis dialogue box. Finally, click on the OK icon to generate the output (see Figure 10).
NOTE: The significance of Bartlett's Test of Sphericity (χ2 = 2689.72; p = 0.00) and the Kaiser-Meyer-Olkin (KMO) Sampling Adequacy Test (KMO = 0.793) confirm the appropriateness of this factor analysis due to the strong design of the items and the sampling for the validation of QaSLu-45. The results of the principal component analysis revealed 13 components with eigenvalues greater than 1.0, explaining 69.95% of the total variance. However, the scree plot (see Figure 11) shows that the first component has such disproportionate relevance that the significance of the remaining components becomes negligible. Therefore, it is recommended to reduce the QaSLu-45 to a single component, thus obtaining a unique final score for the designed QaSLu-45.
- Convert the result file of the questionnaire, excluding attribute variables, to the ASCII fixed format (dat), compatible with statistical software package 2 (see Table of Materials).
- First remove all attribute variables, leaving only the questionnaire items as variables in statistical software package 1. Then, select File Menu > Export Data > Fixed Text (see Figure 12).
- Save the file in a secure location with a recognizable name. This process transforms the anonymous data into the required format for analysis in statistical software package 2.
- Perform Confirmatory Factor Analysis (CFA) with statistical software package 2 to determine the goodness of fit for the one-factor model of the questionnaire.
- To conduct this analysis, select Read Data, then in the Sample dialogue box, click Browse and select the previously created ASCII file. The number of participants and variables will be displayed green in the Size of Data Matrices section.
- Next, click on the Open Single Group Dataset icon and return to the main menu of statistical software package 2. In the Main Menu, click on Configure Analysis. In the Dialog Menu, check Confirmatory Factor Analysis and click on the Confirm button.
- In the CFA: Factor Analysis Configuration window, accept the default settings and click Confirm to return to the main menu. Finally, a message "Confirmatory Factor Analysis Ready" will be seen in the Main Menu; then, click the Compute button (see Figure 13) and wait for the results.
NOTE: The QaSLu-45 items demonstrated excellent robust goodness of fit as evaluated by the CFA model's fit measures. According to Kelley's suggested criterion, the Comparative Fit Index of QaSLu-45 items was >0.95 (CFI = 0.973) since the minimum-maximum difference in the CFA/degrees of freedom was between 1 and 3 (CMIN/DF = 1.053), the root mean square error of approximation was <0.06 (RMSEA = 0.042), and the weighted root mean square residual was <1.0 (WRMR = 0.0978).
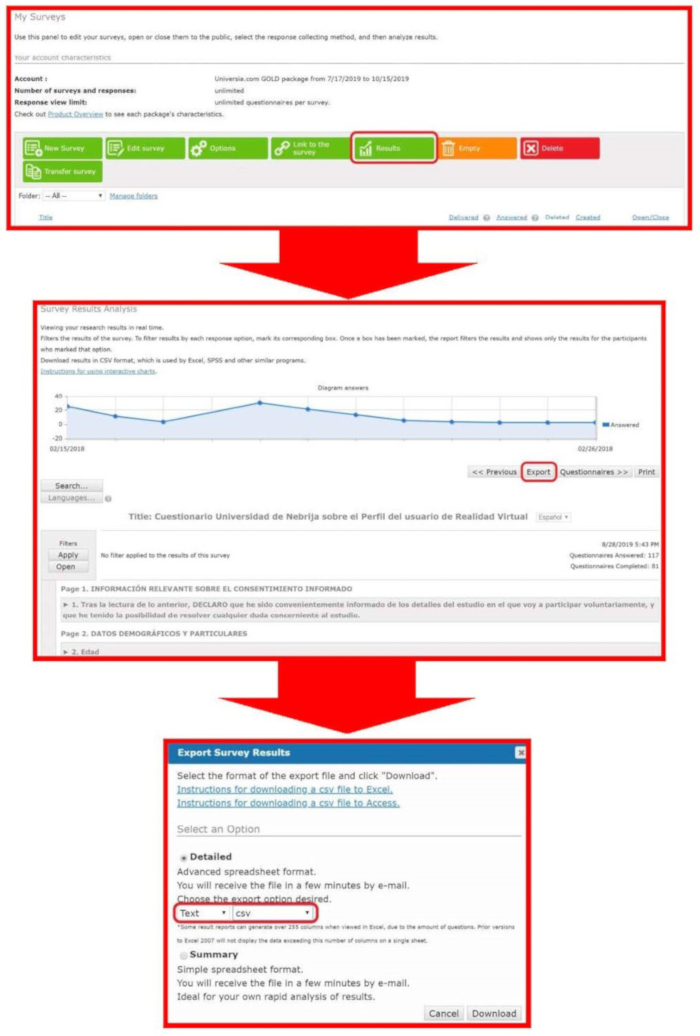
Figure 7: Exporting data to use in statistical software packages 1 and 2. (1) Click on Results icon; (2) Click on Questionnaires icon; (3) Select Text and CSV in the Detailed option. Please click here to view a larger version of this figure.
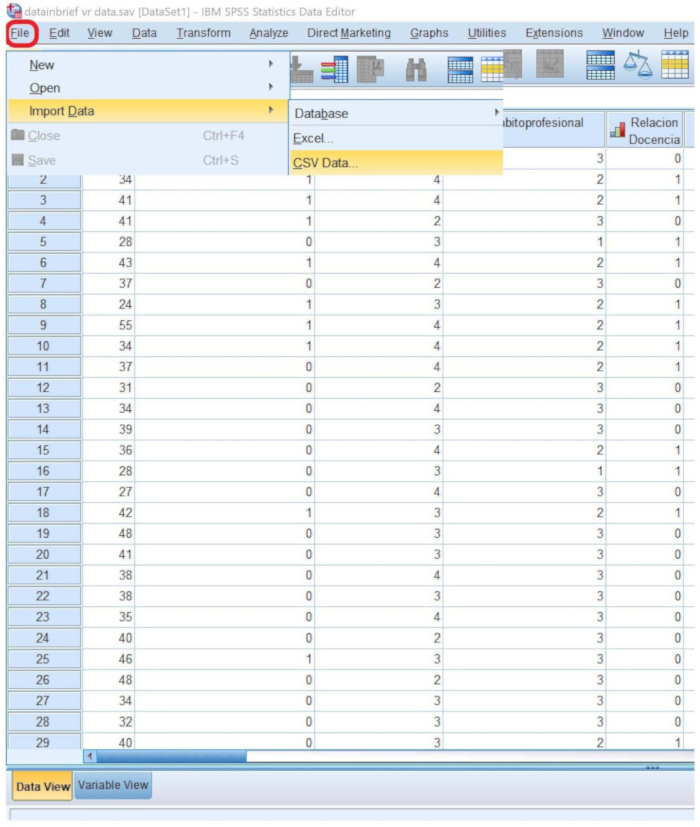
Figure 8: Importing data into statistical software package 1. Select File Menu > Import Data > CSV Data. Please click here to view a larger version of this figure.
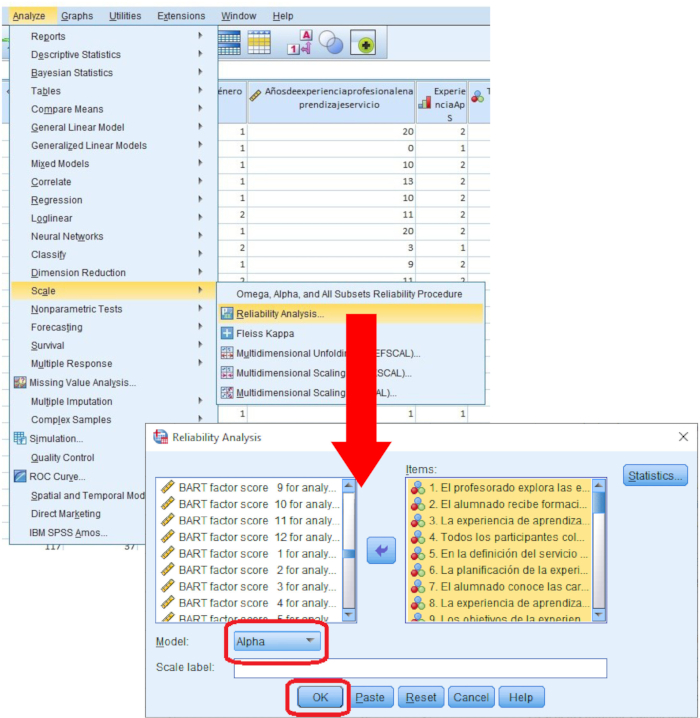
Figure 9: Assessing the internal consistency of the questionnaire. Select Analyze Menu > Scale > Reliability Analysis. Please click here to view a larger version of this figure.
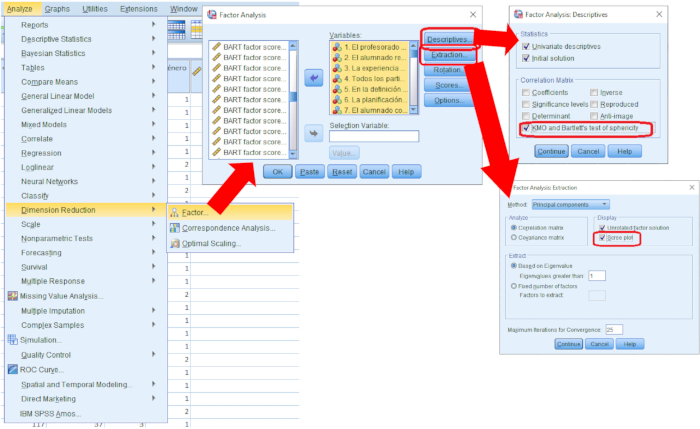
Figure 10: Carrying out the explorative factor analysis with statistical software package 1. (1) Click on Factors icon; (2) Click on Descriptives icon; (3) Select KMO and Bartlett's test of Sphericity in the Detailed option; (4) Click on the Extraction icon; (5) Select Scree Plot in the Detailed option; (6) click on the OK icon. Please click here to view a larger version of this figure.
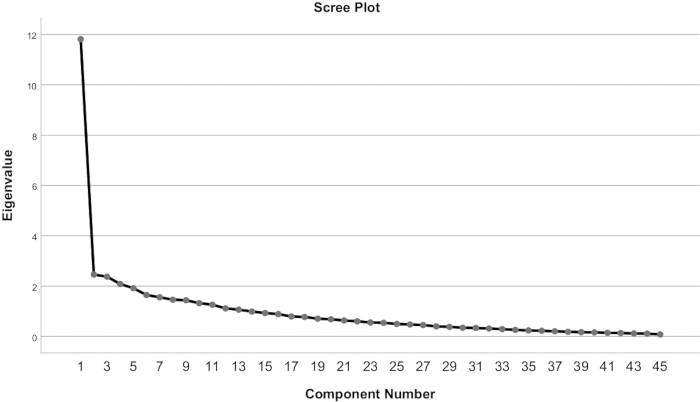
Figure 11: Sediment graph of the principal component factor analysis on the initial version of 45 items. Note how component number 1, according to the exploratory factor analysis, stands out enormously with respect to the rest, highlighting that its relevance is much greater than that of the rest of the components combined, verifying that the single-factor structure is the most appropriate for the questionnaire. This table has been republished from López-de-Arana Prado et al.9. Please click here to view a larger version of this figure.
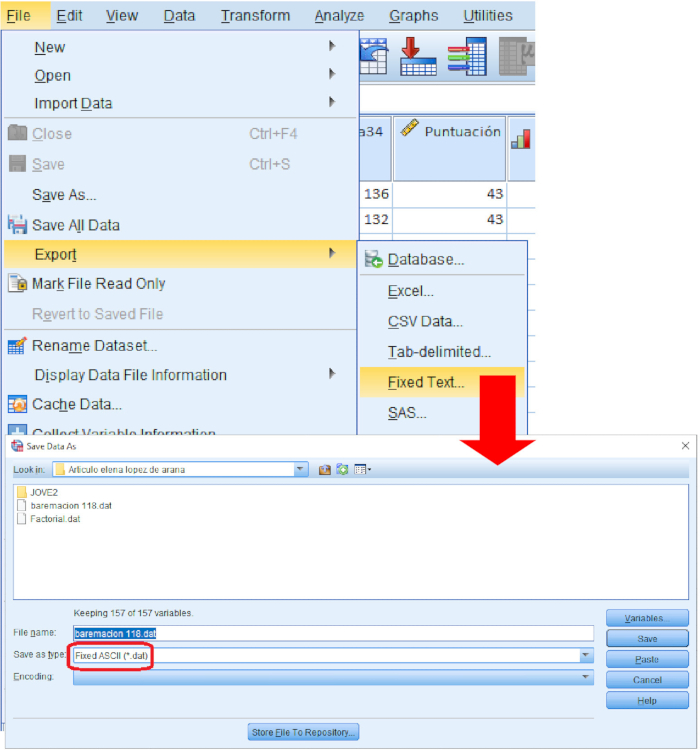
Figure 12: Converting results file to ASCII format in fixed format. (1) Click on the Fixed Text icon; (2) Select Fixed ASCII in the Save as type menu; (3) click on the Save icon. Please click here to view a larger version of this figure.

Figure 13: Performing Confirmatory Factor Analysis with statistical software package 2. (1) Click on the Read Data icon; (2) Select the ASCII file in the Sample menu; (3) Click on the Open Single Group Dataset icon; (4) Click on the Configure Analysis icon; (5) Select Confirmatory Factor Analysis in the Detailed option; (6) click on the OK icon; (7) click on the Compute icon. Please click here to view a larger version of this figure.
7. Optimization of the questionnaire for a single principal component, reducing the excess items according to the principle of parsimony
- Identify items for removal in the optimized version of the questionnaire that have an inverse relationship with the principal component.
- Review the Component Matrix obtained in step 6.5 using statistical software package 1 to determine which items exhibit an inverse relationship with the principal factor. Exclude these items from the reduced and optimized version of the questionnaire for a single factor.
NOTE: Based on the score matrix of each item for the main component, items 6, 16, 28, and 35 were discarded from the final configuration because they exhibited an inverse relationship with the principal component. Since the questionnaire offers a single final score, the inverse items should be eliminated, since they mask the real differences between the users of the questionnaire.
- Review the Component Matrix obtained in step 6.5 using statistical software package 1 to determine which items exhibit an inverse relationship with the principal factor. Exclude these items from the reduced and optimized version of the questionnaire for a single factor.
- Perform a Robust Unweighted Least Squares (RULS) Exploratory Factor Analysis with statistical software package 2.
- To carry this analysis out, select Read Data, then in the Sample dialogue box, click on Browse and select the ASCII file previously created. The number of participants and variables will be displayed green in the Size of Data Matrices section.
- Next, click on the Open Single Group Dataset icon and return to the main menu of statistical software package 2. In the Main Menu, click on Configure Analysis. In the Dialog Menu, select Explorative Factor Analysis and click the Confirm button.
- In the Exploratory Factor Analysis Configuration Menu, select the items with an inverse relationship to the principal component according to the exploratory factor analysis conducted with statistical software package 1 and move them to the box with the excluded variables box.
- Then check the Pearson Correlation Matrix and Parallel Analysis options, change the Number of Factors/Components to 1, and select Robust Factor Analysis (see Figure 14). Finally, click on the Confirm button to return to the main menu and then click on Compute to generate the results.
- Identify items for removal from the optimized version of the questionnaire that have a Measure of Sampling Adequacy (MSA) below 0.49 MSA. To do this, review the results obtained from the RULS Exploratory Factor Analysis with statistical software package 2, specifically the Item Location and Item Adequacy Indices.
NOTE: The RULS Exploratory Factor Analysis suggests discarding 14 items to adapt the design to a single principal component: 1, 4, 7, 8, 9, 11, 18, 20, 23, 25, 31, 38, 41, and 42. This results in a final configuration of 27 items, optimized for a single principal component, with high associated psychometric robustness. This version was called QaSLu-27 (a sample draft of the questionnaire is provided as Supplementary File 4).
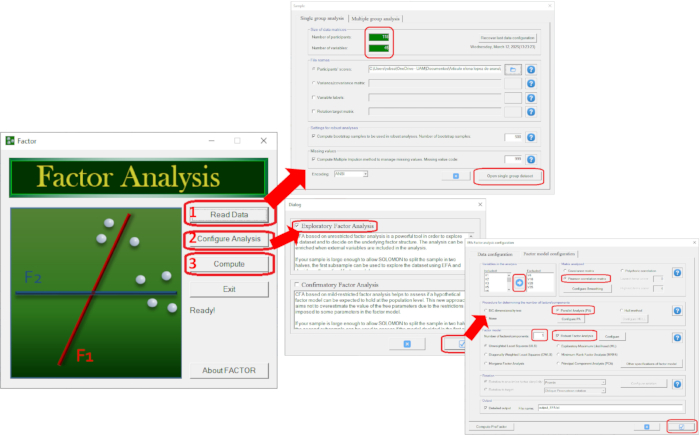
Figure 14: Performing Robust Unweighted Least Squares with statistical software package 2. (1) Click on the Read Data icon; (2) Select the ASCII file in the Sample menu; (3) Click on the Open Single Group Dataset icon; (4) Click on the Configure Analysis icon; (5) Select Exploratory Factor Analysis in the Detailed option; (6) Check the Pearson Correlation Matrix and Parallel Analysis options; (7) Change the Number of Factors/Components to 1; (8) check Robust Factor Analysis in the options; (9) click on the Confirm button; (10) Click on the Compute icon. Please click here to view a larger version of this figure.
8. Reviewing the adequacy of the psychometric properties of the QaSLu-27 with respect to QaSLu-45.
- Reapply step 6.4, excluding from the analysis any items that are not part of the optimized version of the questionnaire.
- Reapply step 6.5, excluding from the analysis any items that are not part of the optimized version of the questionnaire.
- Reapply step 6.7, excluding from the analysis any items that are not part of the optimized version of the questionnaire.
- Compare the adequacy of the psychometric properties of the optimized version of the questionnaire to the original version in a table format.
NOTE: A significant improvement was observed in the KMO Sampling Adequacy Test (KMO = 0.863) and Bartlett's Sphericity Test (χ2 = 1447.76; p = 0.000). The principal component factor analysis with QaSLu-27 revealed seven components with eigenvalues > 1.0, accounting for 65.59% of the total variance. The robust goodness-of-fit statistics, determined using CFA, showed slightly improved results, and the reliability measured by Cronbach's alpha, increased (α = 0.92), despite the QaSLu-27 containing only 27 items instead of 45. These findings support the conclusion that the validity and robustness of the final configuration are significantly higher than those of the 45-item version.
9. Development of rating scales
- Create a new variable by summing the scores of all the items in the optimized version of the questionnaire.
- Select Transform Menu > Compute Variable, and name the new variable as SUM27 in the Compute Variable dialogue box.
- Select the Sum function and complete the Numeric Expression, including the items from the optimized version of the questionnaire. Finally, click the OK icon to generate the new variable SUM27 (see Figure 15).
- Calculate the different percentiles of the final result from the optimized version of the questionnaire.
- Select Analyze Menu > Descriptive Statistics > Frequencies, and in the Frequencies dialogue box, select the variable SUM27 and move it into the Variable(s) box by clicking the arrow icon.
- Then, click the Statistics icon, select Percentile(s), and add the following percentiles: 1, 5, 15, 25, 35, 45, 55, 65, 75, 85, 95, and 99. Click on the Continue icon to return to the Frequencies dialogue box. Finally, click on the OK icon to generate the desired percentiles for SUM27 (see Figure 1).
- Repeat this process for each rating scale by applying filters according to the variables added. To do this, click on the Split File icon, select each nominal or ordinal variable considered relevant, choose Organize Output by Groups, click the arrow icon, and finally, click on the OK icon to generate the desired percentiles for SUM27, filtered by each variable.
- Create a table for each rating scale.
- Create a row for the table titles, followed by a row for Low (with sub-rows for percentiles 1, 10, and 20), Medium/Low (with sub-rows for percentiles 30 and 40), Medium (percentile 50), Medium/High (with sub-rows for percentiles 60 and 70), and High (with sub-rows for percentiles 80, 90, and 99).
- In the title row, create several columns: the first labeled Level (with the level names listed below), the second labeled Percentile (with each percentile listed below), and from the third column onward, list the names of the different conditions of the variable selected for each table.
- Complete the table with the score range for the percentiles calculated previously. That is, Percentile 1 = 0 -, Percentile 4, Percentile 10 = Percentile 5 - Percentile 14, Percentile 20 = Percentile 15 - Percentile 24, Percentile 30 = Percentile 25 - Percentile 34, Percentile 40 = Percentile 35 - Percentile 44, Percentile 50 = Percentile 45 - Percentile 54, Percentile 60 = Percentile 55 - Percentile 64, Percentile 70 = Percentile 65 - Percentile 74, Percentile 80 = Percentile 75 - Percentile 84, Percentile 90 = Percentile 85 - Percentile 94, and Percentile 99 = Percentile 95 -Percentile 99. Repeat this process for each rating scale with the selected nominal or ordinal variables.
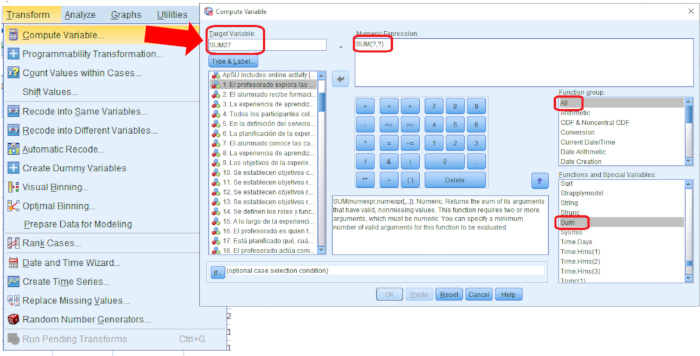
Figure 15: Creating a new variable by summing the scores of all items in statistical software package 1. (1) Click on the Compute Variable icon; (2) Select the Sum function; (3) complete the Numeric Expression with all the items; (4) Assign a name to the new variable; (5) click on the OK icon. Please click here to view a larger version of this figure.
Access restricted. Please log in or start a trial to view this content.
Results
Following this rigorous qualitative-quantitative validation protocol, we developed a robust, optimized, and parsimonious instrument for the self-assessment of university service-learning experiences, named QaSLu (Questionnaire for the Self-Assessment of Service-Learning Experiences in Higher Education). This final instrument has received qualitative approval from 16 SL experts under the Delphi method, with two rounds of online consultations and adaptations, as well as robust quantitative validation through Confirmatory F...
Access restricted. Please log in or start a trial to view this content.
Discussion
The methods used for instrument validation offer several advantages. The Delphi method facilitated the collection of insights from a panel of experts, enabling the systematic organization of this information for analysis. It allowed for the selection and refinement of responses based on expert estimates and suggestions32,47,48,49. Furthermore, this approach yielded significant results within a ...
Access restricted. Please log in or start a trial to view this content.
Disclosures
The authors have nothing to disclose.
Acknowledgements
The authors would like to express their gratitude to the National Commission for Scientific and Technological Research of Chile (CONICYT Fondecyt/Initiation), as well as to all the experts who participated in the qualitative validation through the Delphi method and to all the participants in the quantitative validation and scoring.
Access restricted. Please log in or start a trial to view this content.
Materials
| Name | Company | Catalog Number | Comments |
|---|---|---|---|
| Encuestafacil.com Saas | Encuestafacil.com | 2025 | Software as a Service in the Encuestafacil.com private data server |
| Factor Analysis | Universitat Rovira i Virgili | 12.06.07 | Software package used in factorial analysis of data |
| Statistical Package for the Social Sciences (SPSS) | IBM | 24 | Software package used in statistical analysis of data |
References
- Furco, A., Norvell, K. What is Service Learning? Making Sense of the Pedagogy and Practice. Embedding Service Learning in European Higher Education. , Roultledge. London and New York. (2019).
- Salam, M., Awang Iskandar, D. N., Ibrahim, D. H. A., Farooq, M. S. Service learning in higher education: A systematic literature review. Asia Pac Educ Rev. 20 (4), 573-593 (2019).
- Mabborang, J. M., Dumlao, D., Cusap, K. W. Effect of servicelearning program on student's outcomes. Int J Res Innov Soc Sci. 8 (8), 2580-2589 (2024).
- Albanesi, C., Compare, C. Integrating academic learning: Promoting civic engagement, responsibility, and social justice through servicelearning. Form@re - Open J per la form in rete. 23 (2), 80-92 (2023).
- Stewart, T., Wubbena, Z. An overview of infusing servicelearning in medical education. Int J Med Educ. 5, 147-156 (2014).
- Mahmud, S. N. D., Ismail, N. K. STEM service learning in higher education: A systematic literature review. Eurasia J Math Sci Technol Educ. 20 (12), em2549(2024).
- Cebrián, G., Fernández, M., Fuertes, M. T., Moraleda, Á, Segalàs, J. La influencia del aprendizajeservicio en el desarrollo de competencias en sostenibilidad en estudiantes universitarios. Bordón Rev Pedagogía. 71 (3), 151-167 (2019).
- Resch, K., Schrittesser, I. Using the servicelearning approach to bridge the gap between theory and practice in teacher education. Int J Inclus Educ. 27 (10), 1118-1132 (2023).
- LópezdeArana Prado, E., Aramburuzabala, P., Cerrillo, R., SánchezCabrero, R. Validation and standardization of a questionnaire for the selfassessment of servicelearning experiencesin higher education (QaSLu27). Educ Sci. 14 (6), 615(2024).
- Furco, A. Self-assessment rubric for the institutionalization of service-learning in higher education (2003 revision). International Journal of Research in Global and Development Education. , https://dialnet.unirioja.es/servlet/articulo?codigo=6368177 (2011).
- MartínGarcía, X., Puig Rovira, J. M., Palos Rodríguez, J., Rubio Serrano, L. Improving the quality of service-learning practices. Teaching & Teaching: Interuniversity Journal of Didactics. 36 (1), 111(2018).
- Lorenzo, M., BelandoMontoro, M. R. Service-Learning. The challenges of assessment. Madrid: Narcea. Theory of Education. Interuniversity Journal. 31, 71-80 (2019).
- Shek, D. T. L., Li, X., Yu, L., Lin, L., Chen, Y. Evaluation of electronic servicelearning (eservicelearning) projects in Mainland China under COVID19. Appl Res Qual Life. 17 (5), 3175-3198 (2022).
- Lu, Y., Lambright, K. T. Looking beyond the undergraduate classroom: Factors influencing service learning's effectiveness at improving graduate students' professional skills. College Teach. 58 (4), 118-126 (2010).
- EscofetRoig, A., Folgueiras Bertomeu, P., LunaGonzález, E., PalouJulián, B. Elaboration and Validation of a Questionnaire for the Evaluation of Service-Learning Projects. Revista Mexicana de Investigación Educativa. , https://diposit.ub.edu/dspace/handle/2445/149639 (2016).
- RodríguezIzquierdo, R. M. Service learning and academic commitment in higher education. Journal of Psychodidactics. 25 (1), 45-51 (2020).
- LeónCarrascosa, V., SánchezSerrano, S., BelandoMontoro, M. R. Design and validation of a questionnaire to evaluate the Service-Learning methodology. Studies on Education. 39, 247-266 (2020).
- RuizOrdóñez, Y., SalcedoMateu, A., Turbi, Á, Novella, C., MoretTatay, C. VALU: Psychometric properties of a values and civic attitudes scale for university students' servicelearning. Psicol Reflex Crít. 35 (1), 3(2022).
- SantosPastor, M. L., Cañadas, L., Muñoz, L. F. M., Rico, L. G. Design and validation scale to assess university service-learning in physical activity and sports. Educ XX1. 23 (2), (2020).
- Gul, D. R., Ahmad, D. I., Tahir, D. T., Ishfaq, D. U. Development and factor analysis of an instrument to measure servicelearning management. Heliyon. 8 (4), e09205(2022).
- Campo, L. A rubric for assessing and improving service learning projects at university. RIDAS Rev Iberoam AprendizajeServicio. 1, 91-111 (2015).
- Europe Engage Quality Standards for Service Learning Activities. , At https://ec.europa.eu/programmes/erasmus-plus/project-result-content/4676aec5-7f74-4a0c-bdff-cda07beb4892/guidelines-euengage-2.pdf (2017).
- Martín, X. Tools for improving service-learning projects. RIDAS Ibero-American Journal of Learning and Service. 14, 61-84 (2022).
- Pickeral, T., Lennon, T., Piscatelli, J. ServiceLearning policies and practices: A researchbased advocacy paper. , National Service Learning Clearinghouse. https://www.ecs.org/clearinghouse/78/58/7858.pdf (2008).
- PuigRovira, J. M., MartínGarcía, X., RubioSerrano, L. How to evaluate service learning projects. Voices of Education. 2 (4), 122-132 (2017).
- RubioSerrano, L., PuigRovira, J. M., MartínGarcía, X., PalosRodríguez, J. Analyzing, Rethinking, and Improving Projects: A Rubric for Self-Assessment of Service-Learning Experiences. Profesorado, Journal of Curriculum and Teacher Training. 19 (1), 111-126 (2015).
- Hallinger, P., Narong, D. K. A bibliometric review of service learning research, 1950-2022. J Experiential Educ. 47 (4), 566-590 (2024).
- LópezdeArana, E., Higuera, P. A., Carvajal, H. O. Design and validation of a questionnaire for self-assessment of university service-learning experiences. Educ XX1. 23 (1), (2020).
- CruzRamírez, M., RúaVásquez, J. A. Emergence and development of the Delphi method: a scientometric perspective. Biblios J Librarianship Inf Sci. 71, 90-107 (2018).
- Donohoe, H., Stellefson, M., Tennant, B. Advantages and limitations of the eDelphi technique: Implications for health education researchers. Am J Health Educ. 43 (1), 38-46 (2012).
- von der Gracht, H. A. Consensus measurement in Delphi studies: Review and implications for future quality assurance. Technol Forecast Soc Change. 79 (8), 1525-1536 (2012).
- Bakieva, M., Meliá, J. M. J., GonzálezSuch, J., Barajas, Y. E. L. Teacher collegiality: logical validation of the teacher self-assessment instrument in Spain and Mexico. Studies on Education. 34, 99-127 (2018).
- Gil, B., PascualEzama, D. The Delphi methodology as a technique for studying content validity. Ann Psychol. 28 (3), 1011-1020 (2012).
- Abal, F. J. P., Auné, S. E., Lozzia, G. S., Attorresi, H. F. Functioning of the Central Category in Confidence Items for Mathematics. Evaluate Magazine. 17 (2), (2017).
- Shulman, L. S., Elstein, A. S. Studies of problem solving, judgment, and decision making: Implications for educational research. Rev Res Educ. 3, 3-42 (1975).
- Bardach, E., Patashnik, E. M. A Practical Guide for Policy Analysis: The Eightfold Path to More Effective Problem Solving. , CQ Press. Washington, D.C. (2023).
- Marsh, H. W., Morin, A. J. S., Parker, P. D., Kaur, G. Exploratory structural equation modeling: An integration of the best features of exploratory and confirmatory factor analysis. Annu Rev Clin Psychol. 10 (1), 85-110 (2014).
- LorenzoSeva, U., Ferrando, P. J. Robust Promin: A method for diagonally weighted factor rotation. Liberabit. 25 (1), 99-106 (2019).
- SánchezCabrero, R., SandovalMena, M., SaezSuanes, G. P., Prado, E. L. A. Design and validation of the classroom climate for an inclusive education questionnaire (CCIEQ). Environ Soc Psychol. 9 (5), (2024).
- WMA Declaration of Helsinki-Ethical principles for medical research involving human subjects At . , World Medical Association. At https://www.wma.net/policies-post/wma-declaration-of-helsinki-ethical-principles-for-medical-research-involving-human-subjects (2013).
- Schreiber, J. B. Issues and recommendations for exploratory factor analysis and principal component analysis. Res Soc Admin Pharmacy. 17 (5), 1004-1011 (2021).
- Ferrando, P. J., HernándezDorado, A. A simple twostep procedure for fitting fully unrestricted exploratory factor analytic solutions with correlated residuals. Struct Eq Modeling: A Multidiscip J. 31 (3), 420-428 (2024).
- Hu, L., Bentler, P. M. Cutoff criteria for fit indexes in covariance structure analysis: Conventional criteria versus new alternatives. Struct Eq Modeling: A Multidiscip J. 6 (1), 1-55 (1999).
- LorenzoSeva, U., Ferrando, P. J. MSA: The forgotten index for identifying inappropriate items before computing exploratory item factor analysis. Methodology. 17 (4), 296-306 (2021).
- MartínAntón, L. J., Almedia, L. S., SáizManzanares, M. C., ÁlvarezCañizo, M., Carbonero, M. A. Psychometric properties of the academic procrastination scale in Spanish university students. Assess Eval High Educ. 48 (5), 642-656 (2023).
- SánchezCabrero, R., Lópezde Arana Prado, E., Aramburuzabala, P., Cerrillo, R. Dataset on the validation and standardization of the questionnaire for the selfassessment of servicelearning experiences in higher education (QaSLu). Data. 9 (9), 108(2024).
- Almenara, J. C. University teacher training in ICT. Application of Delphi Method for the selection of training content. Educ XX1. 17 (1), 111-132 (2014).
- GeorgeReyes, C. E., TrujilloLiñán, L. Application of the Modified Delphi Method for the validation of a questionnaire on the incorporation of ICT in teaching practice. Ibero American Journal of Eductaional Evaluation. 11 (1), 113-135 (2018).
- LópezMeneses, E. J., BernalBravo, C., LeivaOlivencia, J. J., MartínPadilla, A. H. Validation of the CUVOMOOC® educational tool for assessing digital observatories on MOOCs using the Delphi Method. Virtual Campuses. 7 (1), 95-110 (2018).
- Hung, H. L., Altschuld, J. W., Lee, Y. F. Methodological and conceptual issues confronting a crosscountry Delphi study of educational program evaluation. Eval Program Planning. 31 (2), 191-198 (2008).
- Linstone, H., Turoff, M. Delphi: A brief look backward and forward. Technol Forecast Soc Change. 78, 1712-1719 (2011).
- Rowe, G., Wright, G. The Delphi technique: Past, present, and future prospects - Introduction to the special issue. Technol Forecast Soc Change. 78 (9), 1487-1490 (2011).
- Steurer, J. The Delphi method: An efficient procedure to generate knowledge. Skeletal Radiol. 40 (8), 959-961 (2011).
- Aramburuzabala, P., Gezuraga, M., LópezdeArana, E. How to approach evaluation in Service-Learning projects . Service-Learning: The Challenges of Evaluation. Chapter 9, 27-37 (2018).
- PuigRovira, J. M. 11 Key Ideas: How to Implement a Service-Learning Project. , Grao, Barcelona. (2015).
- Eyler, J., Giles, D. E. Where's the Learning in ServiceLearning. JosseyBass Higher and Adult Education Series. , JosseyBass, Inc. San Francisco, CA. (1999).
Access restricted. Please log in or start a trial to view this content.
Reprints and Permissions
