Mass spectrometry-based proteomic data is available in open databases and accessible using free tools. Given the complexity of database searches and descriptions, many biologists lack the knowledge to utilize these datasets. Here, we provide a guide on using free tools for basic proteomic data searches.
A subscription to JoVE is required to view this content. Sign in or start your free trial.
Method Article
Navigating the Mass Spectrometry-Based Proteomic Data Using Free Computational Tools
In This Article
Summary
Abstract
Mass spectrometry (MS)-based proteomics data, including Data-Dependent Acquisition (DDA) and Data-Independent Acquisition (DIA), are widely used in biological research. However, the application of these datasets in validation studies is still limited due to the lack of clear demonstrations on how to effectively search and analyze proteomic data. To fill this gap, we selected one DDA and one DIA dataset deposited in the PRoteomics IDEntifications Database (PRIDE) data repository to better illustrate the proteomic data analysis workflow and downstream post-processing of protein search results. For demonstration purposes, we used two free computational tools: FragPipe (v22.0) for DDA datasets and DIA-NN (2.1.0) for DIA datasets. Post-processing steps, such as generating volcano plots and lists of dysregulated proteins, were demonstrated using R code. This study provides basic protocols for searching and analyzing proteomic data, serving as an essential beginner's guide to effectively handle proteomic datasets. Through this work, we aim to empower researchers with the knowledge necessary to leverage proteomic data in their biological investigations.
Introduction
The field of proteomics has been revolutionized by the widespread adoption of open-access data repositories and free software tools1, which have been instrumental in advancing research capabilities and promoting a culture of data sharing. The establishment of centralized resources, such as PRIDE2, and the development of standardized data formats by the Human Proteome Organization (HUPO) Proteomics Standards Initiative (PSI)3 have created an unprecedented opportunity for data reuse and integration. However, the analysis and interpretation of proteomic data still present significant technical barriers, particularly for biologists and physician scientists who wish to perform orthogonal validation of their own experimental results4. This manuscript directly addresses this challenge by presenting a vendor-agnostic computational workflow to provide an accessible framework for researchers to independently query, analyze, and integrate public proteomics data with their own findings, thereby facilitating robust orthogonal validation without the need for additional wet-lab experiments. This work is particularly appropriate for researchers seeking to orthogonally validate the differential expression of specific proteins identified in their own experiments and generate novel hypotheses by exploring the expression patterns of their proteins of interest across a wide range of published studies. By providing a step-by-step guide, we aim to empower a wider range of scientists to harness the full potential of public proteomics data, ultimately enhancing the robustness and impact of their research.
In mass spectrometry (MS)-based proteomics, MS1 and MS2 scans are fundamental to data acquisition. MS1 scans, or survey scans, detect and measure the mass-to-charge (m/z) ratios of all ions in a sample, providing a comprehensive overview of the ion population5. MS2 scans, also called fragmentation scans, involve isolating and fragmenting specific precursor ions chosen from the MS1 scan, generating fragment ion spectra for peptide identification6.
Data-dependent acquisition (DDA) selects the most abundant ions from MS1 scans for MS2 fragmentation, producing simpler spectra that streamline analysis. However, DDA can lead to stochastic sampling and missing values in complex samples, limiting reproducibility7. In contrast, data-independent acquisition (DIA) systematically fragments all ions within predefined m/z windows, ensuring comprehensive coverage and minimizing missing values. This enhances quantitative accuracy and reproducibility8, though DIA demands advanced computational tools to deconvolve its highly complex MS2 spectra9.
PRIDE (https://www.ebi.ac.uk/pride)2i s a leading repository within the ProteomeXchange Consortium (https://www.proteomexchange.org)10, a global platform for sharing proteomics data. Users can efficiently navigate this vast resource using keyword searches to locate datasets of interest.
DIA-NN11, a software suite leveraging deep neural networks, is a gold-standard tool for analyzing data-independent acquisition (DIA) proteomics data. It excels in identification and quantification accuracy, making it particularly effective for processing complex DIA datasets12. For data-dependent acquisition (DDA) workflows, MSFragger13, integrated into the FragPipe pipeline, offers ultrafast peptide identification. Its innovative fragment-ion indexing approach enables rapid spectral matching, outperforming traditional tools by over 100-fold in speed.
Equipped with these comprehensive databases and advanced tools, researchers can readily reuse proteomic data for cross-study validation and novel biological discoveries. This accessibility has driven the identification of numerous protein biomarkers across diverse diseases14,15, improved prognosis prediction16, and enabled molecular subtype classification based on proteomic profiles17.
Access restricted. Please log in or start a trial to view this content.
Protocol
NOTE: See Figure 1for an overview of the workflow and Table of Materials for detailed descriptions of the software used.
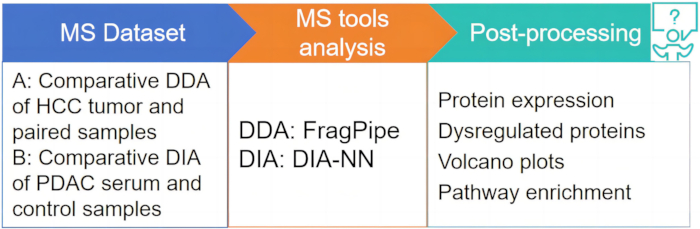
Figure 1: Overview of study design. Please click here to view a larger version of this figure.
1. Example file and software setup
NOTE: All applications are free for individual research use and can be run on a personal computer (Windows and Linux are supported).
- Create a new directory for a project.
- Download JMU_LM2_8526_55.raw, JMU_LM2_8568_51.raw, JMU_LM2_8696_37.raw, JMU_LM2_2112_87.raw, JMU_LM2_2195_91.raw, JMU_LM2_2377_73.raw, 20150127_liver_XH03_T_01.raw, 20150127_liver_XH03_T_02.raw, 20150127_liver_XH03_T_03.raw, 20150127_liver_XH03_P_01.raw, 20150127_liver_XH03_P_02.raw, 20150127_liver_XH03_P_03.raw from PRIDE.
NOTE: The two groups of files can be downloaded from https://www.ebi.ac.uk/pride/archive/projects/PXD039273 and https://www.ebi.ac.uk/pride/archive/projects/PXD006512 separately (Figure 2). - Download and install the required software tools.
- Download the latest version of DIA-NN as a .msi file. DIA-NN is freely available as a .msi file for Windows or .zip file for Linux from https://github.com/vdemichev/DiaNN/releases/tag/2.0
- Download the latest version of MSFileReader as an .exe file. MSFileReader is freely available as an .exe file from https://github.com/thermofisherlsms/MSFileReader/blob/main/MSFileReader_x64.exe, which is required to process raw formatted Thermo Fisher DIA data.
- Download the latest version of .NET SDK as an .exe file. .NET SDK is freely available as an .exe file from https://dotnet.microsoft.com/en-us/download, which is required in Windows to execute MSFileReader.
- Download the latest version of FragPipe as a .zip file. FragPipe is freely available as a .zip file from https://github.com/Nesvilab/FragPipe/releases. The zip file with jre is recommended as it contains a Java runtime for Windows, which is needed to execute FragPipe. MSFragger is embedded in the FragPipe.
- Download the latest version of R and Rstudio and R script files from Supplementary File 1 and Supplementary File 2. R and RStudio can be downloaded freely from https://cran.rstudio.com/bin/windows/base/R-4.5.0-win.exe and https://posit.co/download/rstudio-desktop/.
- Unzip the compressed files and click on the .exe or .msi Files to install the applications.
2. DIA data analysis using DIA-NN
- Download the reference proteome fasta file from UniProt. To download the Homo sapiens reference proteome (isoform information not included) go to https://www.uniprot.org/proteomes/UP000005640 (Figure 3A).
- Click on the Add FASTA button to load the reference proteome file into DIA-NN.
- Select the two options FASTA digest for library-free search /library generation and Deep learning-based spectra, RTs and lMs prediction under Precursor ion generation part. Click on the Run button to generate a predicted spectral library (Figure 3B).
- Once the predicted spectral library file was generated, reuse that for other experiments within the same experimental acquisition settings through clicking on Spectral button to add the predicted library.
- Unselect the two options under the Precursor ion generation part and click on the Type button that correlates with the file format under the Input part to load the DIA data.
- Set the Mass Accuracy and MS1 Accuracy under Algorithm to 0.0 ppm.
- Adjust the precursor and fragment mass range settings under Precursor ion generation part based on the experimental settings.
- Keep the other default settings.
- DIA-NN's precursor generation uses Trypsin/P (cleaves after K/R unless followed by proline) with 1 missed cleavage to model partial digestion; disable N-term M excision for non-canonical peptides (e.g., immunopeptidomics) or increase missed cleavages to 2 for longer peptides.
- Explicitly enable Variable modifications (disabled by default) for post-translational modification (PTM) studies (e.g., Ox (M) for oxidation, K-GG for ubiquitination), and expand peptide filters (length: 7-30 aa; charge: 1-4+; precursor m/z: 300-1800) according to the experimental settings (e.g., length:5-50 aa, charge=1-6) for large PTMs or non-tryptic digests.
- Algorithm settings leverage auto-calibration (mass accuracy=0.0 ppm) for precise mass alignment—override with manual tolerances (e.g., 10 ppm) for low-resolution instruments—and Match Between Runs (MBR) transfers IDs across runs (disable for heterogeneous samples).
- Neural network scoring boosts identification confidence (retain unless poor data quality), while Quant Unlabeled Mass Spectrometry (UMS) enables high-precision label-free quantification; switch to MS2 quantification for isobaric tags (e.g., TMT). Use library-free search only with high-resolution DIA data to bypass spectral library requirements.
- Click on the Run button. Wait for results until Finished is shown in the operation interface indicating the run is finished (Figure 3C).
3. DDA data analysis using FragPipe
- Click on Fragpipe icon in the ~\FragPipe\fragpipe\bin folder after installation. All the dependent settings can be seen in the Config tab. Check whether the three modules (MSFragger, IonQuant, diaTracer, DIA-NN and Python) exist on your computer. If not, download them by clicking on Download/Update or Download (Figure 4A).
- Switch to next tab, Workflow. Select Default for the workflow and click on Load workflow. Click on Add files to add file paths. Assign experiment name and bioreplicate number under Assign files or just leave it (Figure 4B).
- Now, click on Database and turn to that tab. Load a fasta file or download any fasta files according to the species of the samples. While downloading, choose Reviewed sequences only, Add decoys and Add common contaminants options for a simple run (Figure 4C).
- Then click on MSFragger to change the tab. Choose the Closed Search default config and click on Load.
NOTE: The closed search is basically a search for the modifications that you have set while the open search will explore all the possible modifications from the data, which is more time-and memory-consuming. - For Peak matching, keep the default settings except that choosing None for Calibration and Optimization is recommended, as it will save time.
- For protein digestion, adjust the parameters according to the experimental conditions. Keep the following default settings (Figure 5A).
NOTE: The precursor and fragment mass tolerances (± 20 ppm) define the maximum allowed mass error for matching experimental spectra to theoretical peptides, with tighter values recommended for high-resolution instruments. Enzyme rules (strict trypsin) specify cleavage specificity (after K/R, unless followed by P), with missed cleavages (2) permitting partially digested peptides. Peptide length (5-50 residues) and mass (500-5000 Da) filters exclude unlikely candidates. Variable modifications (e.g., +15.9949 Da on methionine for oxidation, +79.96633 Da on S/T/Y for phosphorylation) allow detection of chemical alterations, while Max combinations (5) limit simultaneous modifications per peptide to manage search space. Max variable mods per site (e.g., 3 on M) controls modification frequency. Split database improves efficiency for large proteomes, and isotope error (0/1/2) accounts for misassigned isotopic peaks. These settings collectively balance sensitivity, specificity, and computational load in peptide identification. - Change to Validation tab. Unselect Predict RT and Predict spectra, which is for DIA data (Figure 5B).
- Click on Quant (MS1) tab. Select Run MS1 quant and click on Load Quant defaults. Select IonQuant and keep the default settings (Figure 6A). Disable MBR for unstable retention times or disable Intensity normalization if global scaling biases result; enable Keep index on disk to conserve RAM with large datasets.
NOTE: Quant (MS1) defaults to optimize label-free quantification using MaxLPQ (MaxLFQ-based Protein Quantification, an algorithm extending the MaxLFQ method to protein groups), requiring ≥1 unique ion per protein (increase to ≥2 for higher stringency at the cost of coverage). Match Between Runs (MBR) transfers identifications across runs using retention time (RT) tolerance (default 0.4 min; tighten to 0.2 min for stable chromatography or loosen for gradient variability) and ion mobility (IM) tolerance (default 0.05 1/k0 [inverse reduced mobility]; adjust based on IM precision), filtered by ≤1% FDR (False Discovery Rate; default MBR ion FDR=0.01; lower to 0.005 for rigor). Protein inference uses uniquer+rascor (razor peptide assignment for protein grouping). Feature detection employs 10 ppm mass tolerance (increase to 20 ppm for low-resolution MS or decrease to 5 ppm for high-resolution). - Now, click on the Run tab. Select Output directory. Click on RUN to start analyzing the data (Figure 6B).
NOTE: For label-free proteomics data not focusing on modifications or using label-based quantification, PTMs, Glyco, and Quant (Isobaric) tabs are not used.
4. DIA-NN/FragPipe downstream analysis
NOTE: Detailed codes used in this study are included as Supplementary File 1 and Supplementary File 2. The used package versions in this study can be found in Supplementary File 3.
- Open RStudio and read the protein expression data generated by DIA-NN or FragPipe. Protein group matrix data ending with .pg_matrix.tsv from DIA-NN and combined protein data ending with .tsv from FragPipe are normally used for analysis.
- Remove the missing values without filling in NA and filter out the protein groups identified and quantified with less than two unique peptides.
NOTE: The DIA figures in this study were generated by filtered protein groups, while the DDA figures were from unfiltered protein groups. - Normalize protein intensities using median scaling or quantile normalization across samples. DIA data in this study was normalized by median normalization while DDA data by quantile normalization to better demonstrate the two methods.
NOTE: Median normalization is robust against outliers and suitable for scenarios where the majority of proteins remain unchanged across samples, making the median protein abundance a stable reference point. However, it may fail in scenarios with highly differentially expressed proteins18. Quantile normalization ensures a uniform distribution of protein abundances across samples, which is helpful when comparing samples with disparate distributions. It has been shown to reduce statistical power and may over-normalize data, potentially masking true biological differences18. In proteomics, median normalization is widely used in label-free studies to remove systematic biases related to MS instrument performance. Quantile normalization is preferred for large-scale datasets, differential expression analysis, and cluster analysis19,20. - Calculate log2 fold changes (e.g., PDAC Serum versus Normal) and t-test p-values. Calculate corrected p-values using the Benjamini-Hochberg method. Define significance thresholds (e.g., |log2FC| > 1, p_adj (FDR) < 0.05).
NOTE: The cutoff p-values utilized in this study's figures represent raw values, as employing adjusted p-values (p_adj) would eliminate all detectable proteins within the statistical power of these limited datasets. - Check the existence of missing/NA values and exclude them. Generate a volcano plot to visualize significant hits.
- Select significantly dysregulated proteins. Apply Z-score normalization to protein expression values. Plot a clustered heatmap with sample group annotations.
- Map proteins to Entrez IDs using org.Hs.eg.db. Perform GO enrichment (Biological Process) and KEGG pathway analysis.
NOTE: Biological Process (BP) categories are commonly selected in Gene Ontology (GO) analysis because they describe the larger processes or biological programs accomplished by multiple molecular activities20. These terms focus on cellular functions that go awry in diseases like cancer, including essential processes such as cell cycle regulation, metabolic processes, etc. In addition to BP, GO analysis also includes Molecular Function (MF) and Cellular Component (CC) categories. MF terms outline the biochemical activities of gene products, such as ion transport or DNA-binding capabilities. CC terms define the cellular locations where gene products carry out their functions, such as the nucleus, mitochondrial membrane, or cytoskeleton. - Query STRINGdb for interactions (confidence score ≥ 400). Generate an interactive network using visNetwork.
Access restricted. Please log in or start a trial to view this content.
Results
To better illustrate the search for proteomic datasets, we selected two types of datasets for this analysis. Aiming to demonstrate dysregulated proteins in clinical contexts, we searched in PRIDE using keywords such as clinic. Specifically, we selected a dataset suitable for DIA analysis from the Clinical Proteomic Tumor Analysis Consortium (CPTAC)21, and another suitable for DDA analysis from the Chinese Human Proteome Project (CNHPP)22. Th...
Access restricted. Please log in or start a trial to view this content.
Discussion
The presented protocol illustrates proteomic data analysis by integrating free tools like DIA-NN and FragPipe. Success hinges on critical steps such as accurate precursor ion selection and mass accuracy settings for spectral library generation in DIA-NN (step 2.3)27, which are instrument-dependent and crucial for complete peptide identification. Similarly, meticulous database setup in FragPipe (step 3.4), including decoy generation and contaminant filtering, is vital for controlling FDR.
Access restricted. Please log in or start a trial to view this content.
Disclosures
F.Z. is the founder of Molemuse Biotech Studio.
Acknowledgements
This project is supported by Molemuse Biotech Studio.
Access restricted. Please log in or start a trial to view this content.
Materials
| Name | Company | Catalog Number | Comments |
|---|---|---|---|
| .NET SDK v. 9.0.203 | Microsoft | https://dotnet.microsoft.com/en-us/download | |
| DIA-NN v. 2.1.0 | https://github.com/vdemichev/DiaNN/releases/tag/2.0 | ||
| FragPipe v. 22.0 | https://github.com/Nesvilab/FragPipe/releases | ||
| MSFileReader v. 3.1 | Thermo Fisher | https://github.com/thermofisherlsms/MSFileReader/blob/main/MSFileReader_x64.exe | |
| R 4.5.0 | https://cran.rstudio.com/bin/windows/base/R-4.5.0-win.exe | ||
| Rstudio v. 2024.12.1+563 | https://posit.co/download/rstudio-desktop/ |
References
- Pedrioli, P. G. A., et al. A common open representation of mass spectrometry data and its application to proteomics research. Nat Biotechnol. 22 (11), 1459-1466 (2004).
- Perez-Riverol, Y., et al. The PRIDE database at 20 years: 2025 update. Nucl Acids Res. 53 (D1), D543-D553 (2025).
- Deutsch, E. W., et al. Proteomics Standards Initiative at Twenty Years: Current Activities and Future Work. J Proteome Res. 22 (2), 287-301 (2023).
- Schubert, O. T., Röst, H. L., Collins, B. C., Rosenberger, G., Aebersold, R. Quantitative proteomics: challenges and opportunities in basic and applied research. Nat Protoc. 12 (7), 1289-1294 (2017).
- Wang, X., Shen, S., Rasam, S. S., Qu, J. MS1 ion current-based quantitative proteomics: A promising solution for reliable analysis of large biological cohorts. Mass Spectro Rev. 38 (6), 461-482 (2019).
- Vaudel, M. MS2-Based Quantitation. Proteome Inform. , 155-177 (2016).
- Meyer, J. G. Qualitative and Quantitative Shotgun Proteomics Data Analysis from Data-Dependent Acquisition Mass Spectrometry. Shotgun Proteomics. 2259, 297-308 (2021).
- Fröhlich, K., et al. Data-Independent Acquisition: A Milestone and Prospect in Clinical Mass Spectrometry-Based Proteomics. Mol Cell Proteomics. 23 (8), 100800(2024).
- Zhang, F., Ge, W., Ruan, G., Cai, X., Guo, T. Data-Independent Acquisition Mass Spectrometry-Based Proteomics and Software Tools: A Glimpse in 2020. Proteomics. 20 (17-18), 1900276(2020).
- Deutsch, E. W., et al. The ProteomeXchange consortium at 10 years: 2023 update. Nucl Acids Res. 51 (D1), D1539-D1548 (2023).
- Demichev, V., Messner, C. B., Vernardis, S. I., Lilley, K. S., Ralser, M. DIA-NN:neural networks and interference correction enable deep proteome coverage in high throughput. Nat Meth. 17 (1), 41-44 (2020).
- Zhang, F., et al. A Comparative Analysis of Data Analysis Tools for Data-Independent Acquisition Mass Spectrometry. Mol Cell Proteomics. 22 (9), 100623(2023).
- Kong, A. T., Leprevost, F. V., Avtonomov, D. M., Mellacheruvu, D., Nesvizhskii, A. I. MSFragger: ultrafast and comprehensive peptide identification in mass spectrometry-based proteomics. Nat Meth. 14 (5), 513-520 (2017).
- Anderson, N. L., Anderson, N. G. The Human Plasma Proteome. Mol Cell Proteomics. 1 (11), 845-867 (2002).
- Kowal, J., et al. Proteomic comparison defines novel markers to characterize heterogeneous populations of extracellular vesicle subtypes. Proc Natl Acad Sci. 113 (8), E968-E977 (2016).
- Cao, L., et al. Proteogenomic characterization of pancreatic ductal adenocarcinoma. Cell. 184 (19), 5031-5052.e26 (2021).
- Dong, L., et al. Proteogenomic characterization identifies clinically relevant subgroups of intrahepatic cholangiocarcinoma. Cancer Cell. 40 (1), 70-87.e15 (2022).
- Dubois, E., Galindo, A. N., Dayon, L., Cominetti, O. Comparison of normalization methods in clinical research applications of mass spectrometry-based proteomics. 2020 IEEE Conf Computat Intelligence Bioinfo Computat Biol. , 1-10 (2020).
- Dressler, F. F., Brägelmann, J., Reischl, M., Perner, S. Normics: Proteomic Normalization by Variance and Data-Inherent Correlation Structure. Mol Cell Proteomics. 21 (9), 100269(2022).
- Dimmer, E. C., et al. The Gene Ontology - Providing a Functional Role in Proteomic Studies. Proteomics. 8 (23-24), pmic.200800002(2008).
- Lih, T. M., et al. Detection of Pancreatic Ductal Adenocarcinoma-Associated Proteins in Serum. Mol Cell Proteomics. 23 (1), 100687(2024).
- Chinese Human Proteome Project (CNHPP) Consortium. Proteomics identifies new therapeutic targets of early-stage hepatocellular carcinoma. Nature. 567 (7747), 257-261 (2019).
- Kanehisa, M., Furumichi, M., Sato, Y., Matsuura, Y., Ishiguro-Watanabe, M. KEGG: biological systems database as a model of the real world. Nucl Acids Res. 53 (D1), D672-D677 (2025).
- Campello, E., Ilich, A., Simioni, P., Key, N. S. The relationship between pancreatic cancer and hypercoagulability: a comprehensive review on epidemiological and biological issues. Br J Cancer. 121 (5), 359-371 (2019).
- Fang, L., Xu, Q., Qian, J., Zhou, J. Y. Aberrant Factors of Fibrinolysis and Coagulation in Pancreatic Cancer. OncoTargets Ther. 14, 53-65 (2021).
- Vlodavsky, I., Elkin, M., Ilan, N. Impact of heparanase and the tumor microenvironment on cancer metastasis and angiogenesis: basic aspects and clinical applications . Rambam Maimonides Med J. 2 (1), (2011).
- Fröhlich, K., et al. Benchmarking of analysis strategies for data-independent acquisition proteomics using a large-scale dataset comprising inter-patient heterogeneity. Nat Comm. 13 (1), 2622(2022).
- Polasky, D. A., et al. MSFragger-Labile: A Flexible Method to Improve Labile PTM Analysis in Proteomics. Mol Cell Proteomics. 22 (5), 100538(2023).
- Gerault, M. A., Camoin, L., Granjeaud, S. DIAgui: a Shiny application to process the output from DIA-NN. Bioinfo Adv. 4 (1), (2024).
- Hsiao, Y., et al. Analysis and Visualization of Quantitative Proteomics Data Using FragPipe-Analyst. J Proteome Res. 23 (10), 4303-4315 (2024).
- Yu, F., Deng, Y., Nesvizhskii, A. I. MSFragger-DDA+ enhances peptide identification sensitivity with full isolation window search. Nat Comm. 16 (1), 3329(2025).
- Li, K., Teo, G. C., Yang, K. L., Yu, F., Nesvizhskii, A. I. diaTracer enables spectrum-centric analysis of diaPASEF proteomics data. Nat Comm. 16 (1), 95(2025).
- Qiao, R., Li, H., Bian, H., Xin, L., Shan, B. De Novo sequencing-assisted homology search for DIA data analysis enables low abundance peptide variants discovery. Biorvix. 10, (2025).
- Meissner, F., Geddes-McAlister, J., Mann, M., Bantscheff, M. The emerging role of mass spectrometry-based proteomics in drug discovery. Nat Rev Drug Disc. 21 (9), 637-654 (2022).
- Zheng, Y., et al. Multi-omics data integration using ratio-based quantitative profiling with Quartet reference materials. Nat Biotechnol. 42 (7), 1133-1149 (2024).
- Bubis, J. A., et al. Challenging the Astral mass analyzer to quantify up to 5,300 proteins per single cell at unseen accuracy to uncover cellular heterogeneity. Nat Meth. 22 (3), 510-519 (2025).
- Leutert, M., Entwisle, S. W., Villén, J. Decoding Post-Translational Modification Crosstalk With Proteomics. Mol Cell Proteomics. 20, 100129(2021).
- Schneider, M., et al. A Scalable, Web-Based Platform for Proteomics Data Processing, Result Storage and Analysis. Proteome Res. 24 (3), 1241-1249 (2025).
- Jalili, V., et al. The Galaxy platform for accessible, reproducible and collaborative biomedical analyses: 2020 update. Nucl Acids Res. 48 (W1), W395-W402 (2020).
Access restricted. Please log in or start a trial to view this content.
Reprints and Permissions
