A design is presented to enable cost-effective low-temperature battery cycling for 2032 coin cells in a low-humidity environment. Cells are cycled at 0 °C inside a chamber cooled by thermoelectric modules. This simple design can be adapted for experiments that require similar thermal and humidity-controlled environments or different battery geometries.
Method Article
Coin Cell Battery Chamber Design for Low-temperature Operando Experiments
In This Article
Summary
Abstract
As we become more reliant on the rechargeable batteries that power our devices, it is becoming increasingly important to understand the capacity and performance reductions that occur in cold weather environments. Research focused on the cycling performance of batteries at low temperatures is essential for guiding the design and optimization of advanced batteries. However, commercially available low-temperature battery cycling equipment tends to be expensive, preventing low-temperature cycling research from being performed in many facilities. The following is a simple, cost-effective temperature chamber design that is easy to assemble and implement quickly. This design enables reliable temperature control for four 2032 coin cells in low-humidity environments, thereby reducing corrosion and condensation issues. Electrochemical cycling data is shown to demonstrate the cell capacity evolution at T = 0 ± 1 °C for 100 cycles at a C-rate of C/7. The temperature can be lowered to -5 °C in the current design, and small modifications would allow for even lower temperatures. In addition, this design can also be easily adapted to accommodate other types of batteries or to increase the number of samples measured.
Introduction
As the world becomes increasingly electrified, batteries play a key role in energizing our devices. From powering our electric vehicles to providing energy storage for grid-level renewable energy sources, it is becoming increasingly important to develop batteries that exhibit high performance in a wide range of climates1,2. Battery performance is often reduced in cold weather environments, which necessitates more research focused on low-temperature battery investigations3,4. However, commercially available low-temperature battery cycling equipment tends to be expensive, preventing these studies from being performed in research facilities that do not typically focus on non-ambient experiments.
Many battery applications only need to understand low-temperature behavior at modest temperatures that approach 0 °C or slightly lower5. Despite even this limited temperature range, batteries continue to exhibit significant reductions in overall capacity, performance, and charging characteristics at low temperatures6,7. For example, commercial Li-ion batteries only maintain 10% of their room temperature capacities at −40 °C8,9. All components of the cell, including cathode, anode, and electrolyte, have documented effects at non-ambient temperatures6,7,10. This issue is becoming increasingly important due to the recent emergence of electric vehicles and hampers the use of rechargeable batteries in countries with frigid winter climates11,12. Battery performance in cold weather environments can only be optimized if we increase our understanding of the complex underlying processes occurring at low temperatures.
Coin cell batteries are commonly used to power small portable electronic devices due to their compact design. They are also often used in research laboratories to test new battery chemistries and overall device performance. Coin cells are easy to assemble and are low-cost, which enables researchers to rapidly test new prototypes before scaling up into larger, more complex, and expensive battery packs. Their small size also allows them to easily fit within low-temperature sample environment equipment, allowing truly in operando and in situ investigations. Therefore, coin cells are excellent choices for temperature-dependent battery studies, and there is a clear need for an affordable low-temperature (≈ 0 °C) chamber designed specifically for non-ambient coin cell battery testing13. Commercial residential refrigerators can readily provide the low temperatures needed for these experiments, but the lack of humidity regulation causes corrosion issues and inhibits the accuracy of the measurements. Specialized commercial equipment tends to be tailored for large-scale battery research laboratories, often measuring dozens or hundreds of batteries at a time. This equipment is expensive and can be cost-prohibitive for research labs with smaller budgets.
We report here a simple, cost-effective, low-temperature chamber design that is easy to assemble and fast to implement, allowing more low-temperature battery research to be conducted. This design enables reliable temperature control for four 2032 coin cells in a low-humidity environment to reduce corrosion and condensation issues. It provides a cost-effective alternative to commercial temperature-control equipment that can be implemented in small research labs. The simplistic design can be easily assembled in less than a week using minimal machining, readily available off-the-shelf parts, as well as some custom parts that can be fabricated with a 3D printer using the provided files. The overall cost is around 870 USD, but considering that many of these materials are commonly available and may already be present in research labs, the overall cost of this device can be considerably lower to produce. A step-by-step guide on how to assemble the system is provided.
The effectiveness of the design is demonstrated through operando galvanostatic cycling under non-ambient (0 °C) temperature conditions and is demonstrated as suitable for long-term cycling over several months. The temperature control performance and a 3D representation of the temperature distribution within the chamber are also shown. Though results are not presented here, the chamber can also be used for additional operando electrochemical experiments, including cyclic voltammetry and electrical impedance spectroscopy. Modifications to this design to allow for a wider array of operando measurements are discussed, as well as the potential for extending the temperature range of the chamber.
The main objectives for this temperature chamber are reliable temperature control while limiting condensation, allowing four 2032 coin cells to be cycled under these conditions. The primary cooling is obtained by using a commercial mini-fridge, but the temperature variations can be unreliable for experimental purposes. Therefore, this design uses an on-off controller that controls two thermoelectric modules to further regulate a small airtight chamber machined from acetal resin. Heat sinks and fans dissipate heat, allowing the thermoelectric modules to maintain a small temperature difference. Feedthroughs located on the lid allow for eight wires to pass through it to allow for battery cycling. A schematic representation of a cross-section of the design is represented in Figure 1A.
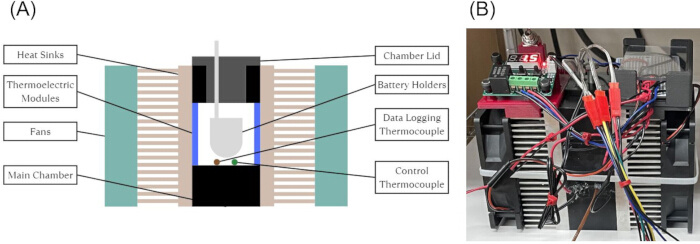
Figure 1: Temperature chamber. (A) Illustration of the low-temperature chamber with components labeled. (B) The as-assembled temperature chamber. Please click here to view a larger version of this figure.
Protocol
1. Manufacturing the chamber
- 3D printing components
- 3D print all of the STL files in Supplemental File 1 (Gasket Jig.stl, Heat Sink Clamp.stl, On-Off Mount.stl, Protoboard Mount.stl, Wire to Alligator Converter.stl, Wiring Station Bottom.stl, and Wiring Station Top.stl), except the Chamber.stl and Chamber Lid.stl files, using polylactic acid (PLA).
NOTE: The printing instructions are part of Supplemental File 2. For the first part of this protocol, parts from the Table of Materials will be italicized, and 3D printed parts will have their extension (.stl).
- 3D print all of the STL files in Supplemental File 1 (Gasket Jig.stl, Heat Sink Clamp.stl, On-Off Mount.stl, Protoboard Mount.stl, Wire to Alligator Converter.stl, Wiring Station Bottom.stl, and Wiring Station Top.stl), except the Chamber.stl and Chamber Lid.stl files, using polylactic acid (PLA).
- Milling the main chamber, lid, and heat sinks
- Mill the acetal resin block to stock blocks of 4" × 3.5" × 1.5" and 1.45" × 1.45" × 1.125".
CAUTION: Machining can be hazardous and result in personal injury. Steps that involve machining throughout this protocol should only be performed by trained professionals. - Use a computer numerical control (CNC) or manual milling machine to create the main chamber and lid as shown in the Chamber.stl and Chamber Lid.stl files in Supplemental File 1.
NOTE: The lid should be machined to ensure an airtight fit. An o-ring can be added to achieve a better seal. - Cut the Heat Sink into two 4" by 3.5" profiles.
- Drill through holes according to the Hole Layout.pdf file in Supplemental File 1.
- Drill holes in the heat sink fins to allow space for the cap screw heads.
- Screw a ¼"-20 X 1" bolt into the top of the lid. This bolt allows for easier removal of the lid from the chamber.
- Slide the four Battery Holders through the Battery Wiring Slider and then through the lid. Make sure that each of the battery holder tabs are in the ON position.
- Add Silicone to all wire holes going into the lid and allow to set.
NOTE: Any chemical waste generated during this procedure should be disposed of in accordance to the manufacturers' guidelines and material safety data sheets.
- Mill the acetal resin block to stock blocks of 4" × 3.5" × 1.5" and 1.45" × 1.45" × 1.125".
- Assembling the electronics
CAUTION: Electrical hazards. All electrical work should be performed by a trained professional.- Connect all the wiring in Figure 2 except the Thermoelectric Modules and 12 V Fans. These will be connected later.
- Solder the 12 V and ground lines to the Power Supply to the two-Wire Connector.
CAUTION: Soldering hazards include thermal injuries and inhalation hazards. Work should only be performed by a trained professional in a well-ventilated area.
- Assembling the chamber
- Create the gaskets by first cutting the Gasket Material using a cutting tool and the Gasket Jig.stl (Supplemental File 1) to make two Gaskets. Apply light pressure to avoid pulling the gasket from under the jig and cutting too much.
- Place a Gasket in one of the main chamber's side pockets so that it is flat in the pocket.
- Put the Thermoelectric Module wires through the side holes in the main chamber with the numbered (cold) side of the thermoelectric modules facing into the chamber.
- Apply a thin but complete layer of Thermal Grease to the thermoelectric non-numbered (hot) side.
- Apply a thin ring of Silicone to the chamber outside the Thermoelectric Module.
- Carefully place a heatsink on top of the main chamber. Screw ¼"-20 x 1" Cap Screws in the heat sinks into the main chamber to squeeze the silicone. This will form an airtight seal. Remove any excess silicone.
- Repeat on both sides. Wait for the silicone to set.
- Coat the bottom portion of the chamber lid sides with a thin layer of Vacuum Grease and slide it into the chamber.
- Slide the Datalogging Thermocouple and the thermocouple of the ON/OFF Controller into their respective holes in the side of the chamber.
- Add Silicone to all wire holes going into the chamber and allow to set.
- Place the two 12 V Fans on either side of the heat sinks, oriented to blow into the heat sinks. Use three Long Zip Ties to tighten the fans into place as shown in Figure 1B.
- Assembling the mounts and wiring
- Adhere the Switch Mount.stl and Protoboard Mount.stl in Supplemental File 1 to the Heat Sink Clamp prints with Instant Glue.
CAUTION: Chemical hazard. Use all chemicals as instructed by the manufacturer. - Slide the mounts onto the top row of the heat sinks. Place the Protoboard, ON/OFF Switch, Controller, and insulating material in their respective positions on the mounts. Ensure that the ON/OFF Switch is held in its mounting position with a piece of double-sided tape. Use a piece of plexiglass or any other insulative material and slide it into the Protoboard Mount.stl above the protoboard to help prevent accidental shorting.
- Using the Male/Female Crimp Set, crimp the male connectors onto the wires of each battery holder. Use 22 AWG Gauge Wire and wire connectors to connect the wires to wherever they are needed. Using needle-nosed pliers to hold on to the male side when separating these connectors is recommended to prevent excess stress on the wires themselves.
- Use the Wiring Station Bottom and Top.stl 3D prints (Supplemental File 1) to organize the wires.
- Use Spade Connectors and the Wire to Alligator Converter.stl 3D print (Supplemental File 1) to allow for an alligator-type connection to the cells.
- Adhere the Switch Mount.stl and Protoboard Mount.stl in Supplemental File 1 to the Heat Sink Clamp prints with Instant Glue.
- Final assembly
- After organizing the wires, solder the connections for the Thermoelectric Modules and the 12 V Fans. The chamber is now fully assembled.
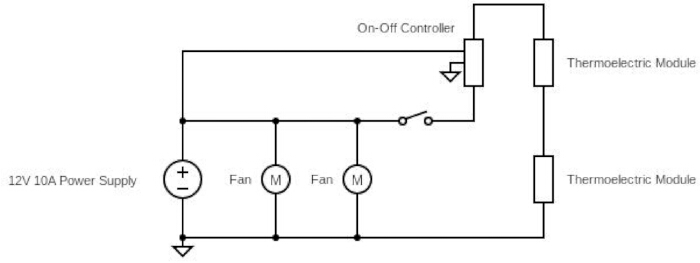
Figure 2: Electrical circuit schematic for the circuit controlling the chamber's cooling system. Please click here to view a larger version of this figure.
2. Using the chamber
- Controlling the chamber
- To cool the chamber to the appropriate temperature, turn the thermoelectric modules off with the manual ON/OFF switch. Connect to the power supply.
- Set the controller to be in cooling mode. Set the desired temperature to 0 °C and the turn-on differential to 0.1 °C. Set the range of temperatures to -55 °C to 24°C to prevent extreme overheating or overcooling in outlier circumstances.
NOTE: Adjust the temperature in the Fridge to be slightly warmer (~2 °C) than the desired temperature. The Fridge temperature should be warmer than the desired temperature for the ON/OFF controller to keep the temperature at the desired temperature, but the temperature cannot be too warm, or the thermoelectric modules will not be able to reach the desired temperature.
- Logging temperature
- Connect the datalogging thermocouple to the thermometer and place the chamber in the Fridge.
- Set the thermometer to stay on indefinitely and record the temperature every few seconds for 24 h.
NOTE: If working properly, the temperature in the chamber should not vary more than ± 1 °C. - When ready to begin cooling, turn the manual ON/OFF switch ON. The chamber is now ready for use.
- Opening the chamber and adding a battery
NOTE: If batteries are being actively measured, sample changes should be conducted quickly to prevent large temperature changes and to reduce condensation on the batteries. While work is being performed on the main lid, a temporary lid can be 3D printed to replace the main lid during sample changes using Temp Lid.stl contained in Supplemental File 3.- To open the chamber to add or remove batteries, place a screwdriver on the underside of the lid's bolt. Using the outer edge as a fulcrum, push down on the screwdriver's handle. Once the lid is loose, pull it out by hand and set it down on a flat surface or use Lid Holder.stl contained in Supplemental File 3 to 3D-print a lid holder. Replace the chamber lid with the temporary lid.
- Open the battery holders to be replaced and place the coin cell inside the holder.
- Remove the temporary lid and then the silica gel packet inside the chamber. Wipe away any moisture with a cloth and replace the silica gel packet in the chamber to help absorb any additional moisture.
- Replace the main lid and place the chamber back into the fridge.
NOTE: It may take up to 2 h for the temperature to re-equilibrate inside the chamber.
- Operando cycling at a low temperature
- Perform the cycling experiments once the desired temperature is reached.
- Continue logging the temperature to ensure the chamber stays at the desired temperature.
Results
The performance of the chamber was tested in three ways: (1) measurement of the temperature gradients across the chamber, (2) monitoring of the temperature over a 24 h period after initial construction and a 168 h period after 7 months of use, and (3) collection of cycling data for lithium-ion battery coin cells over 100 cycles or ~3 months. These results, discussed below, demonstrate that the chamber is able to maintain constant temperature over several months with an average temperature variation of less than 0.75 °C, resulting in consistent electrochemical cycling data.
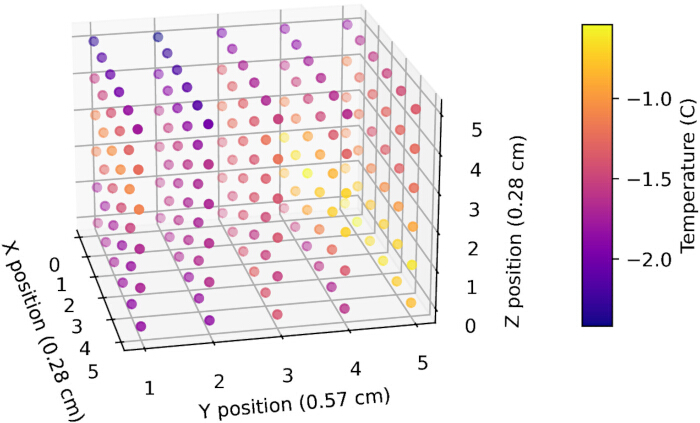
Figure 3: Three-dimensional temperature dependence of the cold chamber. The YZ plane is the plane depicted in Figure 1. A custom 2-axis temperature data logger was built that could be used inside the mini-fridge. Each data point represents a unique temperature measurement, resulting in an overall temperature variation throughout the chamber of ± 0.4 °C. Further description of data collection and analysis is provided in Supplemental File 2. Please click here to view a larger version of this figure.
Temperature gradient:
The temperature variation throughout the chamber was relatively consistent and only varied ± 0.4 °C, as seen in Figure 3. The variation showed a slightly warmer volume closer to the right thermoelectric module, which could be due to variation in the modules themselves or the amount of power being delivered to each.
The surface of the thermoelectric modules was consistently a few degrees colder than the air near it, so ensuring that the battery holders were not in contact with the modules was important for accurate temperature management. Using the battery holder alignment guide decreased the likelihood of contact between the holders and the modules.
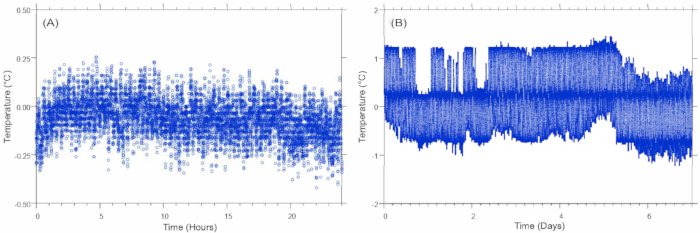
Figure 4: Temperature Variation with Time. (A) Initial temperature distribution soon after construction shows a variation of ± 0.13 °C std when measured every 10 s over a 24 h period. (B) After 7 months of use, the temperature distribution was measured every 10 s over a 1 week period, resulting in a variation of ± 0.75 °C std. More information about this data acquisition and Gaussian smoothing is provided in Supplemental File 2. Please click here to view a larger version of this figure.
Temperature monitoring:
The average temperature variation was measured every 10 s for 168 h after 7 months of use and can be seen to be stable over that period in Figure 4. The block-like nature of the data in Figure 4B is likely due to the quick oscillations of temperature. A more sophisticated control method could be used to lessen these oscillations if that were needed. The average temperature initially varied by ± 0.13 °C, as shown in Figure 4A, but increased over a 7 month period to ± 0.75 °C as shown in Figure 4B. This could be a sign that the chamber becomes more unstable as time goes on, but it could also be due to other factors, such as the lab's ambient temperature increasing. Nonetheless, the stability of the temperature over time is significant, and this level of temperature control is generally adequate for most low-temperature battery investigations. Additional details on the characterization of temperature inside the chamber is provided in Supplemental File 2.
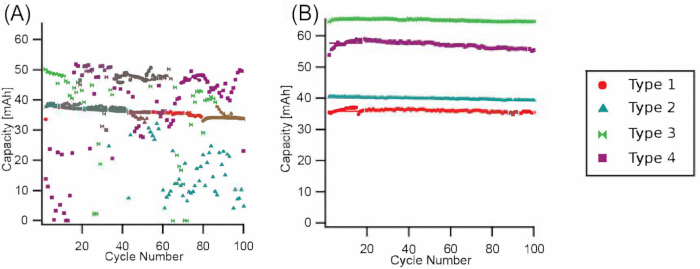
Figure 5: Battery capacity evolution over 100 cycles. (A) Cycling data using a circulating bath system for temperature control. Large variances in the capacity were observed due to temperature fluctuations and corrosion issues caused by condensation on the batteries. (B) Cycling data using the customized low-temperature chamber presented in this paper, exhibiting significantly less noise. Please click here to view a larger version of this figure.
Electrochemical cycling data:
To test the performance of the chamber in maintaining temperature during battery testing, galvanostatic cycling tests were performed on four commercially available 2032 Li-ion coin cell batteries. These coin cells were cycled at 0 ± 1 °C at a C-rate of C/7 for 100 cycles, which took ~3 months. The results are shown in Figure 5B. These data are compared to a previous generation of temperature chamber, which employed a Styrofoam-insulated aluminum chamber with a circulating bath containing antifreeze solution. The circulating bath method resulted in large deviations in the measured cell capacities, as observed in Figure 5A, and resulted in corrosion of the battery cells during repeated cycling. The new chamber design reported here shows a significant improvement in the measured cell capacities, highlighted by an improved temperature stability, absence of cell corrosion, and a significant reduction in noise in the data.
Proper operation of the chamber will be indicated by constant temperature maintained with only minor fluctuations, and electrochemical data that is free from unexplained or sudden changes such as erratic voltages, or sudden increases and decreases in cell capacity. After the chamber is initially assembled and turned on, it is advisable to log the temperature in the chamber for 24 h up to several days to ensure that there is not a gradual increase or decrease in temperature that would indicate the fridge settings need to be adjusted to optimize the heat dissipation.
Supplemental File 1: STL files for 3D printing. Files include Gasket Jig.stl, Heat Sink Clamp.stl, On-Off Mount.stl, Protoboard Mount.stl, Wire to Alligator Converter.stl, Wiring Station Bottom.stl, Wiring Station Top.stl, Chamber.stl, and Chamber Lid.stl files. Please click here to download this File.
Supplemental File 2: Printing instructions and temperature characterization. Please click here to download this File.
Supplemental File 3: STL files to 3D print the main lid and lid holder. Please click here to download this File.
Discussion
Critical steps:
There are several steps in the protocol that are critical to ensuring correct performance of the cold chamber. Care should be taken with the wire connections as these are necessary for the circuitry to work properly and ensure accurate data collection. Faulty wiring connections can result in erratic voltage readings and can be avoided by using a voltmeter to test wiring connections prior to putting the coin cells into the chamber.
Air leaks should be avoided as these would allow additional moisture into the chamber, which can condense on the cells and cause corrosion. Precision machining of the lid and other holes, as well as careful sealing with the gasket material and grease, will help ensure the long-term reliability and performance of the chamber. If the chamber is not airtight, condensation on the cells may result in corrosion that is usually indicated by erratic cell performance, such as sudden increases or decreases in cell capacity, and when cells are removed from the cell holders, they may appear to be leaking or discolored.
Finally, ensuring that the thermocouple used for data logging is accurately calibrated and properly positioned before sealing it into the chamber is important to reliably record the temperature performance of the chamber.
Modifications:
While this temperature chamber is specifically designed for 2032 coin cell experiments at 0 °C, this general design can be modified and optimized for a wide range of experiments that have similar environmental requirements. The coin cell holders for 2032 cells could easily be replaced with those for different coin cells. Different battery geometries (e.g., cylindrical, pouch) could also be accommodated by changing the battery holders but may require increasing the chamber dimensions. The chamber could be capable of reaching lower temperatures by increasing the power to the thermoelectric modules to greater than 12 V. The thermoelectric modules used in this design are rated to provide cooling to -40 °C. However, improved heat dissipation would be required, as well as testing to assess temperature gradients inside the chamber and ensure proper operation of all components at this reduced temperature. A printed circuit board could be used to both log the data and control the thermoelectric modules to remove the need for two thermocouples. Finally, if the chamber is being used primarily for humidity control and precise temperature control is not a concern, the lid and chamber design can be used without the thermoelectric modules, control system, and heat dissipation parts.
Troubleshooting:
Due to the simple design, most of the potential issues encountered should be relatively straightforward to fix. Corrosion of the batteries likely indicates an air leak, and ensuring all holes are sealed should be the first action against it. Noisy battery cycling data likely indicates a wiring issue or poor physical contact with the battery holders that can be fixed by improving the connections. It can also be a sign that condensation is forming on the cells, potentially leading to corrosion, so the system should also be checked to ensure it is air-tight. Inability to achieve the desired temperature can be due to numerous factors, such as improper thermal grease application, attempting to achieve a desired temperature outside the range of the thermoelectric modules, inadequate current and voltage provided to the modules, or ineffective heat dissipation.
Limitations:
A primary limitation of this chamber design is the requirement to pull out all four batteries to address any of them. This causes all four batteries to be exposed to other environments when any of them need to be taken out. This issue is difficult to mitigate with the current design. Another limitation is that if power is lost to the thermoelectric modules, the temperature in the chamber quickly rises. Thus, ensuring power will not be lost to the modules is paramount. Using an uninterrupted power supply and/or a backup generator to prevent undesired temperature changes could be beneficial if power outages are a concern.
Importance:
Batteries continue to suffer from significantly reduced performance at low temperatures, making it increasingly important for new research efforts into this problem. This temperature chamber design was made specifically to cycle 2032 coin cell batteries at a low temperature while limiting condensation and corrosion. Another key goal was to produce a design that is cost-effective and easy to assemble. Specially made commercial alternatives to this design are typically expensive, and other low-cost options, for example, using a standard refrigerator, do not thoroughly prevent condensation and can exhibit increased temperature variation2,3,14. Therefore, this design can be a low-cost, fast-to-implement option for researchers who want to perform low-temperature battery cycling studies without straining their research budgets.
Disclosures
The authors have no conflicts of interest to disclose.
Acknowledgements
The authors wish to acknowledge J. Johnson, Swarthmore College Engineering Department, for his help with the initial machining of the chamber. This work was supported by the National Science Foundation Grant Number 2430817.
Materials
| Name | Company | Catalog Number | Comments |
|---|---|---|---|
| 1/4"-20 X 1" Cap Screws | Grainger | 4XE35 | need 9; 8 for heat sinks, 1 for lid |
| 12 V Fans | Digikey | 2223-CFM-9225C-130-356-ND | need 2; used to circulate air to heat sinks |
| AC to 12 V 10 A Connector | Digikey | AD-EL-1201200-Z | converts wall power |
| Acetal Resin | McMaster | 8575K148 | 1.5" x 6" x 6" stock |
| Battery Holders | Digikey | 36-1086-ND | need 4; 2 extra |
| Battery Wiring Slider | N/A | N/A | 3D Printed from PLA |
| Datalogging Thermocouple | ExTech | 872501-S | a preferred thermocouple can be substituted |
| Electronic Development Board | Adafruit | 3000 | see Supplemental File 2 |
| Electronic Temeprature Logging System | Arduino | A000066 | see Supplemental File 2 |
| Fridge | Magic Chef | MCR170BE | a standard refrigerator can be substituted |
| Gasket Jig | N/A | N/A | 3D Printed from PLA |
| Gasket Material | McMaster-Carr | 5542N125 | |
| Heat Sink | Digikey | 345-127709-ND | need 1; cut into 2 heat sinks |
| Heat Sink Clamp | N/A | N/A | 3D Printed from PLA |
| Instant Glue | Loctite | 234790 | Also known as Super Glue |
| Lid Holder | N/A | N/A | 3D Printed from PLA |
| Long Zip Tie | Digikey | 2162-AL-14-50-0-C-ND | pack of 100, need 4 or less |
| Male/Female Crimp Set | Mouser | 474-PRT-10501 | need 8, should get 4 spares too |
| ON/OFF Controller | Amazon | 7.38587E+11 | pack of 2 |
| Power Supply to 2 Wire Connector | Digikey | CP-024A-ND | need 1 |
| Protoboard | Adafruit | 1609 | need 1 |
| Protoboard Mount | N/A | N/A | 3D Printed from PLA |
| Short Zip Tie | Southwire | BL4M2-C | pack of 100 |
| Silica Gel | McMaster | 2189K14 | used to absorb any additional moisture |
| Silicone | Loctite | 908570 | need very little |
| Spade Connectors | McMaster | 7060K79 | need 8, should get spares |
| Stranded 22 AWG Wires | Adafruit | 3175 | preferred wiring can be substituted |
| Switch Mount | N/A | N/A | 3D Printed from PLA |
| Temp Lid | N/A | N/A | 3D Printed from PLA |
| Thermal Grease | Wakefield | 120-5 | need very little |
| Thermoelectric Modules | DigiKey | 102-1682-ND | need 2; Manufacturer Product #: CP85438 |
| Thermometer | ExTech | EA15 | a preferred thermometer can be substituted |
| Vacuum Grease | DuPont | 2708493 | need very little |
| Wire to Alligator Converter | N/A | N/A | 3D Printed from PLA |
| Wiring Station Bottom | N/A | N/A | 3D Printed from PLA |
| Wiring Station Top | N/A | N/A | 3D Printed from PLA |
References
- Rodrigues, M. -T. F., et al. A materials perspective on Li-ion batteries at extreme temperatures. Nat Energy. 2 (8), 17108(2017).
- Chen, Q., Yang, Z., Zhai, P., Luo, W., Gong, Y. Lithium batteries operating at wide temperatures: opportunities and challenges. Adv Funct Mater. 35 (13), 2417923(2025).
- Zhang, N., et al. Critical review on low-temperature Li-ion/metal batteries. Adv Mater. 34 (15), 2107899(2022).
- Gupta, A., Manthiram, A. Designing advanced lithium-based batteries for low-temperature conditions. Adv Energy Mater. 10 (38), 2001972(2020).
- Hou, J., Yang, M., Wang, D., Zhang, J. Fundamentals and challenges of lithium ion batteries at temperatures between -40 and 60°C. Adv Energy Mater. 10 (18), 1904152(2020).
- Adams, R. A., Varma, A., Pol, V. G. Temperature dependent electrochemical performance of graphite anodes for K-ion and Li-ion batteries. J Power Sources. 410 - 411 (1), 124-131 (2019).
- Yaqub, A., et al. Low temperature performance of graphite and LiNi0.6Co0.2Mn0.2O2 electrodes in Li-ion batteries. J Mater Sci. 49 (22), 7707-7714 (2014).
- Luo, H., et al. Lithium-ion batteries under low-temperature environment: challenges and prospects. Materials. 15 (22), 8166(2022).
- Senyshyn, A., Mühlbauer, M. J., Dolotko, O., Ehrenberg, H. Low-temperature performance of Li-ion batteries: the behavior of lithiated graphite. J Power Sources. 282 (1), 235-240 (2015).
- Liao, L., et al. Effects of temperature on charge/discharge behaviors of LiFePO4 cathode for Li-ion batteries. Electrochim Acta. 60 (1), 269-273 (2012).
- Jaguemont, J., Boulon, L., Dubé, Y. A comprehensive review of lithium-ion batteries used in hybrid and electric vehicles at cold temperatures. Appl Energy. 164 (1), 99-114 (2016).
- Senol, M., Bayram, I. S., Naderi, Y., Galloway, S. Electric vehicles under low temperatures: a review on battery performance, charging needs, and power grid impacts. IEEE Access. 11 (1), 39879-39912 (2023).
- Xu, J., et al. Extending the low temperature operational limit of Li-ion battery to -80°C. Energy Storage Mater. 23 (1), 383-389 (2019).
- Kim, W. -K., et al. Water condensation in traction battery systems. Energies. 12 (6), 1171(2019).
Reprints and Permissions
