This protocol describes a high-throughput approach for evaluating plant ion leakage, peroxidase activity, and callose production in the same sample.
Method Article
Evaluating Leaf Responses to Microbial Secondary Metabolites Using A High-Throughput Format
In This Article
Summary
Abstract
Microbes secrete structurally diverse secondary metabolites during plant infection, some of which are detected by plant cells, which trigger stress responses. In this method, the induction of ion leakage, peroxidase activity, and callose production is measured in the same leaf disk sample. First, Arabidopsis or barley leaf disks are vacuum infiltrated in a 96-well plate. After 4-6 hours, conductivity is measured, followed by peroxidase activity and callose deposition at 24 hours. The flg22 peptide induces all three responses and is an affordable positive control. Surfactin and gramillin cyclic lipopeptides induce peroxidase activity and ion leakage, respectively, while the phytotoxic T-2 trichothecene suppresses peroxidase activity. Overall, this approach enables multiple comparisons across either plant genotypes or metabolite treatments. This approach can be applied to chemical genetics or bioprotection to identify stress-modulating compounds for further study. In plant genetics, this approach can be used to compare responses across plant populations for genetic mapping and to improve our understanding of plant-microbe interactions.
Introduction
Plants respond to diverse microbial molecules to activate cellular stress responses, which can culminate in disease resistance. Microbe-associated molecular patterns (MAMPs), such as the flg22 peptide from bacterial flagellin, are detected by plant receptor proteins to initiate a number of cellular signaling responses. These include early responses such as kinase cascades, reactive oxygen species (ROS) production, calcium spiking, membrane depolarization, and late responses like callose deposition and peroxidase activity induction1. Microbial secondary metabolites (MSMs) are small (50-1,500 Daltons), structurally diverse molecules that are dispensable for growth and development but promote the survival of the microbe. Some MSM induce cellular stress responses in plants, though the mechanisms involved in initiating these responses remain unresolved2,3. Proposed mechanisms for plant recognition of MSM include mechanosensing, redox-induced protein modifications, or lipid-based signaling4,5. In some cases, MSM induces stress responses or causes cellular damage depending on the concentration. For example, the T-2 toxin induces callose and ROS production at 1 µM and causes cell death at 10 µM, and is typically described as a phytotoxin4. MSMs influence pathogenesis in some plant-microbe interactions and can trigger either plant susceptibility or resistance. For example, the gramillin cyclic lipopeptide induces ROS production, ion leakage, and callose production while enhancing barley susceptibility to Fusarium graminearum2. The syringomycin and syringopeptin cyclic lipopeptides induce plant ROS production and promote host resistance against the Pseudomonas fluorescens bacteria3. Other MSM, such as surfactin and iturin, are produced by non-pathogenic microbes and promote resistance against subsequent pathogen infection by inducing plant stress responses6,7. These bioprotective MSM induce cellular responses, including ion fluxes, ROS production, transcriptional changes, and callose production8. Understanding interactions between MSM and plants could help to determine the role of MSM in disease resistance and identify host genes that could be leveraged to improve crop resistance.
Current methods to evaluate MSM-induced plant stress responses typically involve testing one stress response at a time8. Given that secondary MSM can be difficult to extract and a limited amount of metabolite might be available, testing for multiple responses within the same sample can provide reassurance that the MSM has an effect on plant cells. One high-throughput method for evaluating apoplastic ROS bursts is detecting luminescence generated by oxidized luminol in the presence of horseradish peroxidase9. Unfortunately, the luminol-based luminescence is quenched by cations and some solvents, limiting the usage of this assay for extracts that contain salts or for non-polar molecules that must be dissolved in DMSO, necessitating a method that works with these contaminants9. To address these issues, we extended current methods to evaluate three stress responses (ion leakage, peroxidase activity, and callose) from the same leaf sample in a high-throughput assay (Figure 1)10,11,12. Our approach involves treating leaf disks with MSMs using vacuum infiltration in a 96-well plate. Next, conductivity measurements are made at 4-6 h after treatment to evaluate ion leakage, followed by peroxidase activity and callose deposition measurements at 24 h. Our approach has been optimized for Arabidopsis and barley but could be extended to other plant species with experimental validation. For example, induced barley peroxidase activity is not detectable with this method, but suppression of activity by toxic compounds can be detected. Thus, leaf characteristics or amplitude of the induced response vary between species, which limits the applicability of this approach to some plant species.
Experimental design using this method should take into account the controls, replication, and concentration of MSM being used to ensure the best results. A negative control is essential to identify MSMs that induce statistically different levels of stress response compared to the effects of wounding. Ideally, the negative control would contain the same solvent as the MSM but lacking the MSM. Typical solvents for hydrophobic MSM include DMSO and methanol, which induce cellular responses such as ROS production at high concentrations13,14. In this assay, we observe an impact on peroxidase activity, where 10% or higher DMSO and methanol block flg22-induced peroxidase activity (Figure 2). In the case of complex extracts, it may be difficult to develop a negative control lacking any MSM when the metabolites of interest are unknown. Instead, fractionating the extracts based on size, polarity, or charge would enable relative comparisons between fractions to identify the most stress-inducing fraction for further analysis. In addition, including a positive control, such as 1 µM flg22 or 10 µM T-2 toxin, ensures that the researcher can evaluate that the assay is functioning. We recommend including four technical replicates per treatment and including positive and negative controls in each plate when multiple plates are being measured within an experiment.
Overall, this approach captures three MSM-induced plant stress responses, offering an accessible and cost-effective method to survey plant-MSM interactions. The high-throughput format allows researchers to capture subtle differences between plant genotypes or microbial extracts within the same experimental unit. This enables system-level approaches to understand plant gene families or to survey plant populations for genetic mapping. On the microbe side, this approach could be used to screen for potential bioprotective compounds or in chemical genomics to identify compounds that enhance or suppress specific stress responses.
Protocol
1. Sample preparation and treatment
NOTE: All proper safety precautions and disposal practices should be taken to minimize risk to the experimenter and the environment.
- Plant cultivation
- Grow Arabidopsis to the 4-5-week-old stage on Cornell soil mixture (300 peat moss:630 vermiculite:1 slow-release fertilizer:4.2 lime) with two plants per pot in 24 pots per tray. Water the plants as needed from below by adding water to the tray. Set the growth chamber conditions to 21 oC continuously with 16 h of light and 8 h of dark, and keep at approximately 30-50% humidity. Use the 5-9th fully expanded leaves for experimentation and harvest in the morning.
- Grow barley until the first and second true leaves are fully expanded in 75 potting soil: 24 black earth: 1 lime soil mix. Plant one seed per pot in 24 plots per tray, watering as needed. Set growth chamber conditions to 21 oC with 16 h of light and 8 h of dark at approximately 30-50% humidity. Sample the first and second fully expanded leaves and harvest in the morning.
- Collect three leaf disks per plant using a 4 mm diameter cork borer, avoiding the midvein. Avoid macerating the tissue by using a sharp borer with a twisting motion.
- Immediately and gently place the leaf disks into one well of a 96-well plate in 196 µL of sterile Milli-Q H2O. Continue collecting disks until the required number of samples has been collected.
- Add secondary metabolites or solvent treatments at the desired concentration to a final volume of 200 µL into individual wells.
- Place the 96-well plate with the lid off into a bell jar with a vacuum nozzle.
- Attach the vacuum hose to the bell jar nozzle and turn on the vacuum pressure until the vacuum reaches 9.8 pounds/square inch (typically 10 seconds). Repeat this process one more time.
- Place the lid on the plate and incubate on an orbital shaker (55 rpm) under light (13 W, 50 µmol∙m-2∙s-1) placed 23 cm above the shaker for 4 h.
2. Ion leakage measurements
- Wash the probe in Milli-Q water and dab lightly on Kimwipe to dry. Note the conductivity reading of the water for reference.
- At 4-6 h after treatment, sample and record conductivity from individual wells by immersing the probe in the liquid surrounding the leaf disk. Hold the plate at a 45° angle to ensure the probe is fully emersed.
- Rinse the probe between samples by immersing in Milli-Q water and dabbing the probe dry on a Kimwipe. Occasionally, test the conductivity of the water to ensure the probe readings remain stable.
- Place a plastic sealing film on the plate and return to the orbital shaker for incubation overnight.
3. Peroxidase activity measurements
- Prepare the peroxidase substrate fresh daily as a 50 mL solution. Heat 40 mL of distilled sterile water to 70 oC in a beaker with a stir bar and dissolve 50 mg of 5-aminosalicylic acid (1 mg/mL) in the heated water. Add water up to 50 mL and adjust the pH to 6 using NaOH. The solution is light-sensitive, so cover with aluminum foil or use an amber tube.
- In a 50 mL amber conical tube, make a 1% H2O2 solution by adding 1.7 mL of 30% H2O2 to 48.3 mL of Milli-Q H2O.
- Immediately before the assay, add 10 µL of the 1% H2O2 solution per milliliter of 5-aminosalicylic solution required for the assay to generate the assay medium.
- To sample the treated leaf disks, take 50 µL from each well at the desired time point. Transfer to a clear, flat-bottomed 96-well plate and add 50 µL of the assay medium, mixing by pipetting 5x.
- Incubate the reaction at room temperature for 3 min and stop the reaction by adding 20 µL of 2 N NaOH, tapping gently to mix.
- Measure the absorbance of the wells at 595 nm in a plate reader.
4. Callose imaging and image analysis
- After sampling the wells for the peroxidase assay, remove the remaining liquid from the wells and add 100 µL of an acetic acid:ethanol (1:3) solution for fixation and destaining. Place a lid on the plate and incubate the plate on a shaker (60 rpm) in a fume hood for 24 h at room temperature.
- Replace the destaining solution with fresh solution and incubate for another 24 h at room temperature.
- Pipette out the destaining solution and add 100 µL of 150 mM K2HPO4 to each well. Place the plate on the shaker and incubate for 30 min at room temperature.
- Remove the K2HPO4 wash solution and add 100 µL of 150 mM K2HPO4 with 0.1 mg/mL aniline blue. Cover the 96-well plate with a cover and aluminum foil and incubate on a shaker for at least 2 h (Arabidopsis) or overnight (barley).
NOTE: Aniline blue is light sensitive and should be made fresh for each technical replicate. - Remove the aniline blue solution and replace with 50% glycerol. Cover the 96-well plates in aluminum foil and store at 4 °C until ready to image.
- Place a drop of 50% glycerol solution on a clean glass slide. Gently pick up a leaf disc with tweezers and place it abaxial side up on the slide. Cover with a 1.5 coverslip, minimizing air bubbles, and add additional 50% glycerol if necessary to fill underneath the coverslip.
- Bring the leaf material into focus using transmitted white light (bright field) under a 20x dry objective lens.
- Select the excitation wavelength to 370 nm and the emission wavelength to 509 nm for aniline blue imaging and set an exposure time. Optimize the exposure time to enable sufficient signal but avoid oversaturation of pixels. For quantitative comparison of images, ensure that the laser intensity and exposure time are consistent for all biological replicates, treatments, and technical replicates.
- For each leaf disc, select three different fields of view and acquire images for each using the parameters set in step 4.8. Acquire all images with plant material completely filling the field of view with minimal regions of background (non-plant material). Acquire images on a single z-plane on the leaf surface.
NOTE: Having some background might be unavoidable and can be corrected for in later image quantification steps. In this example, images are taken using an upright epifluorescence microscope with a mercury lamp and the DAPI filter cube (excitation 360/40 nm, emission 460/50 nm). In cases where a mercury lamp is not available, a multi-wavelength LED light source can be used. - To quantify callose spots from images, download and install the freely available FIJI image processing software using the instructions online at https://imagej.net/Fiji/Downloads. Open FIJI and import the aniline blue images for analysis. For this analysis, use .tiff files with resolution of at least 300 dpi. Export image files in .tiff format using the microscope software prior to analysis, or let FIJI open the files.
NOTE: Fiji can open most proprietary file types (e.g., .czi, .nd2, .lif, .vsi). - Set the scale on the image (click Analyze | Set Scale), using the distance values from the microscope setup.
- Convert the image to a 32-bit greyscale image (click Image | Type | 32 bit).
- Adjust the threshold (click on Image | Adjust | Threshold) to only include fluorescence signal that represents aniline blue staining by clicking Auto and then manually adjusting the minimum and maximum values on the threshold curve. Once the threshold is finalized, click Apply | Convert to Mask. Using spreadsheet software, write the selected threshold parameters for each image.
NOTE: Due to the inherent autofluorescence of plant samples and clearing of the plant tissue, the threshold may differ between samples. For reproducibility, it is essential to record the threshold of each image and be consistent in adjusting threshold values between samples. - Quantify the number and size of aniline blue puncta using Analyze Particles (click Analyze | Analyze Particles) using the default settings. For average values of all puncta in the image, select Summarize in the pop-up box, then click OK.
- Copy and paste these results from the Summary box into the spreadsheet with the threshold parameters for further analysis. Values included in this quantification include the Count (number of aniline blue puncta), Total area (total area in units2 of aniline blue puncta), Average size (average size in units2 of aniline blue puncta), %Area (percentage of average cover in units2 of aniline blue fluorescence versus total area), Perimeter (average perimeter of puncta), and IntDen (indication of fluorescence intensity of aniline blue staining).
- Repeat steps 4.11-4.15 for all images acquired during the experiment. When closing a thresholded image from FIJI, select Don't Save to avoid changing the raw data image to have the threshold mask.
- If any images contain area with non-plant background, measure the area of the plant tissue by manually outlining the region of plant tissue using the Polygon or Freehand selection tools and measuring the Area (click Analyze | Measure). Copy this value into the spreadsheet for each image.
- In a spreadsheet, average the values from the three field-of-view images from one biological replicate. If some images from the experiment contain non-plant area (see step 4.17), correct all values based on the area of plant tissue in each image. For example, divide the Count value by the area of plant tissue for each image prior to graphing and statistical comparisons.
5. Data analysis
- Evaluate the quality of the experiment by comparing positive controls to the negative controls within the same plate using a t-test. If the positive controls did not produce significant changes in stress responses, re-evaluate experimental conditions such as the health of the plants, the timing of treatment, the negative control, and the potential deterioration of the MSMs.
- Significance testing
- If all the technical replicates of a treatment are evaluated within the same plate, analyze the differences between individual treatments and the negative control using standard statistical approaches such as a one-way ANOVA with a Tukey test.
- If technical replicates of a treatment were evaluated across multiple plates, normalize each sample relative to the negative control to minimize the influence of plate-to-plate error. Divide each value by the average of the negative control samples from within the same plate. Subject the normalized values to standard statistical methods.
Results
Using this method, one can determine if an MSM activates a subset of plant cellular stress responses. The results of this assay provide quantification of peroxidase activity, ion leakage, and callose production to determine if an MSM induces differential responses compared to a negative control. A positive result for a compound would be indicated by a significant difference from the negative control, as shown for the gramillin ionophore, which induces ion leakage and callose production (Figure 3)2. Including a positive control, such as 1 µM flg22, which induces all three responses, ensures intact plant performance and experimental conditions (Figure 3)11,15. Gramillin and flg22 are dissolved in water, while the hydrophobic surfactin and T-2 toxin are dissolved in DMSO. To prepare hydrophobic molecules, we first prepare a 10 mM stock in DMSO. This stock is used to create a final concentration of 10 µM in Milli-Q water for leaf treatment which contains 0.1% DMSO. Surfactin (10 µM) induces peroxidase activity and callose, while the T-2 toxin (10 µM) suppresses peroxidase activity and induces callose production, likely due to cell death2,6,16. Using either water or 0.1% DMSO as negative controls is appropriate for the indicated treatments, as both controls produce similar results (Figure 2).
In our preliminary screens of 100 commercially available MSM, we see callose induction for most compounds we have surveyed (>70%) while ion leakage and peroxidase activity are triggered by fewer compounds (30% and 35%). The majority of these compounds are produced by Fusarium species, including seven different trichothecenes such as deoxynivalenol (DON) and T-2 toxin. While further replication is ongoing to confirm these results, they indicate similar trends as seen with our positive controls (Figure 3) where callose was induced by all treatments and ion leakage or peroxidase was triggered by some but not all of the treatments.

Figure 1: Overview of the procedure to evaluate MSM-induced cellular responses in leaves. Leaf disks are placed in a 96-well plate containing the treatments of interest, and the disks are vacuum-infiltrated. Each plate contains four replicates of a negative control (water with solvent) and a positive control (flg22 or T-2 toxin). After 4-6 h, the conductivity of the liquid surrounding the leaf disk is measured as a quantification of ion leakage. After 24 h, peroxidase activity is quantified using a colorimetric assay using the liquid surrounding the leaf disk, and the leaf disk is destained and processed for callose quantification. Abbreviation: MSM = microbial secondary metabolite. Please click here to view a larger version of this figure.
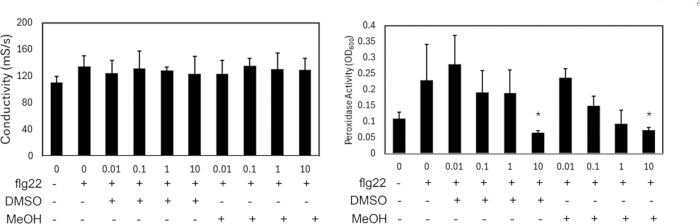
Figure 2: The effect of solvent on flg22-induced ion leakage or peroxidase activity. Four replicate Arabidopsis samples were treated with 1 µM flg22 combined with DMSO or methanol (0, 0.01, 0.1, 1, 10%). Bar graphs show the average conductivity of the sample after 4 h or the peroxidase activity (OD600) at 24 h after treatment from a single experiment (n = 4, SD). The experiment was repeated twice with similar results. Significant difference from the water control was determined by t-test and indicated by an asterisk (p < 0.05). Abbreviations: DMSO = dimethyl sulfoxide; MeOH = methanol. Please click here to view a larger version of this figure.
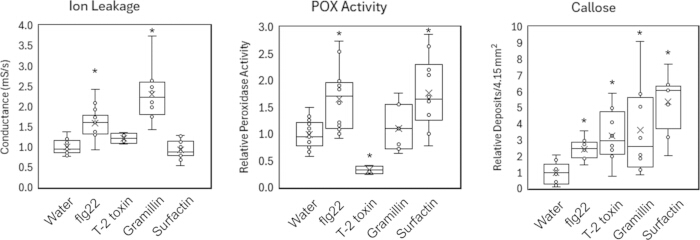
Figure 3: Induction of ion leakage, peroxidase activity, or callose deposition in Arabidopsis leaf disks by microbial-derived molecules. Treatments included the immunogenic, non-toxic peptide flg22 (1 µM), the cyclic lipopeptides gramillin and surfactin (10 µM), and the T-2 toxin (10 µM)2,6. All data were normalized to the water + 0.1% DMSO control. Box-and-whisker plots show the conductivity of the sample after 4 h, the peroxidase activity (OD600) after 24 h, or the number of callose deposits after 24 h from a single experiment (n = 4-16 plants). The box plots indicate an 'x' to show the value of the mean, and the boxes indicate the first quartile, median, and third quartile of treatment. The highest and lowest observations that are not outliers are indicated by the whiskers (>1.5x interquartile range, indicated by circles). Significant difference from the water control is indicated by an asterisk and was determined by one-way ANOVA with a Tukey test (p < 0.05). Please click here to view a larger version of this figure.
Discussion
Plant colonizing microbial communities secrete diverse MSMs to facilitate biofilm formation, suppress competing microbes, and influence the plant host17. While some MSMs have no impact on the plant, others induce rapid cell death, suppress cell function, or induce plant resistance17. Some MSMs influence plant resistance to the MSM-producing microbe, and resistant genotypes can be selected based on MSM insensitivity2,3,18. Other MSMs induce systemic resistance and provide protection against microbial pathogens, which has been used in agriculture to develop bioprotective products to suppress disease8. To develop effective and sustainable crop improvement strategies, identifying beneficial MSMs and the plant genes that enable optimal MSM responsiveness is essential.
Finding beneficial MSMs is complicated by the fact that these compounds are produced enzymatically, where multiple enzymes are required for the finished product2. This makes it difficult to determine which gene to target to abolish MSM production for genetic studies. Enzymatic biosynthesis results in multiple structural variations of the same MSM with potentially different bioactivities19. Separating and purifying these MSMs to find the bioactive molecules can be time-consuming or impossible. In some cases, only low concentrations of individual MSMs can be purified, taking multiple rounds of purification2. Once a bioactive compound or extract is obtained, several approaches can be used to understand how the microbe might be affecting the plant.
Past efforts have focused on monitoring the impact of MSM on transcriptional reprogramming or bioprotection in model plants20. To evaluate MSM responses beyond model plants, high-throughput assays that capture responses to diverse MSMs and require minimal MSMs are potentially useful. Recent work indicates that ROS bursts are a common early response to MSMs, including gramillin, surfactin, syringomycin, and syringopeptin2,3,7. A luminol-based assay detects the apoplastic ROS burst generated by peroxidases and NADPH oxidases and is amenable to high-throughput testing21. Unfortunately, intracellular ROS induced by MSMs, like surfactin, are not detectable using this method7. Quantifying peroxidase activity provides a more sensitive alternative than the luminol-based assay to detect the transient activation of ROS-producing enzymes during stress11. Our observation that surfactin induces peroxidase activity is in line with recent work showing that peroxidase activity is triggered by surfactin and beauvericin in Arabidopsis (Figure 3)2. In addition, we showed that flg22 and the ionophore gramillin induced ion leakage, and all of the tested compounds, including flg22, T-2 toxin, surfactin, and gramillin, induce callose as expected (Figure 3)2,4,7.
By evaluating multiple responses within the same sample, we minimize experimental variation in evaluating each of these traits separately and enable correlation between traits for system-level studies on plant stress responses. Evaluating multiple treatments or genotypes within the same experimental unit also enables population-level phenotyping for population genetics. For example, a similar approach was used to identify a QTL underlying flg22-induced ROS production in barley22. This assay can also be used for chemical genetics screens to find modulators of plant stress responses or to identify potential bioprotective MSMs from microbial extracts.
To ensure the experimental method is working within the system of interest, researchers should consider the following factors and limitations:
Quality of the leaf tissue
Ensure that plant leaf tissue is not stressed prior to harvesting. Signs that plants are stressed vary between species but generally include wilting, yellowing, redness, spots, excessive leaf curling or rolling. Sampling leaf tissue causes wounding, so avoiding excessive maceration of the tissue will reduce background error due to handling.
Plant Species
This protocol is optimized for use with barley and Arabidopsis leaves. Barley leaves require a longer staining time for callose than Arabidopsis, likely due to the thicker cuticular wax in grasses, which increases hydrophobicity and limits diffusion of treatments into the leaf23. This may also partially explain the lack of peroxidase activity induction using our method, though we were able to see suppression of peroxidase activity by toxic compounds similar to what we presented in Arabidopsis (Figure 3). We did try to increase the number of leaf disks per sample to 5, adjusting the pH to 5, 6, or 7, increasing the number of vacuum infiltrations to 10, and modifying the substrate concentration or changing the substrate to guaiacol24. While we saw increased peroxidase activity with more leaf disks and rounds of infiltration, the differences between the negative control and flg22 remained small (10% increase with flg22) or non-significant across experiments. We know that barley responds to flg22 by inducing ROS production, callose production, and peroxidase expression25,26. In maize roots, protein extracts displayed MAMP-induced peroxidase activity, suggesting that extracting protein may be required to see the induction, as opposed to detecting the protein activity leaching from leaf disks, as is done in our assay24. In our assay, wounding clearly induces peroxidase activity in the negative control sample, because this activity disappears when the cells die due to toxin exposure. It is possible that the flg22 treatment could induce the same peroxidases as wounding, so that it would appear that no induction has occurred. Alternatively, our assay may not be sensitive enough to detect subtle changes, or the peroxidases may not be diffusing well into solution.
To apply this protocol to other plant species, we would suggest using the method as described and including Arabidopsis alongside as a control to ensure the protocol is working. If the peroxidase activity seems low, then increasing the number of leaf disks per sample, increasing the number of vacuum infiltrations to 5 or 10, and trying different treatments, including other MAMPs, ionophores, or T-2 toxin, could provide a positive result.
Negative control treatments
This method is dependent on an effective and appropriate negative control for comparisons. Ideally, a negative control would contain the same background solvent as the MSM treatment of interest but with no MSM. The background solvent would be water or would have the same impact on the measured stresses as water. This is a practical approach in cases where the MSM is already purified and can be dissolved in a solvent of choice. When comparing microbial extracts, a negative control might be the by-product of partial purification of the MSM, containing the same background media but with reduced MSM concentration after fractionation. Or the experimenter could use the culturing media used to generate the MSM-containing extract as a negative control. In these more complex samples, the negative control could contain salts that inflate the conductivity measurement, or solvents can suppress the peroxidase activity (Figure 2). To determine if salts are influencing the ion leakage results, the experimenter could test the conductivity of the negative control and sample in the absence of a leaf disk to determine if the sample or the leaf is generating changes in conductivity. To determine if solvents are affecting the peroxidase responses, the experimenter can add flg22 to the negative control and compare the result to flg22 dissolved in water to determine if there is a difference. It is possible that solvents, tinted compounds, or excessive salts in a negative control could obscure the effects of MSM on the outlined plant stress responses, and thus, this approach will not be suitable in all scenarios.
Sampling time
It is important to initiate treatments in the morning, as inducible defense responses follow a circadian cycle and have the highest amplitude early in the morning27. In our experience, Arabidopsis produces ion leakage in response to gramillin faster (4 h) than barley and maize (4-7 h), and thus, a time course may be required to establish experimental parameters2,28. Cell responsiveness decreases over time, and we would not recommend testing stress responses beyond 30+ hours after treatment.
Concentration
MSM concentration can have a non-linear impact on inducing plant stress responses, which is a phenomenon called hormesis20. Depending on the availability and solubility of the MSM, experimenters would ideally test plant stress responses across a range of MSM concentrations. Typical concentrations vary between 100 nM and 1,000 µM as a starting point2,11,20.
Disclosures
The authors have no conflicts of interest to declare.
Acknowledgements
Financial support was provided under the Sustainable Canadian Agricultural Partnership (#20230098), a federal-provincial-territorial initiative.
Materials
| Name | Company | Catalog Number | Comments |
|---|---|---|---|
| 5-aminosalicylic acid | Millipore Sigma | A79809 | |
| Barnart vacuum pump | Artisan Technology Group | 400-3910 | |
| COND-905 micro conductivity probe | Lazar Research Laboratories Inc. | ||
| flg22 peptide | AnaSpec | AS-62633 | |
| Infinite 200PRO F | TeCan Group Ltd. | 30190086 | |
| Surfactin | Sigma-Aldrich | S3523 | |
| T-2 toxin | Cayman Chemical Company Inc | 20433 |
References
- Yu, X., Feng, B., He, P., Shan, L. From chaos to harmony: responses and signaling upon microbial pattern recognition. Annu Rev Phytopathol. 55 (1), 109-137 (2017).
- Brauer, E. K., et al. A cyclic lipopeptide from Fusarium graminearum targets plant membranes to promote virulence. Cell Rep. 43 (7), 114384(2024).
- Thoms, D., et al. Innate immunity can distinguish beneficial from pathogenic rhizosphere microbiota. bioRxiv. , (2023).
- Nishiuchi, T., et al. Fusarium phytotoxin trichothecenes have an elicitor-like activity in Arabidopsis thaliana, but the activity differed significantly among their molecular species. Mol Plant Microbe Interact. 19 (5), 512-520 (2006).
- Schellenberger, R., et al. Apoplastic invasion patterns triggering plant immunity: plasma membrane sensing at the frontline. Mol Plant Pathol. 20 (11), 1602-1616 (2019).
- Henry, G., Deleu, M., Jourdan, E., Thonart, P., Ongena, M. The bacterial lipopeptide surfactin targets the lipid fraction of the plant plasma membrane to trigger immune-related defence responses. Cell Microbiol. 13 (11), 1824-1837 (2011).
- Pršić, J., et al. Mechanosensing and sphingolipid-docking mediate lipopeptide-induced immunity in Arabidopsis. bioRxiv. , (2023).
- Crouzet, J., et al. Biosurfactants in plant protection against diseases: rhamnolipids and lipopeptides case study. Front Bioeng Biotechnol. 8, 1014(2020).
- Khan, P., et al. Luminol-based chemiluminescent signals: clinical and non-clinical application and future uses. Appl Biochem Biotechnol. 173, 333-355 (2014).
- Schenk, S. T., Schikora, A. Staining of callose depositions in root and leaf tissues. Bio-protoc. 5 (6), e1429(2015).
- Mott, G. A., Desveaux, D., Guttman, D. S. A high-sensitivity, microtiter-based plate assay for plant pattern-triggered immunity. Mol Plant Microbe Interact. 31 (5), 499-504 (2018).
- Hatsugai, N., Katagiri, F. Quantification of plant cell death by electrolyte leakage assay. Bio-protoc. 8 (5), e2758(2018).
- Zhang, X. H., Yu, X. Z., Yue, D. M. Phytotoxicity of dimethyl sulfoxide (DMSO) to rice seedlings. Int J Environ Sci Technol. 13, 607-614 (2016).
- Mannan, A., et al. DMSO triggers the generation of ROS leading to an increase in artemisinin and dihydroartemisinic acid in Artemisia annua shoot cultures. Plant Cell Rep. 29, 143-152 (2010).
- Felix, G., Duran, J. D., Volko, S., Boller, T. Plants have a sensitive perception system for the most conserved domain of bacterial flagellin. Plant J. 18 (3), 265-276 (1999).
- Jourdan, E., et al. Insights into the defense-related events occurring in plant cells following perception of surfactin-type lipopeptide from Bacillus subtilis. Mol Plant Microbe Interact. 22 (4), 456-468 (2009).
- Raaijmakers, J. M., De Bruijn, I., Nybroe, O., Ongena, M. Natural functions of lipopeptides from Bacillus and Pseudomonas: more than surfactants and antibiotics. FEMS Microbiol Rev. 34 (6), 1037-1062 (2010).
- vábová, L., Lebeda, A. In vitro selection for improved plant resistance to toxin-producing pathogens. J Phytopathol. 153 (1), 52-64 (2005).
- Mousa, W. K., Raizada, M. N. The diversity of antimicrobial secondary metabolites produced by fungal endophytes: an interdisciplinary perspective. Front Microbiol. 4, 65(2013).
- Bektas, Y., Eulgem, T. Synthetic plant defense elicitors. Front Plant Sci. 5, 804(2015).
- Saeed, B., Trujillo, M. Analysis of immunity-related oxidative bursts by a luminol-based assay. Environ Responses Plants: Methods Protoc. , 339-346 (2022).
- Brauer, E. K., et al. Transcriptional and hormonal profiling of Fusarium graminearum-infected wheat reveals an association between auxin and susceptibility. Physiol Mol Plant Pathol. 107, 33-39 (2019).
- Taylor, P. The wetting of leaf surfaces. Curr Opin Colloid Interface Sci. 16 (4), 326-334 (2011).
- Mika, A., Boenisch, M. J., Hopff, D., Lüthje, S. Membrane-bound guaiacol peroxidases from maize (Zea mays L.) roots are regulated by methyl jasmonate, salicylic acid, and pathogen elicitors. J Exp Bot. 61 (3), 831-841 (2010).
- Brauer, E. K., et al. Transcriptional profiling and genetic mapping of barley responses to bacterial flagellin. Mol Plant Microbe Interact. 38 (2), 344-352 (2025).
- Takáč, T., et al. TALEN-based HvMPK3 knock-out attenuates proteome and root hair phenotypic responses to flg22 in barley. Front Plant Sci. 12, 666229(2021).
- Kim, M. G., Macoy, D. M., Lee, J. Y., Cha, J. Y., Kim, W. Y. Interactions between plant immunity, temperature, light, and circadian rhythm. J Plant Biochem Physiol. 9, 260(2021).
- Bahadoor, A., et al. Gramillin A and B: cyclic lipopeptides identified as the nonribosomal biosynthetic products of Fusarium graminearum. J Am Chem Soc. 140 (48), 16783-16791 (2018).
Reprints and Permissions
